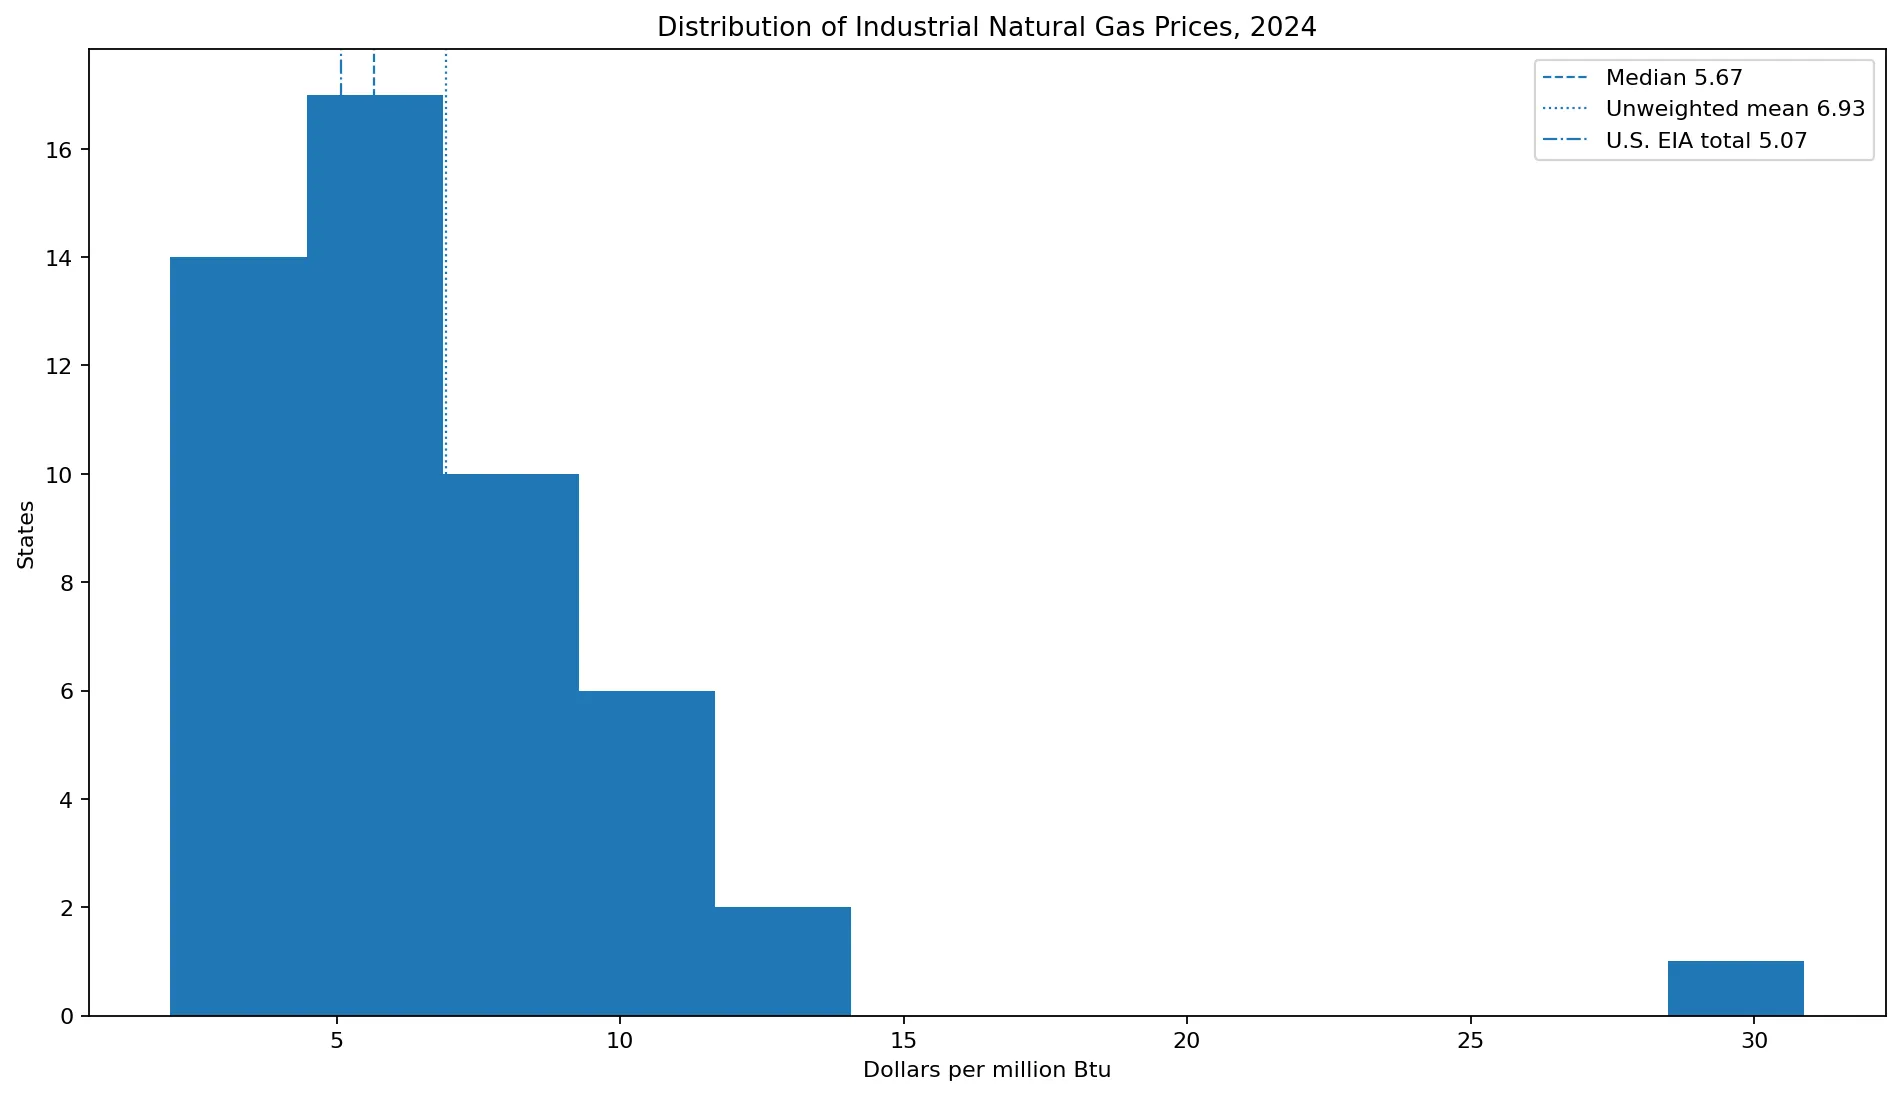
Industrial natural gas prices differed sharply across U.S. states in 2024. Among the 50 states with positive industrial-sector prices in EIA’s State Energy Data System, Hawaii was highest at $30.88 per million Btu and North Dakota was lowest at $2.07. The simple state median was $5.67/MMBtu and the unweighted mean was $6.93. EIA’s national industrial price, however, was $5.07/MMBtu. That national figure is not the arithmetic average of state prices; it reflects the national relationship between industrial natural-gas expenditures and consumption.
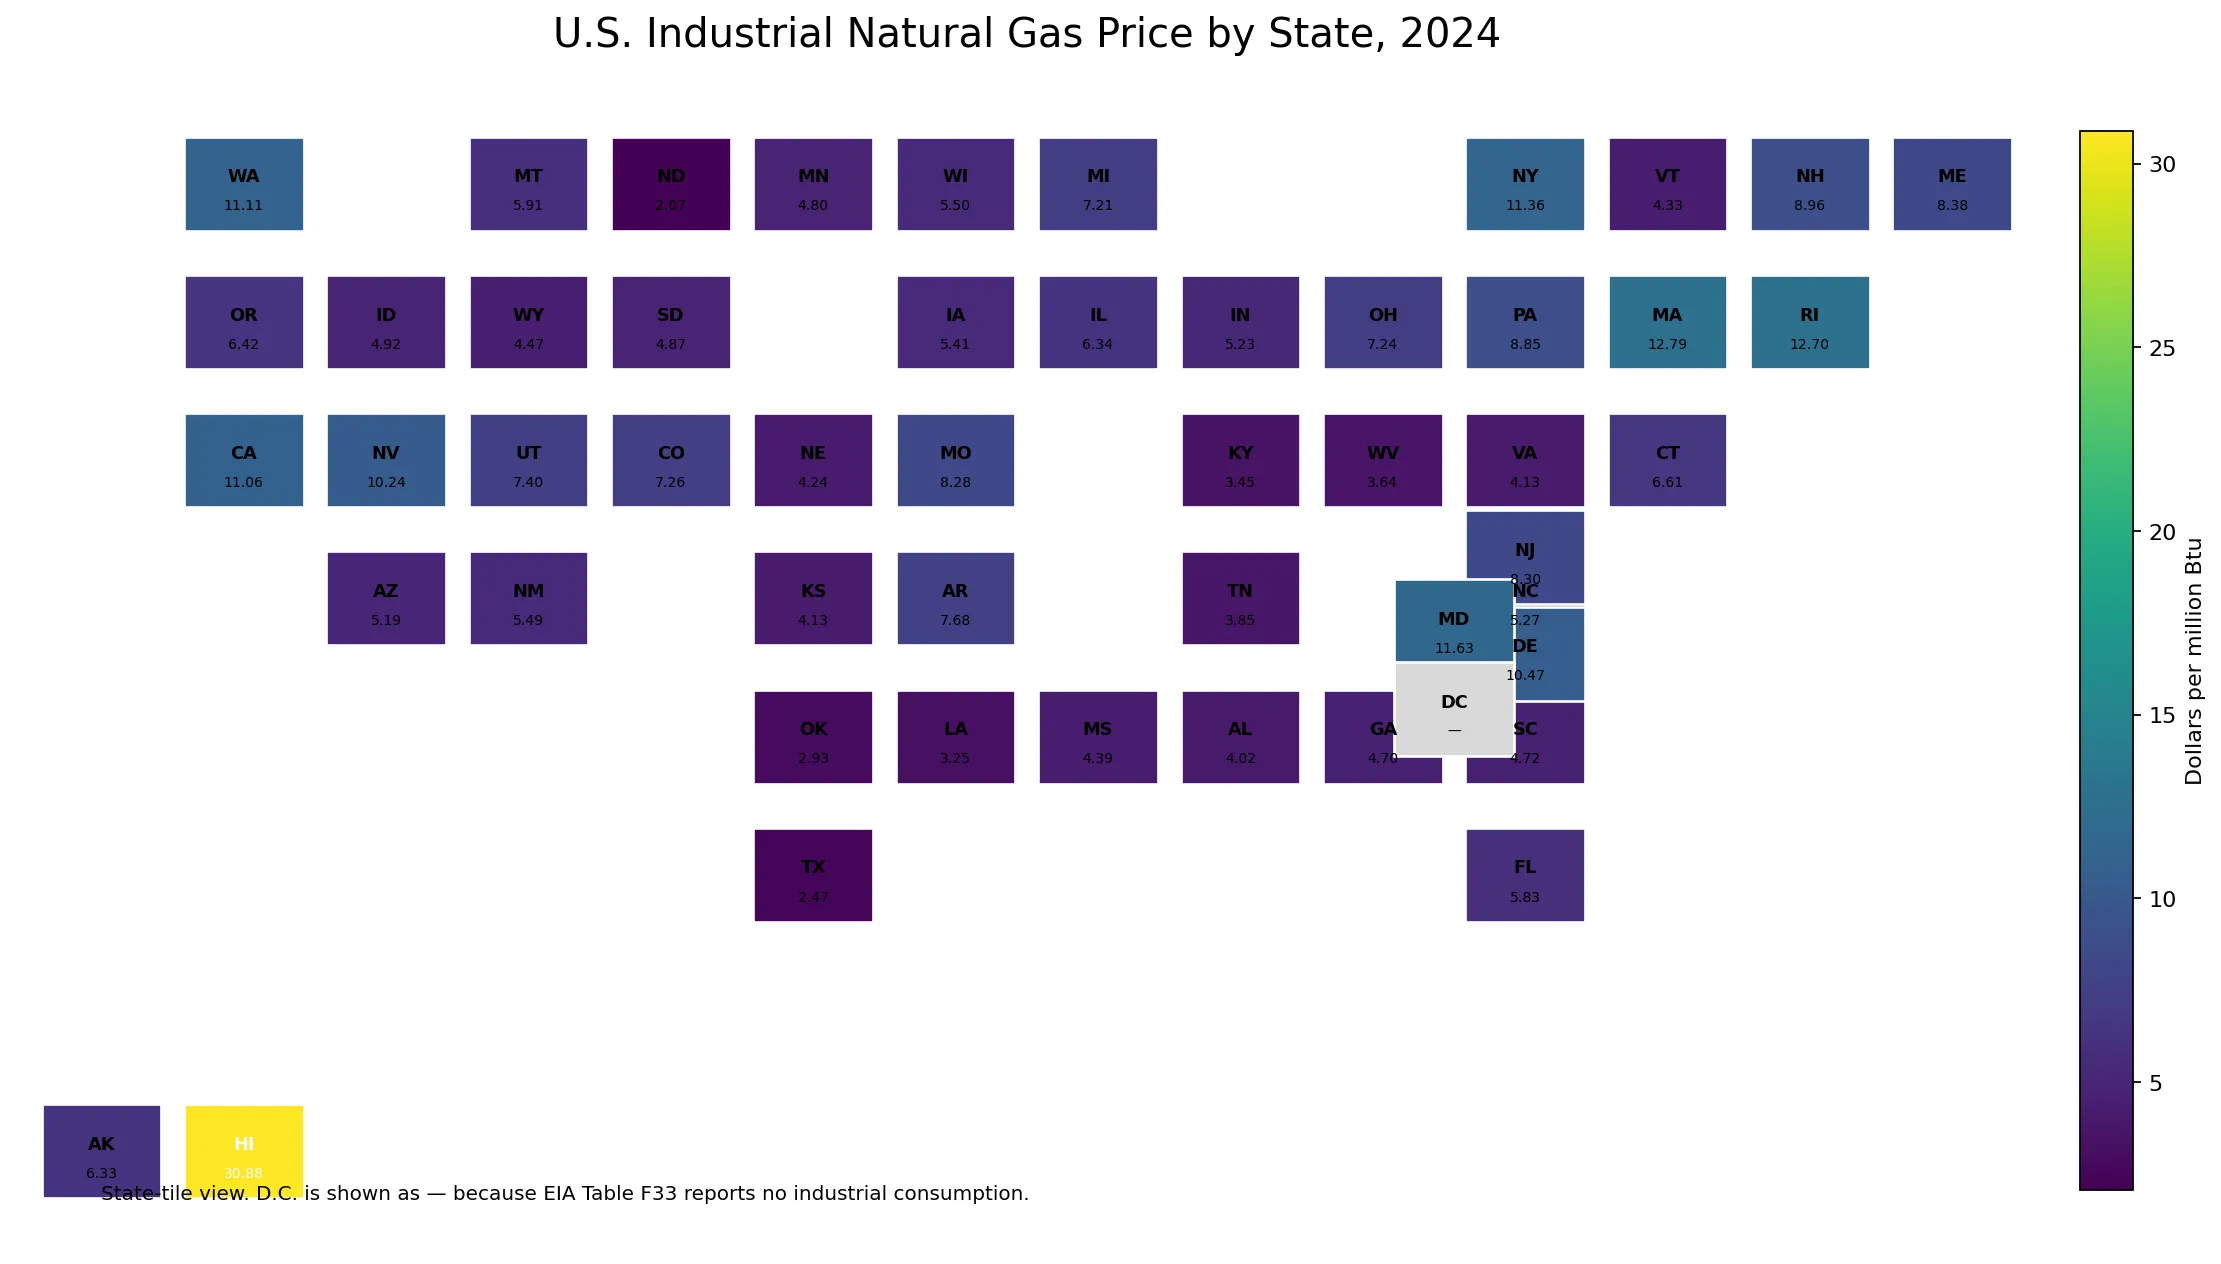
Table of Contents
What the industrial natural gas price measures
The SEDS series measures the delivered price of natural gas used by the industrial sector, expressed in dollars per million Btu. EIA notes that end-use natural gas prices are intended to include federal, state, and local taxes, surcharges, and other adjustments billed to customers. The consumption series includes supplemental gaseous fuels. This makes the measure different from a wholesale hub quotation, a production cost, or a spot price at a trading point.
Sector boundaries matter as well. For expenditure calculations, SEDS adjusts industrial consumption to remove estimated refinery consumption and lease and plant use. The price should therefore be interpreted within EIA’s industrial-sector accounting framework. It is not the residential price, the commercial price, or the price paid by electric-power plants, even when those sectors are buying natural gas in the same state.
Hawaii is the clear high-price outlier
Hawaii recorded $30.88/MMBtu, far above every other state. Massachusetts followed at $12.79, Rhode Island at $12.70, Maryland at $11.63, New York at $11.36, Washington at $11.11, and California at $11.06. The gap between Hawaii and second-place Massachusetts is more than $18/MMBtu, so Hawaii has a large effect on the unweighted state average and on the visual shape of the distribution.
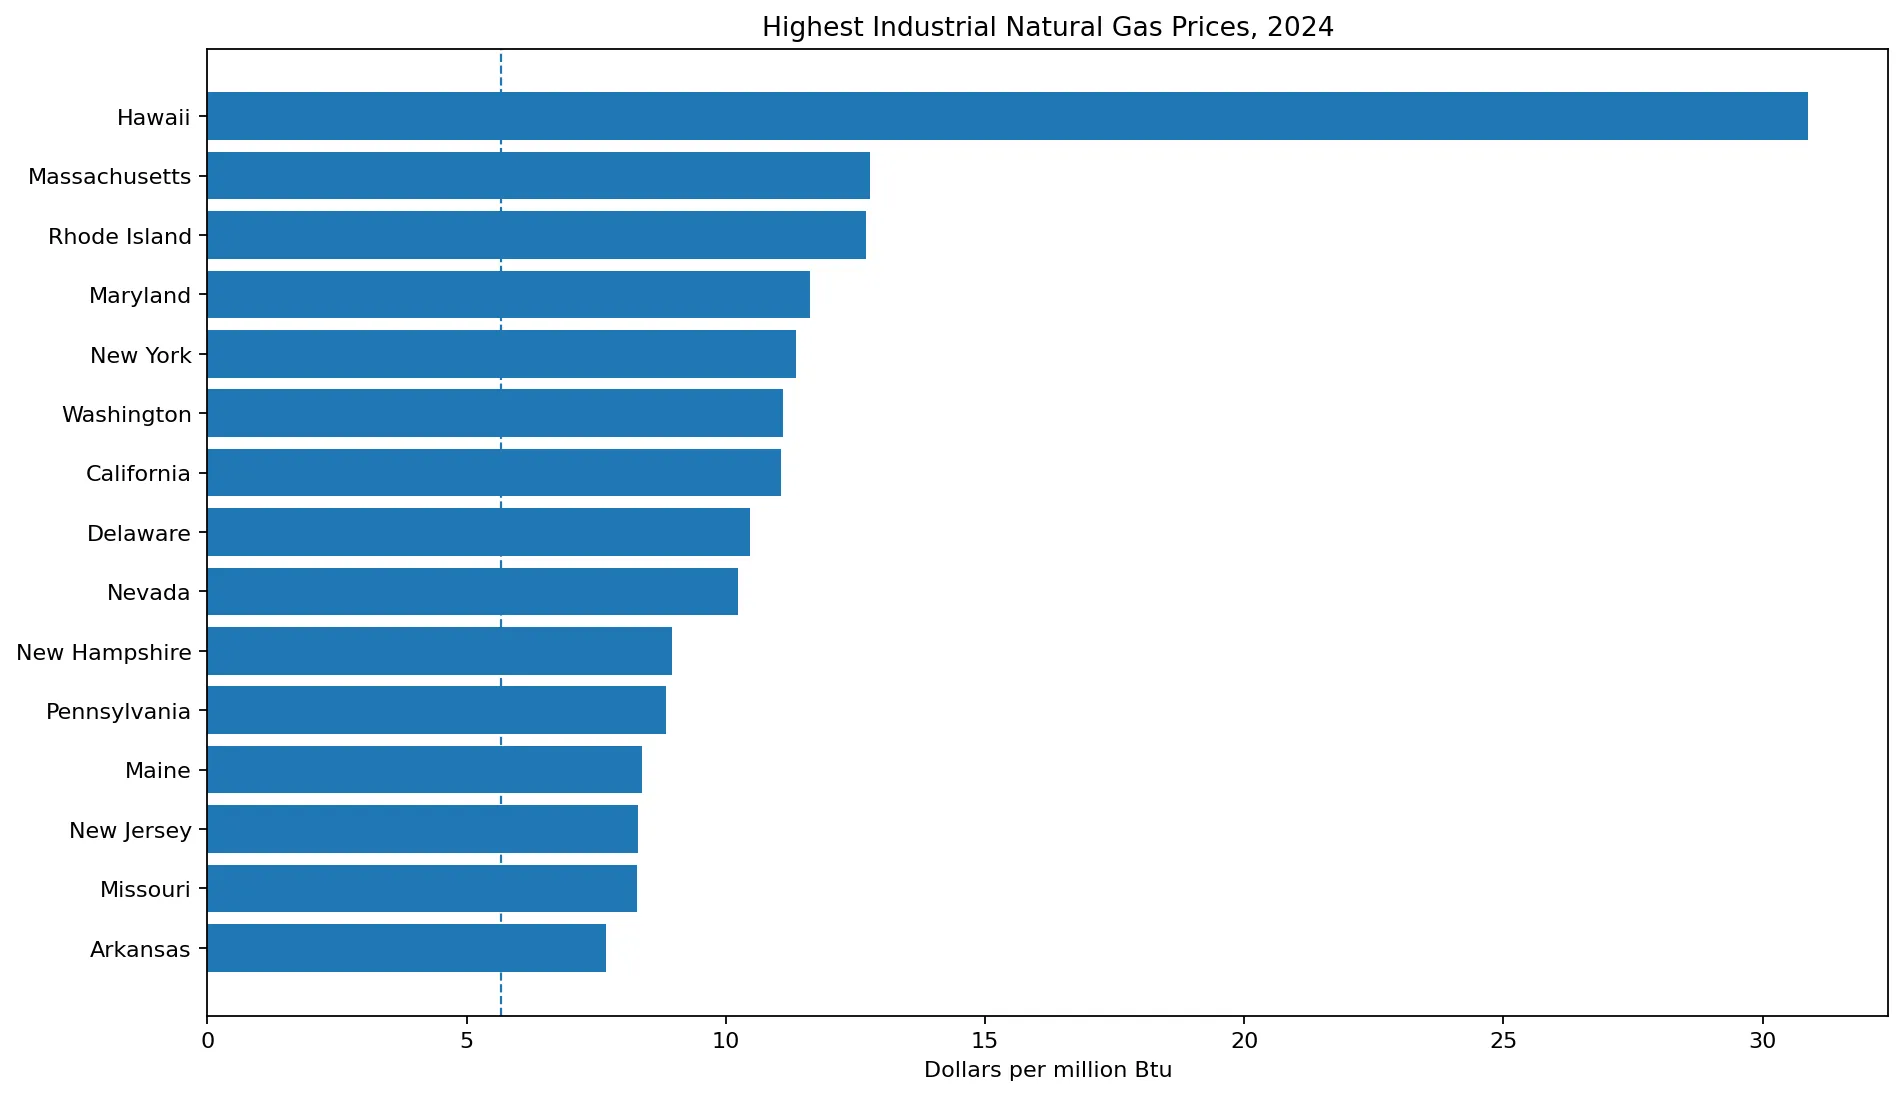
A high price does not mean that a state consumes a large volume of industrial natural gas. Price, consumption, and expenditures answer different questions. Infrastructure, local supply conditions, contract structures, transportation constraints, industrial mix, and other factors can influence observed prices, but this state-price series by itself cannot isolate the cause of a particular state’s level.
North Dakota, Texas, and Oklahoma are at the low end
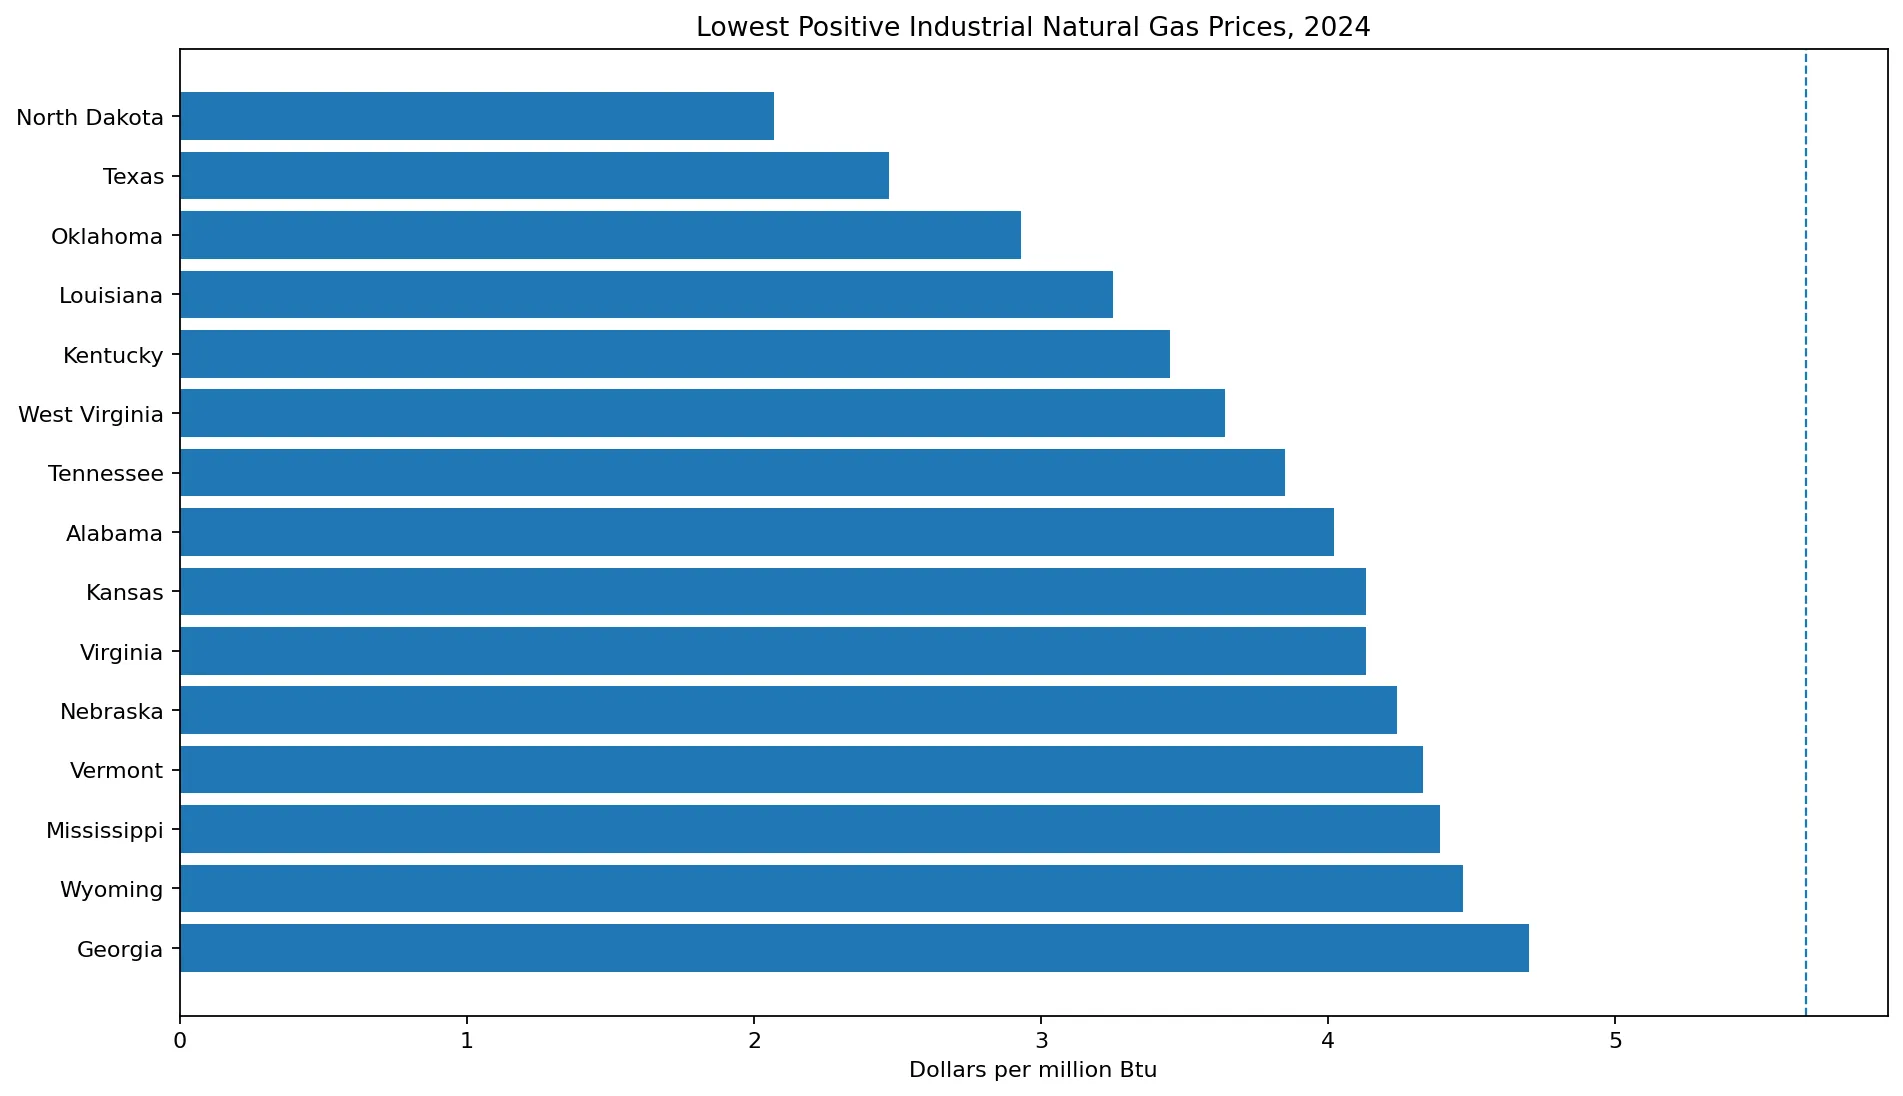
North Dakota had the lowest positive value at $2.07/MMBtu. Texas followed at $2.47, Oklahoma at $2.93, Louisiana at $3.25, Kentucky at $3.45, and West Virginia at $3.64. Tennessee and Alabama were also below $4.10/MMBtu. Several of these states are important natural-gas-producing or industrial states, but the data should not be used to claim that production alone determines industrial prices.
The highest price is about 14.9 times the lowest positive price, but that ratio is dominated by Hawaii’s exceptional value. A more representative picture comes from the middle of the distribution: the median is $5.67, while the middle 50% of states fall between roughly $4.41 and $8.30/MMBtu. Most states therefore sit much closer together than the full maximum-to-minimum range suggests.
Why the U.S. value of $5.07 differs from the $6.93 state mean
EIA Table F33 reports a 2024 U.S. industrial natural gas price of $5.07/MMBtu. If each of the 50 states is given equal weight, their simple average is $6.93. These statistics answer different questions. The simple mean describes the average of state-level price observations, regardless of how much industrial natural gas each state uses. The national price reflects the overall national relationship between industrial expenditures and consumption, so large-consuming states have much more influence.
That distinction is especially important because several major industrial gas consumers have prices below the simple state mean. A user interested in the price faced by the average state may prefer the median or unweighted mean. A user interested in the effective average price across U.S. industrial natural gas consumption should use EIA’s national figure instead.
District of Columbia should not be ranked as a $0 price
The state-level series supplied for this comparison contains a 0.00 entry for the District of Columbia, but EIA’s published 2024 Table F33 shows a dash for D.C.’s industrial natural gas price. The table footnote defines the dash as no consumption. That means D.C. should not be described as having free industrial natural gas or as the lowest-price jurisdiction. Rankings, summary statistics, and charts in this article therefore use the 50 states with positive price values and keep D.C. separate.
This treatment also prevents a misleading map. Coloring D.C. as a true zero would visually imply an extreme low price even though the official table indicates that the industrial consumption needed for the price measure is absent.
How to read the unit and sector correctly
Dollars per million Btu is an energy-normalized unit. It is useful for comparing prices across fuels and sectors, but it is not the same unit as dollars per thousand cubic feet, which appears in other natural-gas publications. Converting between them requires heat-content information. Industrial prices can also differ materially from residential or commercial prices because customer size, delivery arrangements, load profiles, tariffs, and contracts are not the same.
A single-year ranking also should not be treated as a permanent measure of industrial competitiveness. Natural gas prices can change with supply, demand, pipeline constraints, weather, storage conditions, and contract timing. Energy efficiency, fuel switching, and the amount of gas used by each industry are separate considerations. The state price series is most useful for showing the 2024 spatial pattern, not for making a complete judgment about industrial costs.
Official EIA references for the 2024 values
EIA’s Table F33 lists 2024 natural-gas prices and expenditures for residential, commercial, industrial, transportation, electric-power, and total sectors. The SEDS natural gas price technical notes explain the delivered-price concept, supplemental gaseous fuels, and sector-specific consumption adjustments. Reading the numerical table together with those definitions helps avoid confusing an industrial end-use price with a market hub price.
All 51 state jurisdictions
The table below retains all 50 states and the District of Columbia. The 50 numerical state values are comparable for ranking; D.C. is shown separately because the official EIA table marks industrial consumption as absent.
| State | 2024 value | Display |
|---|---|---|
| Hawaii | 30.88 | $/MMBtu |
| Massachusetts | 12.79 | $/MMBtu |
| Rhode Island | 12.70 | $/MMBtu |
| Maryland | 11.63 | $/MMBtu |
| New York | 11.36 | $/MMBtu |
| Washington | 11.11 | $/MMBtu |
| California | 11.06 | $/MMBtu |
| Delaware | 10.47 | $/MMBtu |
| Nevada | 10.24 | $/MMBtu |
| New Hampshire | 8.96 | $/MMBtu |
| Pennsylvania | 8.85 | $/MMBtu |
| Maine | 8.38 | $/MMBtu |
| New Jersey | 8.30 | $/MMBtu |
| Missouri | 8.28 | $/MMBtu |
| Arkansas | 7.68 | $/MMBtu |
| Utah | 7.40 | $/MMBtu |
| Colorado | 7.26 | $/MMBtu |
| Ohio | 7.24 | $/MMBtu |
| Michigan | 7.21 | $/MMBtu |
| Connecticut | 6.61 | $/MMBtu |
| Oregon | 6.42 | $/MMBtu |
| Illinois | 6.34 | $/MMBtu |
| Alaska | 6.33 | $/MMBtu |
| Montana | 5.91 | $/MMBtu |
| Florida | 5.83 | $/MMBtu |
| Wisconsin | 5.50 | $/MMBtu |
| New Mexico | 5.49 | $/MMBtu |
| Iowa | 5.41 | $/MMBtu |
| North Carolina | 5.27 | $/MMBtu |
| Indiana | 5.23 | $/MMBtu |
| Arizona | 5.19 | $/MMBtu |
| Idaho | 4.92 | $/MMBtu |
| South Dakota | 4.87 | $/MMBtu |
| Minnesota | 4.80 | $/MMBtu |
| South Carolina | 4.72 | $/MMBtu |
| Georgia | 4.70 | $/MMBtu |
| Wyoming | 4.47 | $/MMBtu |
| Mississippi | 4.39 | $/MMBtu |
| Vermont | 4.33 | $/MMBtu |
| Nebraska | 4.24 | $/MMBtu |
| Kansas | 4.13 | $/MMBtu |
| Virginia | 4.13 | $/MMBtu |
| Alabama | 4.02 | $/MMBtu |
| Tennessee | 3.85 | $/MMBtu |
| West Virginia | 3.64 | $/MMBtu |
| Kentucky | 3.45 | $/MMBtu |
| Louisiana | 3.25 | $/MMBtu |
| Oklahoma | 2.93 | $/MMBtu |
| Texas | 2.47 | $/MMBtu |
| North Dakota | 2.07 | $/MMBtu |
| District of Columbia | — | EIA table: no consumption |
Frequently Asked Questions
Which state had the highest industrial natural gas price in 2024?
Hawaii was highest at $30.88 per million Btu. Massachusetts was second at $12.79/MMBtu.
Which state had the lowest positive industrial natural gas price?
North Dakota was lowest at $2.07/MMBtu. D.C. should not be ranked at zero because EIA Table F33 marks industrial consumption as absent.
Why is the U.S. price $5.07 while the simple state average is $6.93?
The $6.93 figure gives each state equal weight. EIA’s $5.07 national value reflects national industrial consumption and expenditures, so large-consuming states have more influence.
Is the industrial natural gas price the same as the residential price?
No. EIA publishes separate prices for residential, commercial, industrial, transportation, and electric-power sectors.
Related Articles
Green Map creates custom-edited map images using open geographic data sources such as geoBoundaries, Natural Earth, OpenStreetMap, and government open data. These maps are edited visual materials, not raw data files, and are provided for education, documents, presentations, and graphic reference.