Broad money growth measures the annual percentage change in a broad measure of the money stock. The verified World Bank file contains 166 latest non-empty observations, but the reference years differ substantially. 75 observations are dated 2025 and 40 are dated 2024, while some economies have much older latest values. The full latest-observation list should therefore be separated from a strict same-year comparison.
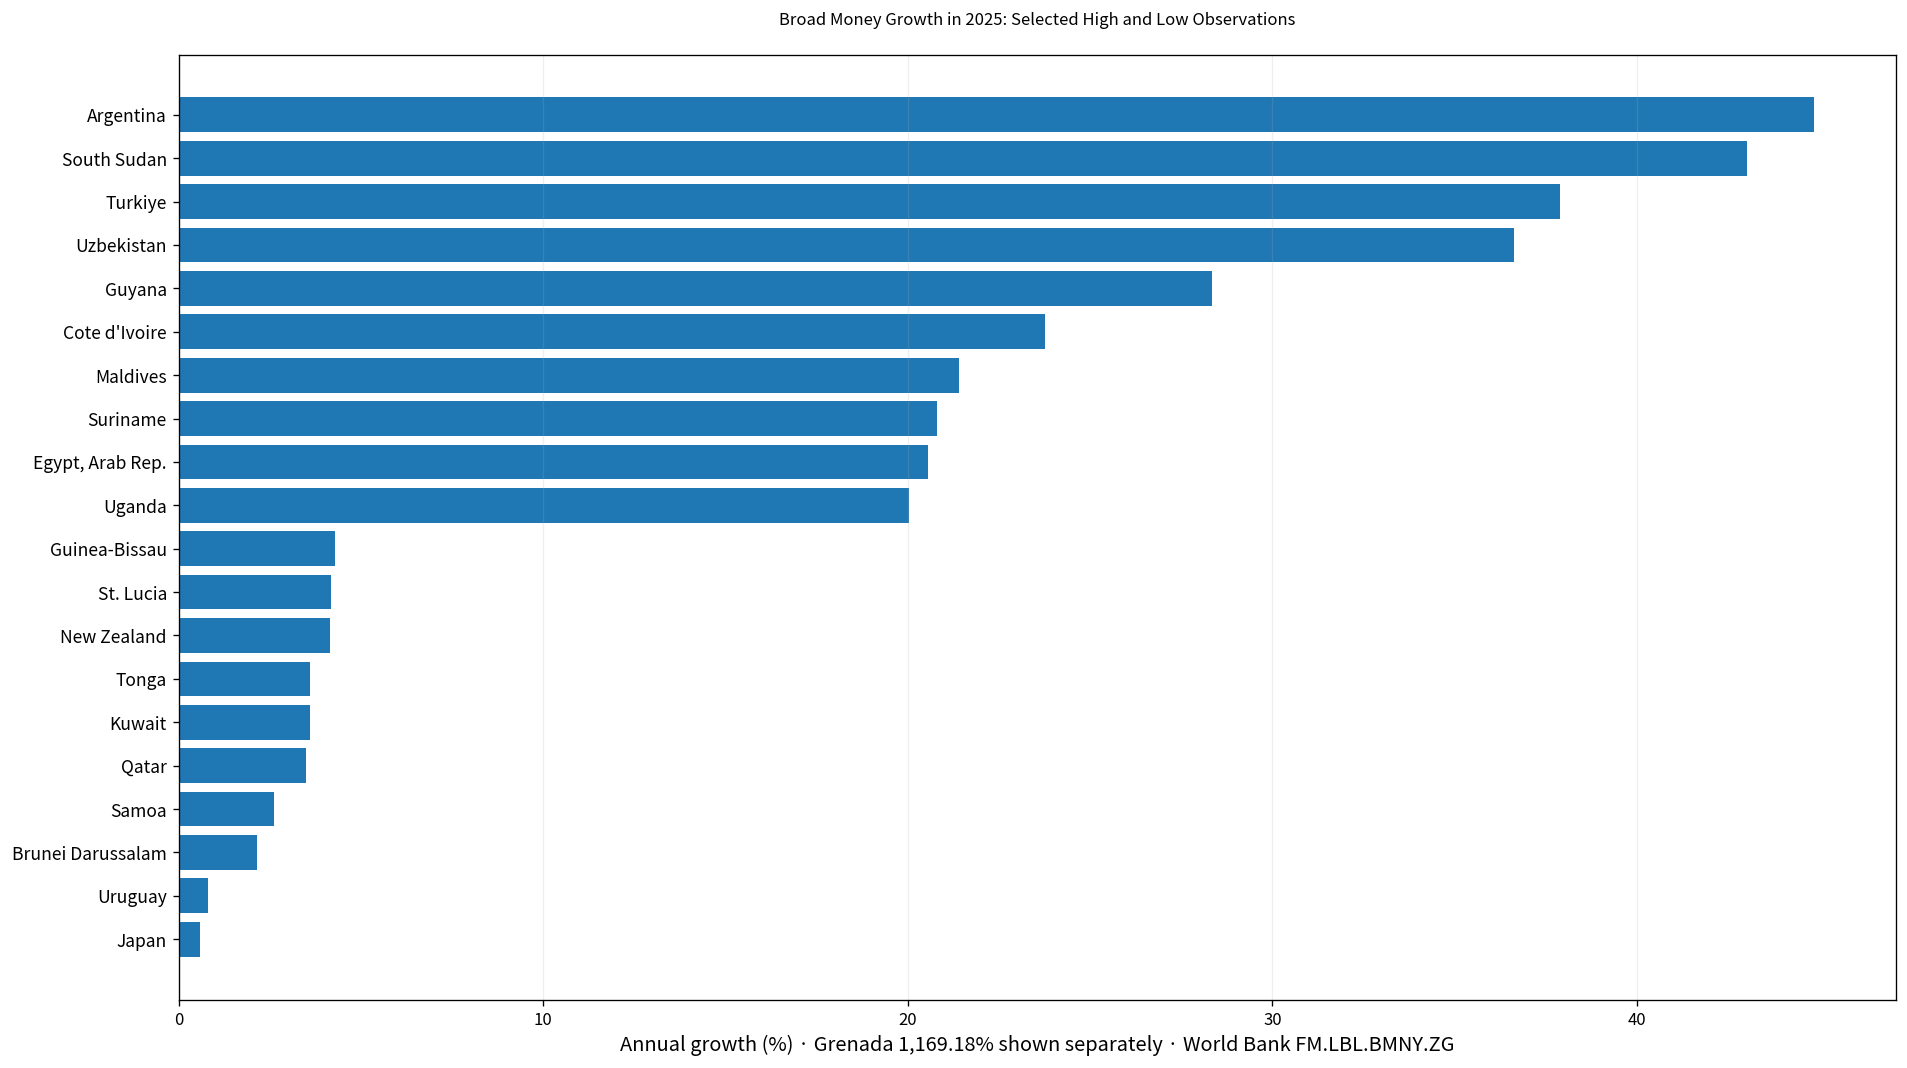
Table of Contents
What broad money growth measures
Broad money is a wide measure of money holdings that extends beyond currency used directly for payments to include deposit-like liquid financial assets. The World Bank indicator reports the year-over-year percentage change in that broad money aggregate. A reading of 10% means the broad money stock increased by about 10% from the previous year. It does not mean consumer prices rose 10%, nor does it mean real GDP grew 10%.
Money growth can be associated with changes in bank deposits, credit conditions, liquidity, and the wider financial system, but this indicator does not isolate a cause. A fast increase in broad money does not mechanically produce the same inflation rate. Understanding the macroeconomic implications requires other variables such as inflation, interest rates, credit growth, nominal GDP, exchange rates, and banking data.
The 166 latest observations span 1989 to 2025
The verified data include 75 observations from 2025, 40 from 2024, 10 from 2023, and 8 from 2022. Additional latest observations fall in earlier years, with the oldest in 1989. This makes the full file useful as an availability view but unsuitable as a single current-year ranking.
| Observation year | Economies/territories | Share of 166 |
|---|---|---|
| 2025 | 75 | 45.2% |
| 2024 | 40 | 24.1% |
| 2023 | 10 | 6.0% |
| 2022 | 8 | 4.8% |
| 2021 | 7 | 4.2% |
| 2020 | 6 | 3.6% |
| 2019 | 4 | 2.4% |
| 2018 | 1 | 0.6% |
| 2017 | 3 | 1.8% |
| 2016 | 2 | 1.2% |
| 2015 | 1 | 0.6% |
| 2014 | 1 | 0.6% |
| 2013 | 2 | 1.2% |
| 2011 | 1 | 0.6% |
| 2010 | 1 | 0.6% |
| 2008 | 3 | 1.8% |
| 1989 | 1 | 0.6% |
Across all mixed-year latest observations, the simple mean is 24.25% and the median is 9.59%. 161 values are positive and 5 are negative. These are descriptive statistics for a mixed-year collection, not a 2025 world average, and the mean is strongly affected by an extreme 2025 observation.
The median among 75 observations from 2025 is 10.61%
The same-year 2025 subset contains 75 economies. Its median is 10.61%, with a first quartile of 6.51% and a third quartile of 15.61%. All 75 observations are positive, and 11 are at or above 20%.
The simple mean is 27.88%, but that number is dominated by Grenada’s 1169.18% reading. Excluding only Grenada reduces the mean for the remaining 74 observations to 12.46%, while their median is 10.58%. The median and quartiles therefore provide a much clearer picture of the center of the 2025 distribution.
Grenada’s 1,169.18% observation dominates the 2025 upper tail
Grenada is the highest 2025 observation at 1,169.18%. Argentina is second at 44.85%, followed by South Sudan at 43.02%, Turkiye at 37.90%, and Uzbekistan at 36.64%. The gap between Grenada and the second-highest value exceeds 1,100 percentage points. A single linear chart containing that outlier would compress most other bars into a narrow range, so the visual reports Grenada separately.
| 2025 rank | Economy | Broad money growth |
|---|---|---|
| 1 | Grenada | 1169.18% |
| 2 | Argentina | 44.85% |
| 3 | South Sudan | 43.02% |
| 4 | Turkiye | 37.90% |
| 5 | Uzbekistan | 36.64% |
| 6 | Guyana | 28.36% |
| 7 | Cote d’Ivoire | 23.76% |
| 8 | Maldives | 21.41% |
| 9 | Suriname | 20.81% |
| 10 | Egypt, Arab Rep. | 20.55% |
| 11 | Uganda | 20.04% |
| 12 | Burundi | 19.81% |
| 13 | Sierra Leone | 19.13% |
| 14 | United Arab Emirates | 18.99% |
| 15 | Comoros | 18.04% |
An extreme official observation should be retained rather than silently removed, but it should not be assigned a cause without evidence. Structural changes in the financial system, base effects, statistical breaks, or other factors could be relevant, yet the verified indicator file does not establish which explanation applies. A country-specific interpretation would require central-bank monetary statistics and a longer time series.
All 75 observations from 2025 are positive
Japan is the lowest 2025 observation at 0.60%, followed by Uruguay at 0.81%, Brunei Darussalam at 2.15%, Samoa at 2.62%, and Qatar at 3.51%. Kuwait and Tonga are also near 3.6%, while New Zealand, St. Lucia, and Guinea-Bissau are in the low 4% range. The absence of negative values in this subset does not mean monetary conditions were uniformly expansionary in every other sense.
| Low-order position in 2025 | Economy | Broad money growth |
|---|---|---|
| 1 | Japan | 0.60% |
| 2 | Uruguay | 0.81% |
| 3 | Brunei Darussalam | 2.15% |
| 4 | Samoa | 2.62% |
| 5 | Qatar | 3.51% |
| 6 | Kuwait | 3.61% |
| 7 | Tonga | 3.61% |
| 8 | New Zealand | 4.14% |
| 9 | St. Lucia | 4.17% |
| 10 | Guinea-Bissau | 4.30% |
| 11 | Togo | 4.40% |
| 12 | Malaysia | 4.60% |
| 13 | St. Kitts and Nevis | 5.27% |
| 14 | St. Vincent and the Grenadines | 5.42% |
| 15 | Costa Rica | 5.64% |
A low positive rate means the broad money stock changed only modestly from the prior year, but it does not by itself prove monetary tightening or weak economic activity. Likewise, a high rate does not automatically imply strong real growth or equivalent inflation. Broad money growth is one monetary indicator and needs context from policy rates, bank credit, inflation, deposits, and output.
Mixing 2024 and 2025 changes the meaning of the ranking
The 2024 subset contains 40 observations, with a median of 7.33% and a mean of 9.08%. Its range runs from -3.84% to 45.13%. Combining these values directly with 2025 would compare changes that occurred under different monetary and economic conditions. The mixed-year table is therefore best used to show availability, while the 2025 subset supports same-year comparison.
The issue is even clearer for economies whose latest non-empty observation is dated 2008 or 1989. Those figures remain valid historical observations, but they do not describe current money growth. Removing them would hide the data gap, while relabeling them as recent would distort the evidence. Keeping the original year beside every value is the transparent approach.
Broad money growth is not inflation or GDP growth
Broad money growth tracks a monetary aggregate. Inflation measures changes in prices, while GDP growth measures changes in production. The indicators can interact, but they do not move one-for-one. Money growth may be absorbed through changes in saving, financial intermediation, asset holdings, credit demand, or real activity, and the relationship can vary across economies and time.
For that reason, a high broad money growth rate should not be described as proof of inflationary pressure without additional evidence. A low rate should not automatically be labeled restrictive either. Policy rates, bank balance sheets, credit growth, deposit composition, exchange-rate conditions, and central-bank operations can all affect the broader interpretation.
Complete list of the 166 latest observations
The table below lists every latest non-empty observation in the verified CSV, ordered alphabetically. The observation year is shown explicitly so that older values are not mistaken for current readings. No missing value is replaced with zero, and no historical observation is projected forward.
| Economy | Observation year | Broad money growth |
|---|---|---|
| Afghanistan | 2020 | 12.06% |
| Albania | 2024 | 5.12% |
| Algeria | 2024 | 9.03% |
| Angola | 2025 | 8.52% |
| Antigua and Barbuda | 2025 | 5.94% |
| Argentina | 2025 | 44.85% |
| Armenia | 2025 | 17.76% |
| Aruba | 2023 | 0.79% |
| Australia | 2025 | 6.66% |
| Azerbaijan | 2025 | 7.24% |
| Bahamas, The | 2022 | 9.36% |
| Bahrain | 2015 | 2.95% |
| Bangladesh | 2025 | 8.11% |
| Barbados | 2023 | 0.94% |
| Belarus | 2021 | 6.99% |
| Belize | 2025 | 5.95% |
| Benin | 2025 | 15.34% |
| Bhutan | 2024 | 11.51% |
| Bolivia | 2025 | 13.70% |
| Bosnia and Herzegovina | 2024 | 9.34% |
| Botswana | 2024 | 4.80% |
| Brazil | 2025 | 9.85% |
| Brunei Darussalam | 2025 | 2.15% |
| Bulgaria | 2024 | 8.74% |
| Burkina Faso | 2025 | 17.38% |
| Burundi | 2025 | 19.81% |
| Cabo Verde | 2025 | 9.22% |
| Cambodia | 2025 | 12.90% |
| Cameroon | 2018 | 13.94% |
| Canada | 2008 | 14.92% |
| Central African Republic | 2022 | 2.49% |
| Chad | 2021 | 13.63% |
| Chile | 2024 | -2.12% |
| China | 2024 | 6.81% |
| Colombia | 2025 | 11.91% |
| Comoros | 2025 | 18.04% |
| Congo, Dem. Rep. | 2021 | 34.81% |
| Congo, Rep. | 2023 | 9.64% |
| Costa Rica | 2025 | 5.64% |
| Cote d’Ivoire | 2025 | 23.76% |
| Czechia | 2024 | 7.35% |
| Denmark | 2024 | 1.45% |
| Djibouti | 2024 | 3.55% |
| Dominica | 2025 | 9.97% |
| Dominican Republic | 2025 | 11.95% |
| Ecuador | 2025 | 13.65% |
| Egypt, Arab Rep. | 2025 | 20.55% |
| El Salvador | 2025 | 13.28% |
| Equatorial Guinea | 2023 | 8.73% |
| Eritrea | 2014 | 12.91% |
| Eswatini | 2022 | 3.62% |
| Ethiopia | 2008 | 23.39% |
| Fiji | 2023 | 8.76% |
| Gabon | 2019 | 1.36% |
| Gambia, The | 2024 | 7.83% |
| Georgia | 2025 | 16.56% |
| Ghana | 2024 | 32.98% |
| Grenada | 2025 | 1169.18% |
| Guatemala | 2025 | 14.49% |
| Guinea | 2024 | 35.79% |
| Guinea-Bissau | 2025 | 4.30% |
| Guyana | 2025 | 28.36% |
| Haiti | 2023 | -9.64% |
| Honduras | 2025 | 10.69% |
| Hong Kong SAR, China | 2025 | 11.21% |
| Hungary | 2024 | 9.50% |
| Iceland | 2024 | 11.66% |
| India | 2021 | 11.30% |
| Indonesia | 2025 | 9.60% |
| Iran, Islamic Rep. | 2016 | 27.96% |
| Iraq | 2024 | -3.84% |
| Israel | 2025 | 6.36% |
| Jamaica | 2025 | 12.83% |
| Japan | 2025 | 0.60% |
| Jordan | 2024 | 6.09% |
| Kazakhstan | 2025 | 15.53% |
| Kenya | 2024 | 1.01% |
| Korea, Rep. | 2024 | 6.55% |
| Kosovo | 2024 | 12.39% |
| Kuwait | 2025 | 3.61% |
| Kyrgyz Republic | 2022 | 30.59% |
| Lao PDR | 2010 | 39.13% |
| Lebanon | 2017 | 4.21% |
| Lesotho | 2020 | 17.12% |
| Liberia | 2024 | 1.82% |
| Libya | 2021 | -20.26% |
| Macao SAR, China | 2025 | 7.50% |
| Madagascar | 2024 | 13.95% |
| Malawi | 2024 | 45.13% |
| Malaysia | 2025 | 4.60% |
| Maldives | 2025 | 21.41% |
| Mali | 2025 | 12.00% |
| Mauritania | 2019 | 9.95% |
| Mauritius | 2025 | 8.58% |
| Mexico | 2025 | 8.76% |
| Micronesia, Fed. Sts. | 2021 | 15.42% |
| Moldova | 2025 | 12.26% |
| Mongolia | 2024 | 15.02% |
| Montenegro | 2025 | 9.83% |
| Morocco | 2025 | 9.32% |
| Mozambique | 2025 | 9.32% |
| Myanmar | 2020 | 18.18% |
| Namibia | 2021 | 6.76% |
| Nepal | 2025 | 12.93% |
| New Zealand | 2025 | 4.14% |
| Nicaragua | 2022 | 11.33% |
| Niger | 2025 | 10.61% |
| Nigeria | 2023 | 50.92% |
| North Macedonia | 2024 | 10.20% |
| Norway | 2024 | 3.45% |
| Oman | 2017 | 4.18% |
| Pakistan | 2025 | 15.70% |
| Panama | 2008 | 14.58% |
| Papua New Guinea | 2019 | 4.42% |
| Paraguay | 2024 | 10.94% |
| Peru | 2022 | 9.31% |
| Philippines | 2022 | 7.82% |
| Poland | 2024 | 9.24% |
| Qatar | 2025 | 3.51% |
| Romania | 2025 | 7.23% |
| Russian Federation | 2020 | 16.66% |
| Rwanda | 2024 | 18.76% |
| Samoa | 2025 | 2.62% |
| Sao Tome and Principe | 2024 | 0.50% |
| Saudi Arabia | 2017 | 0.15% |
| Senegal | 2025 | 13.34% |
| Serbia | 2024 | 13.52% |
| Seychelles | 2025 | 10.94% |
| Sierra Leone | 2025 | 19.13% |
| Singapore | 2020 | 13.19% |
| Solomon Islands | 2024 | 3.83% |
| Somalia, Fed. Rep. | 1989 | 162.81% |
| South Africa | 2025 | 8.17% |
| South Sudan | 2025 | 43.02% |
| Sri Lanka | 2019 | 8.32% |
| St. Kitts and Nevis | 2025 | 5.27% |
| St. Lucia | 2025 | 4.17% |
| St. Vincent and the Grenadines | 2025 | 5.42% |
| Sudan | 2020 | 87.99% |
| Suriname | 2025 | 20.81% |
| Sweden | 2024 | 0.31% |
| Switzerland | 2016 | 3.31% |
| Syrian Arab Republic | 2011 | -7.81% |
| Tajikistan | 2023 | 50.64% |
| Tanzania | 2023 | 14.06% |
| Thailand | 2024 | 3.37% |
| Timor-Leste | 2024 | 7.30% |
| Togo | 2025 | 4.40% |
| Tonga | 2025 | 3.61% |
| Trinidad and Tobago | 2024 | 1.03% |
| Tunisia | 2025 | 10.54% |
| Turkiye | 2025 | 37.90% |
| Uganda | 2025 | 20.04% |
| Ukraine | 2025 | 15.28% |
| United Arab Emirates | 2025 | 18.99% |
| United Kingdom | 2024 | 2.56% |
| United States | 2025 | 6.04% |
| Uruguay | 2025 | 0.81% |
| Uzbekistan | 2025 | 36.64% |
| Vanuatu | 2024 | 9.57% |
| Venezuela, RB | 2013 | 58.84% |
| Viet Nam | 2022 | 5.68% |
| West Bank and Gaza | 2024 | 7.10% |
| Yemen, Rep. | 2013 | 13.73% |
| Zambia | 2025 | 8.71% |
| Zimbabwe | 2023 | 708.93% |
How to interpret the data
First, separate the mixed-year latest-observation view from the same-year 2025 subset. Second, use medians and quartiles when a distribution contains an extreme outlier. Third, avoid inferring inflation, output, or a policy stance from money growth alone. Fourth, remember that monetary systems and statistical structures differ across economies, which can affect comparisons.
International monetary statistics can also be revised. A reader analyzing a particular country should check the latest World Bank time series and the official central-bank source, especially when an observation is unusually large. The rankings and summary statistics in this article are calculated directly from the verified CSV included in the package.
Source and calculation
The source is World Bank World Development Indicators, FM.LBL.BMNY.ZG: Broad money growth (annual %). The package contains the latest non-empty observation for each economy. The 2025 statistics use only the 75 rows dated 2025. The mean excluding Grenada is provided solely to show the outlier’s influence; the official Grenada value remains in the dataset and the full ranking.
Frequently Asked Questions
Are all 166 latest broad-money observations from 2025?
No. 75 are dated 2025, 40 are from 2024, and the rest are older latest non-empty observations.
What is the median broad money growth rate among the 2025 observations?
The median across the 75 observations dated 2025 is 10.61%. The simple mean is much higher because of Grenada's extreme value.
Does faster broad money growth mean inflation rises by the same percentage?
No. Broad money growth and inflation are different indicators, and their relationship depends on wider monetary, financial, and economic conditions.
Related Articles
Green Map creates custom-edited map images using open geographic data sources such as geoBoundaries, Natural Earth, OpenStreetMap, and government open data. These maps are edited visual materials, not raw data files, and are provided for education, documents, presentations, and graphic reference.