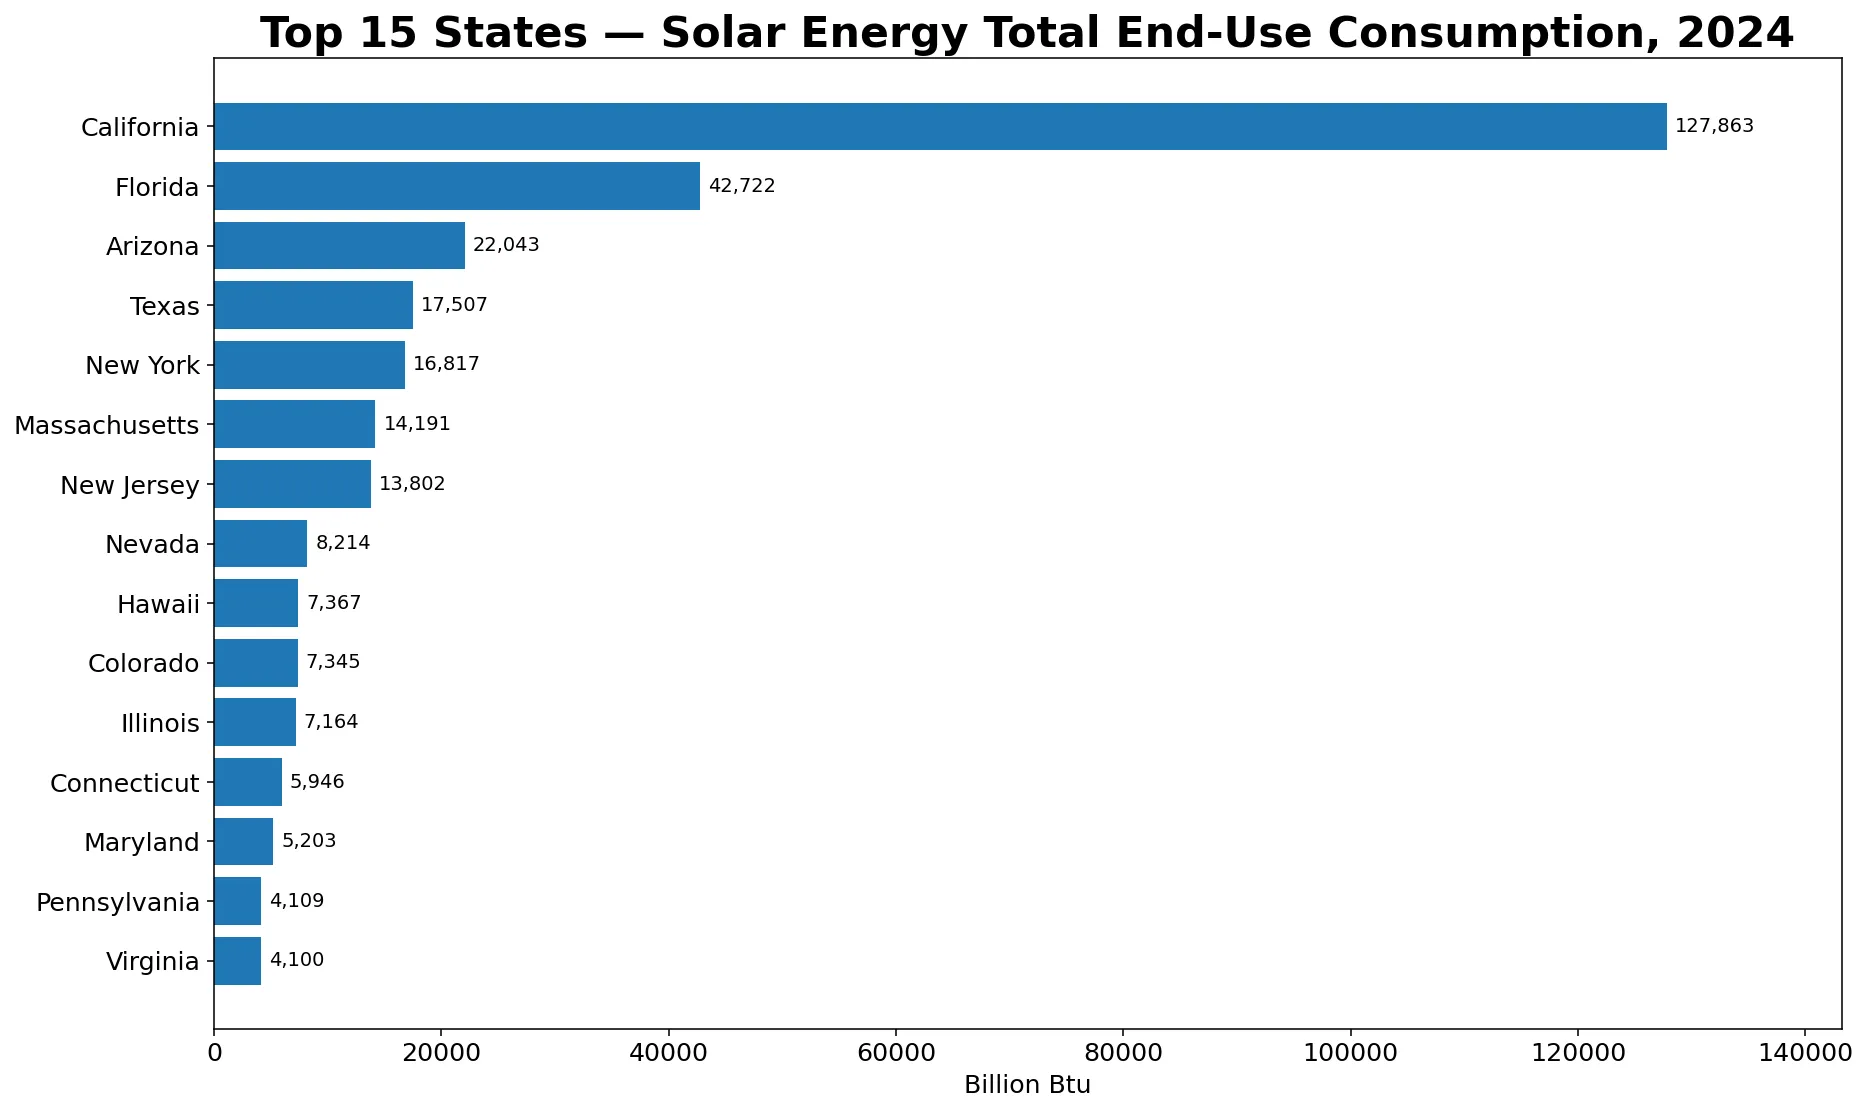
Solar energy total end-use consumption was highly concentrated in a few U.S. states in 2024. The 50 states and the District of Columbia sum to 353,965 billion Btu in the EIA State Energy Data System. California alone records 127,863 billion Btu, equal to 36.1% of the 51-jurisdiction total. Florida follows at 42,722, Arizona at 22,043, Texas at 17,507, and New York at 16,817 billion Btu.
The ranking is not a ranking of total solar generation. The EIA series is specifically solar energy total end-use consumption. Its consumption-variable appendix defines the measure as residential, commercial, and industrial solar energy consumption combined. Solar energy used in the electric-power sector is excluded from this end-use total. That distinction changes how the numbers should be interpreted.
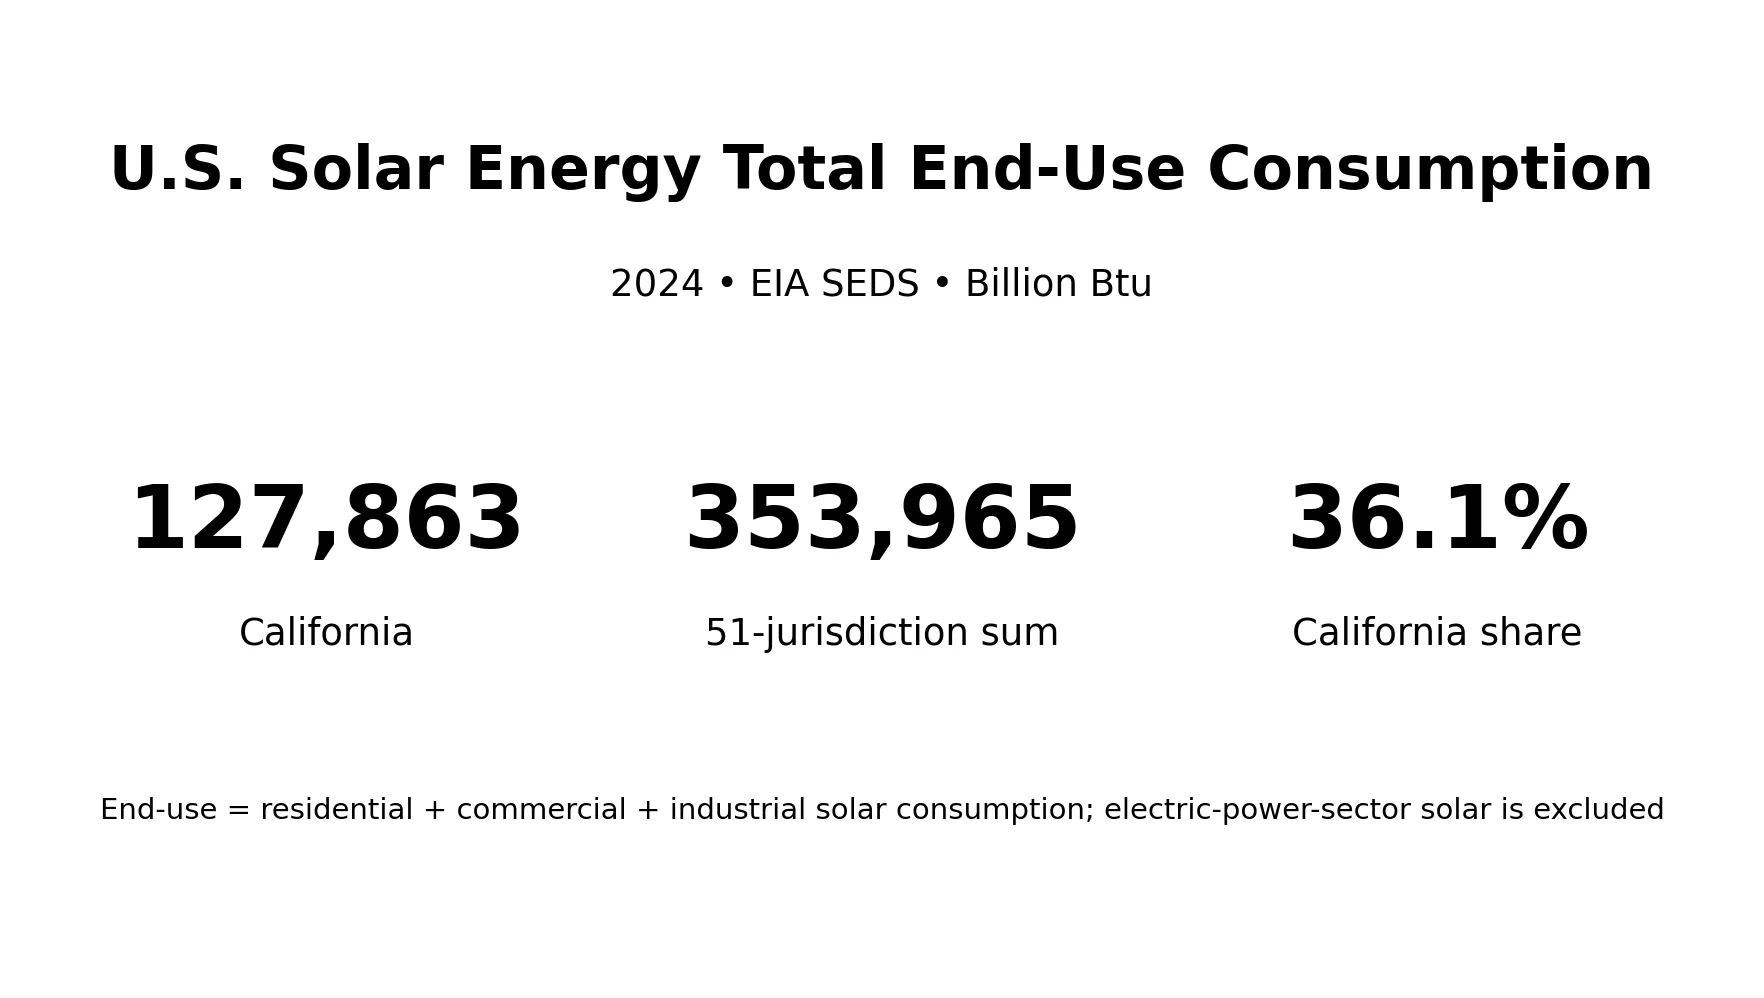
Table of Contents
What solar energy total end-use consumption includes
EIA identifies the series as SOTXB. In the SEDS appendix, SOTXB equals residential solar consumption (SORCB) plus commercial solar consumption (SOCCB) plus industrial solar consumption (SOICB). The unit is billion Btu, which places the three sectors on a common energy-content basis. Electric-power-sector solar consumption is part of broader solar total consumption but not part of SOTXB.
The residential component can reflect small-scale photovoltaic generation and solar thermal use, while the commercial and industrial components capture solar energy consumed in those sectors. Because the electric-power sector is outside the formula, a state with large utility-scale solar generation can have a different position in a generation ranking than it has in this end-use ranking.
All 51 jurisdictions have positive 2024 values. The smallest is North Dakota at 14 billion Btu, so the distribution does not depend on treating missing entries as zero. Each state and the District of Columbia is represented by a value for the same year and unit.
California accounted for more than one-third of the total
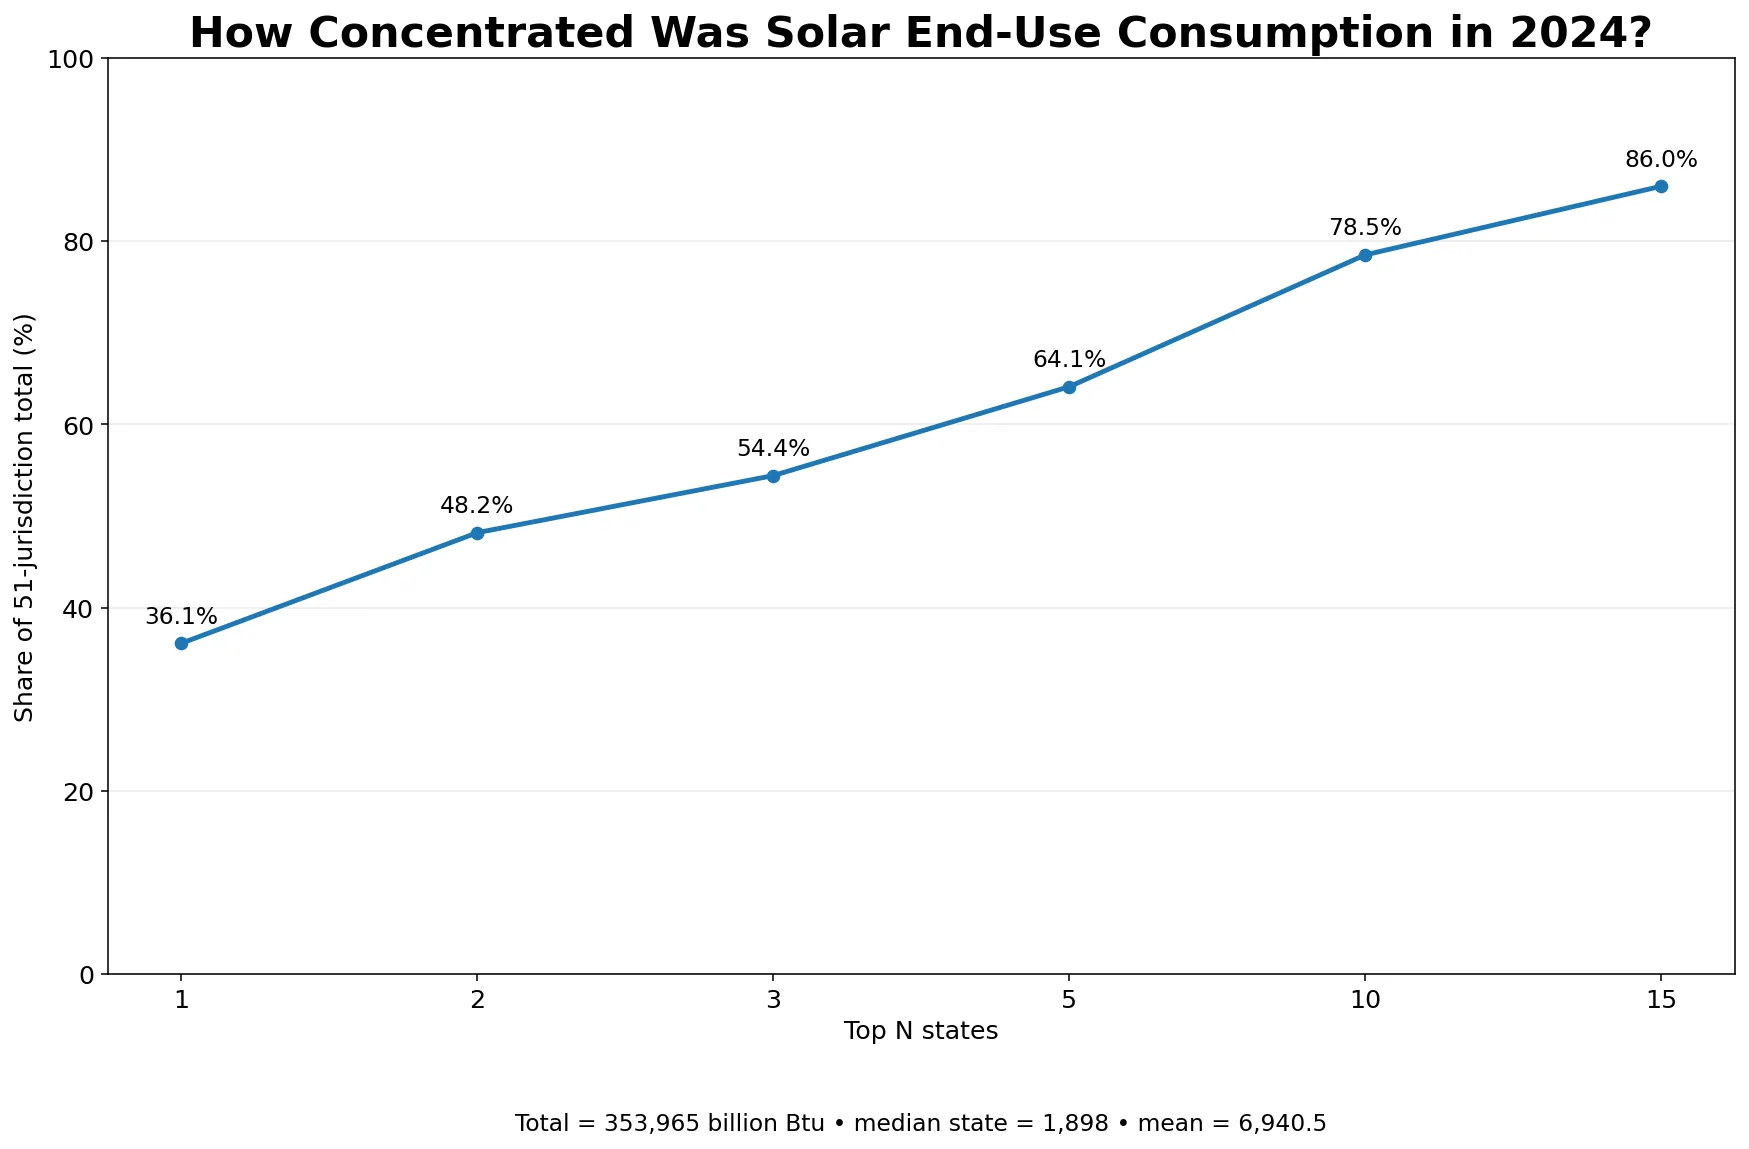
California contributes 36.1% of the total by itself. California and Florida together reach 48.2%. The top three states account for 54.4%, the top five for 64.1%, and the top ten for 78.5%. Solar end-use consumption is therefore widespread in the sense that every jurisdiction has a positive value, but the absolute totals are far from evenly distributed.
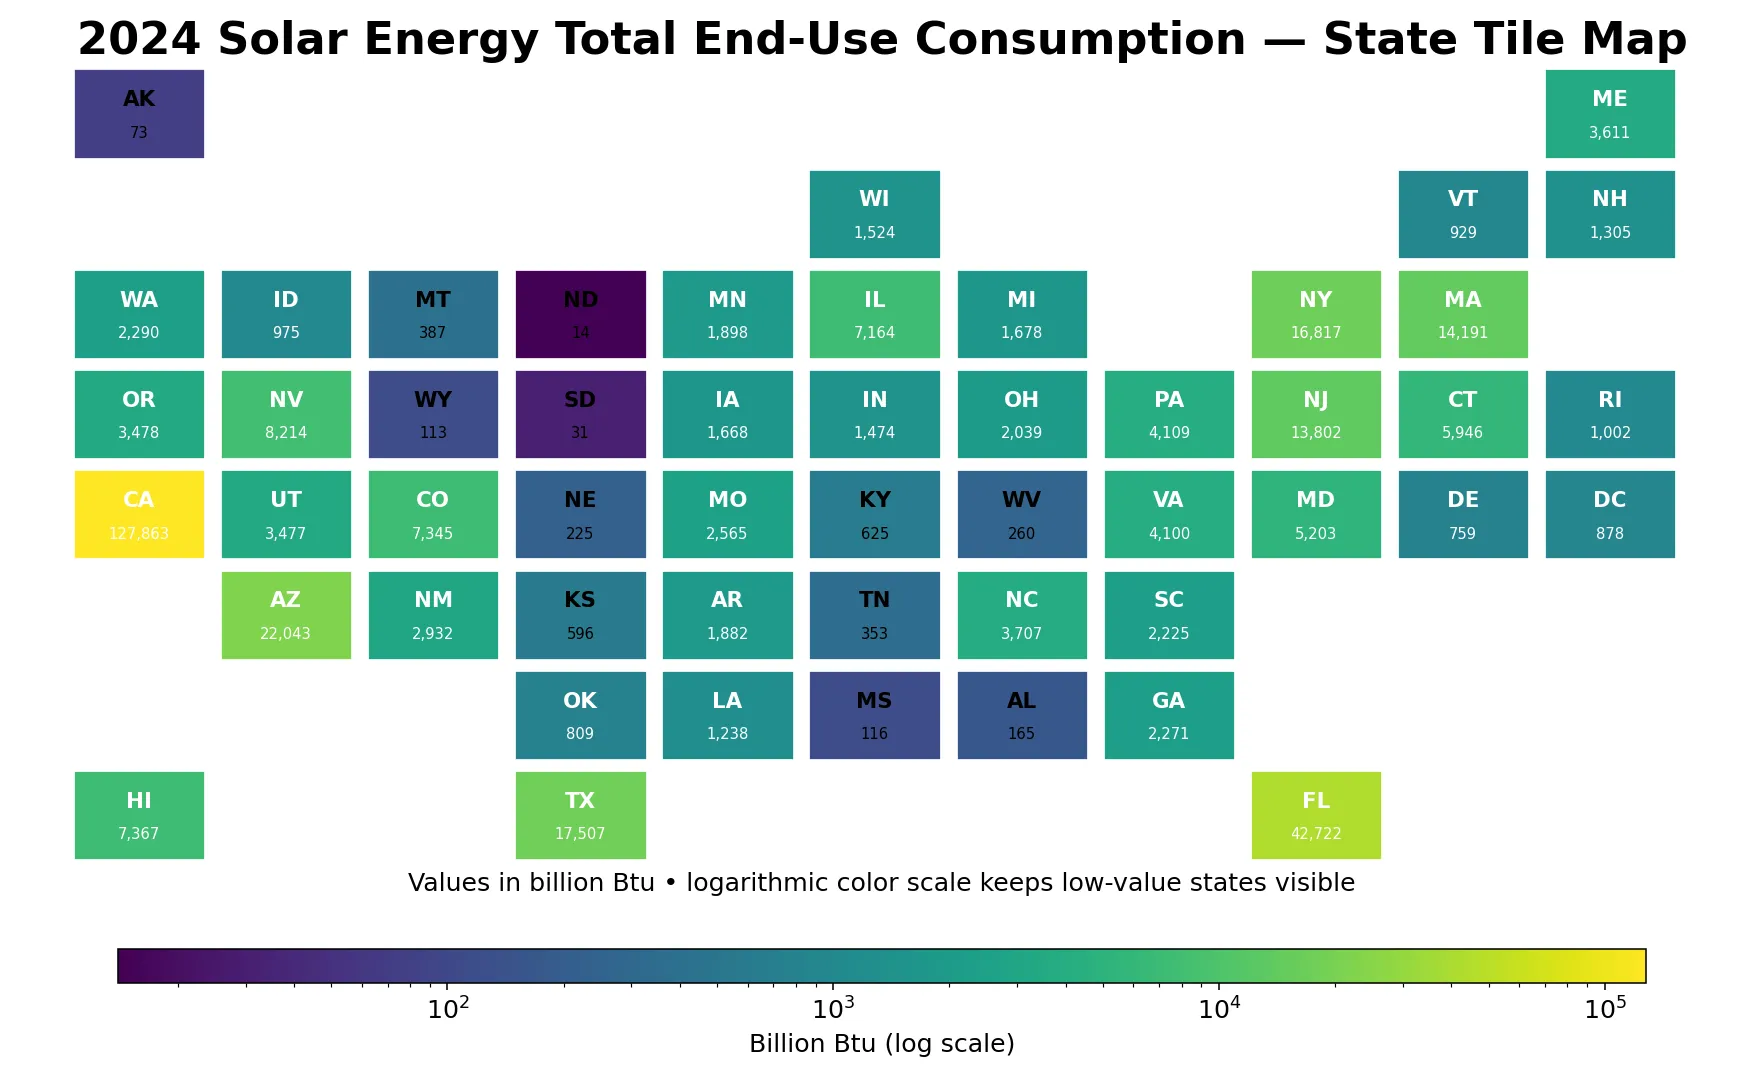
Florida’s 42,722 billion Btu is only about one-third of California’s value. Arizona ranks third at 22,043, followed by Texas at 17,507 and New York at 16,817. Massachusetts records 14,191 and New Jersey 13,802, making them the other states above 10,000 billion Btu. The next group begins with Nevada at 8,214, Hawaii at 7,367, and Colorado at 7,345.
Why the median describes a typical state better than the mean
The simple average across 51 jurisdictions is 6,940.5 billion Btu, while the median is only 1,898. The first quartile is about 784 and the third quartile about 4,656 billion Btu. The large gap between mean and median reflects a long upper tail dominated by California and, to a lesser extent, Florida and the next group of large states.
For a skewed distribution like this one, the mean should not be treated as the value of a typical state. Half of the jurisdictions are at or below 1,898 billion Btu, yet the national arithmetic mean is more than three times that level. Median, quartiles, and cumulative shares provide a more balanced description.
How far the leading states were ahead of the lower end
The top 15 are California, Florida, Arizona, Texas, New York, Massachusetts, New Jersey, Nevada, Hawaii, Colorado, Illinois, Connecticut, Maryland, Pennsylvania, and Virginia. Together they account for about 86.0% of the total. California’s bar is so long relative to the rest that it largely determines the visual scale of a conventional ranking chart.
At the other end, North Dakota records 14 billion Btu, South Dakota 31, Alaska 73, Wyoming 113, and Mississippi 116. A low end-use value does not mean that a state has no solar generation, no installed solar capacity, or no solar market. It only places that state low within this specific SEDS end-use measure.
Complete 2024 ranking for the 50 states and D.C.
The table below sorts all 51 jurisdictions by the published 2024 value. These are absolute totals, not per-capita values or intensity measures. A population-adjusted or GDP-adjusted comparison would require an additional denominator and could produce a substantially different ordering.
| Rank | State or jurisdiction | Code | Year | Billion Btu |
|---|---|---|---|---|
| 1 | California | CA | 2024 | 127,863 |
| 2 | Florida | FL | 2024 | 42,722 |
| 3 | Arizona | AZ | 2024 | 22,043 |
| 4 | Texas | TX | 2024 | 17,507 |
| 5 | New York | NY | 2024 | 16,817 |
| 6 | Massachusetts | MA | 2024 | 14,191 |
| 7 | New Jersey | NJ | 2024 | 13,802 |
| 8 | Nevada | NV | 2024 | 8,214 |
| 9 | Hawaii | HI | 2024 | 7,367 |
| 10 | Colorado | CO | 2024 | 7,345 |
| 11 | Illinois | IL | 2024 | 7,164 |
| 12 | Connecticut | CT | 2024 | 5,946 |
| 13 | Maryland | MD | 2024 | 5,203 |
| 14 | Pennsylvania | PA | 2024 | 4,109 |
| 15 | Virginia | VA | 2024 | 4,100 |
| 16 | North Carolina | NC | 2024 | 3,707 |
| 17 | Maine | ME | 2024 | 3,611 |
| 18 | Oregon | OR | 2024 | 3,478 |
| 19 | Utah | UT | 2024 | 3,477 |
| 20 | New Mexico | NM | 2024 | 2,932 |
| 21 | Missouri | MO | 2024 | 2,565 |
| 22 | Washington | WA | 2024 | 2,290 |
| 23 | Georgia | GA | 2024 | 2,271 |
| 24 | South Carolina | SC | 2024 | 2,225 |
| 25 | Ohio | OH | 2024 | 2,039 |
| 26 | Minnesota | MN | 2024 | 1,898 |
| 27 | Arkansas | AR | 2024 | 1,882 |
| 28 | Michigan | MI | 2024 | 1,678 |
| 29 | Iowa | IA | 2024 | 1,668 |
| 30 | Wisconsin | WI | 2024 | 1,524 |
| 31 | Indiana | IN | 2024 | 1,474 |
| 32 | New Hampshire | NH | 2024 | 1,305 |
| 33 | Louisiana | LA | 2024 | 1,238 |
| 34 | Rhode Island | RI | 2024 | 1,002 |
| 35 | Idaho | ID | 2024 | 975 |
| 36 | Vermont | VT | 2024 | 929 |
| 37 | District of Columbia | DC | 2024 | 878 |
| 38 | Oklahoma | OK | 2024 | 809 |
| 39 | Delaware | DE | 2024 | 759 |
| 40 | Kentucky | KY | 2024 | 625 |
| 41 | Kansas | KS | 2024 | 596 |
| 42 | Montana | MT | 2024 | 387 |
| 43 | Tennessee | TN | 2024 | 353 |
| 44 | West Virginia | WV | 2024 | 260 |
| 45 | Nebraska | NE | 2024 | 225 |
| 46 | Alabama | AL | 2024 | 165 |
| 47 | Mississippi | MS | 2024 | 116 |
| 48 | Wyoming | WY | 2024 | 113 |
| 49 | Alaska | AK | 2024 | 73 |
| 50 | South Dakota | SD | 2024 | 31 |
| 51 | North Dakota | ND | 2024 | 14 |
What this metric cannot tell you
First, it does not measure total solar electricity generation. Generation is reported in separate EIA series. Second, it is not installed solar capacity. Third, it is not the percentage of a state’s energy supplied by solar. A large state can record a large absolute solar end-use total while still having a different solar share once total energy consumption is used as the denominator.
The data also do not identify the cause of each state’s position. Population, rooftop adoption, commercial and industrial installations, climate, policy, utility structure, and many other factors may matter, but none of those causal variables is contained in this single measure. The defensible conclusions are about the observed size, ranking, and concentration of the end-use totals.
The two most important takeaways
The first takeaway is California’s scale: 127,863 billion Btu, or 36.1% of the 51-jurisdiction total. The second is definitional. Solar end-use consumption is a specialized accounting measure covering residential, commercial, and industrial use. It should not be substituted for solar generation when comparing the importance of solar power across states.
For year-to-year analysis, the series identity should remain fixed. EIA can revise historical estimates as methods and source inputs change, so a later comparison should verify the same SOTXB series, the same billion-Btu unit, and the same state coverage before calculating growth or rank changes.
Official sources and calculation basis
The comparison uses the U.S. Energy Information Administration State Energy Data System (SEDS) for 2024. EIA’s consumption-variable appendix defines solar energy total end-use consumption as residential, commercial, and industrial solar energy consumption combined. Solar energy consumed in the electric-power sector is not part of this end-use measure.
Official references: EIA State Energy Data System · SEDS Appendix A: Consumption Variables · EIA Table F40: Solar Energy Consumption Estimates.
Frequently Asked Questions
Which state had the highest solar energy total end-use consumption in 2024?
California ranked first at 127,863 billion Btu, representing about 36.1% of the 353,965-billion-Btu total across 50 states and D.C.
Is solar energy total end-use consumption the same as solar generation?
No. EIA SEDS defines this end-use series as residential, commercial, and industrial solar consumption combined. Electric-power-sector solar consumption is excluded.
Did any state have a zero value in 2024?
No. All 50 states and the District of Columbia have positive values. North Dakota is the smallest at 14 billion Btu.
Why is the mean much higher than the median?
A few very large values, especially California and Florida, pull up the average. The mean is 6,940.5 billion Btu and the median is 1,898 billion Btu.
Related Articles
Green Map creates custom-edited map images using open geographic data sources such as geoBoundaries, Natural Earth, OpenStreetMap, and government open data. These maps are edited visual materials, not raw data files, and are provided for education, documents, presentations, and graphic reference.