U.S. Energy Information Administration State Energy Data System data report the 2024 commercial-sector price of distillate fuel oil for all 50 states plus the District of Columbia. The unit is dollars per million Btu, not a retail price per gallon. Across the 51 jurisdictions, the simple mean is $19.85/MMBtu and the median $19.47/MMBtu. Alaska is highest at $22.51/MMBtu and Delaware is lowest at $18.64/MMBtu.
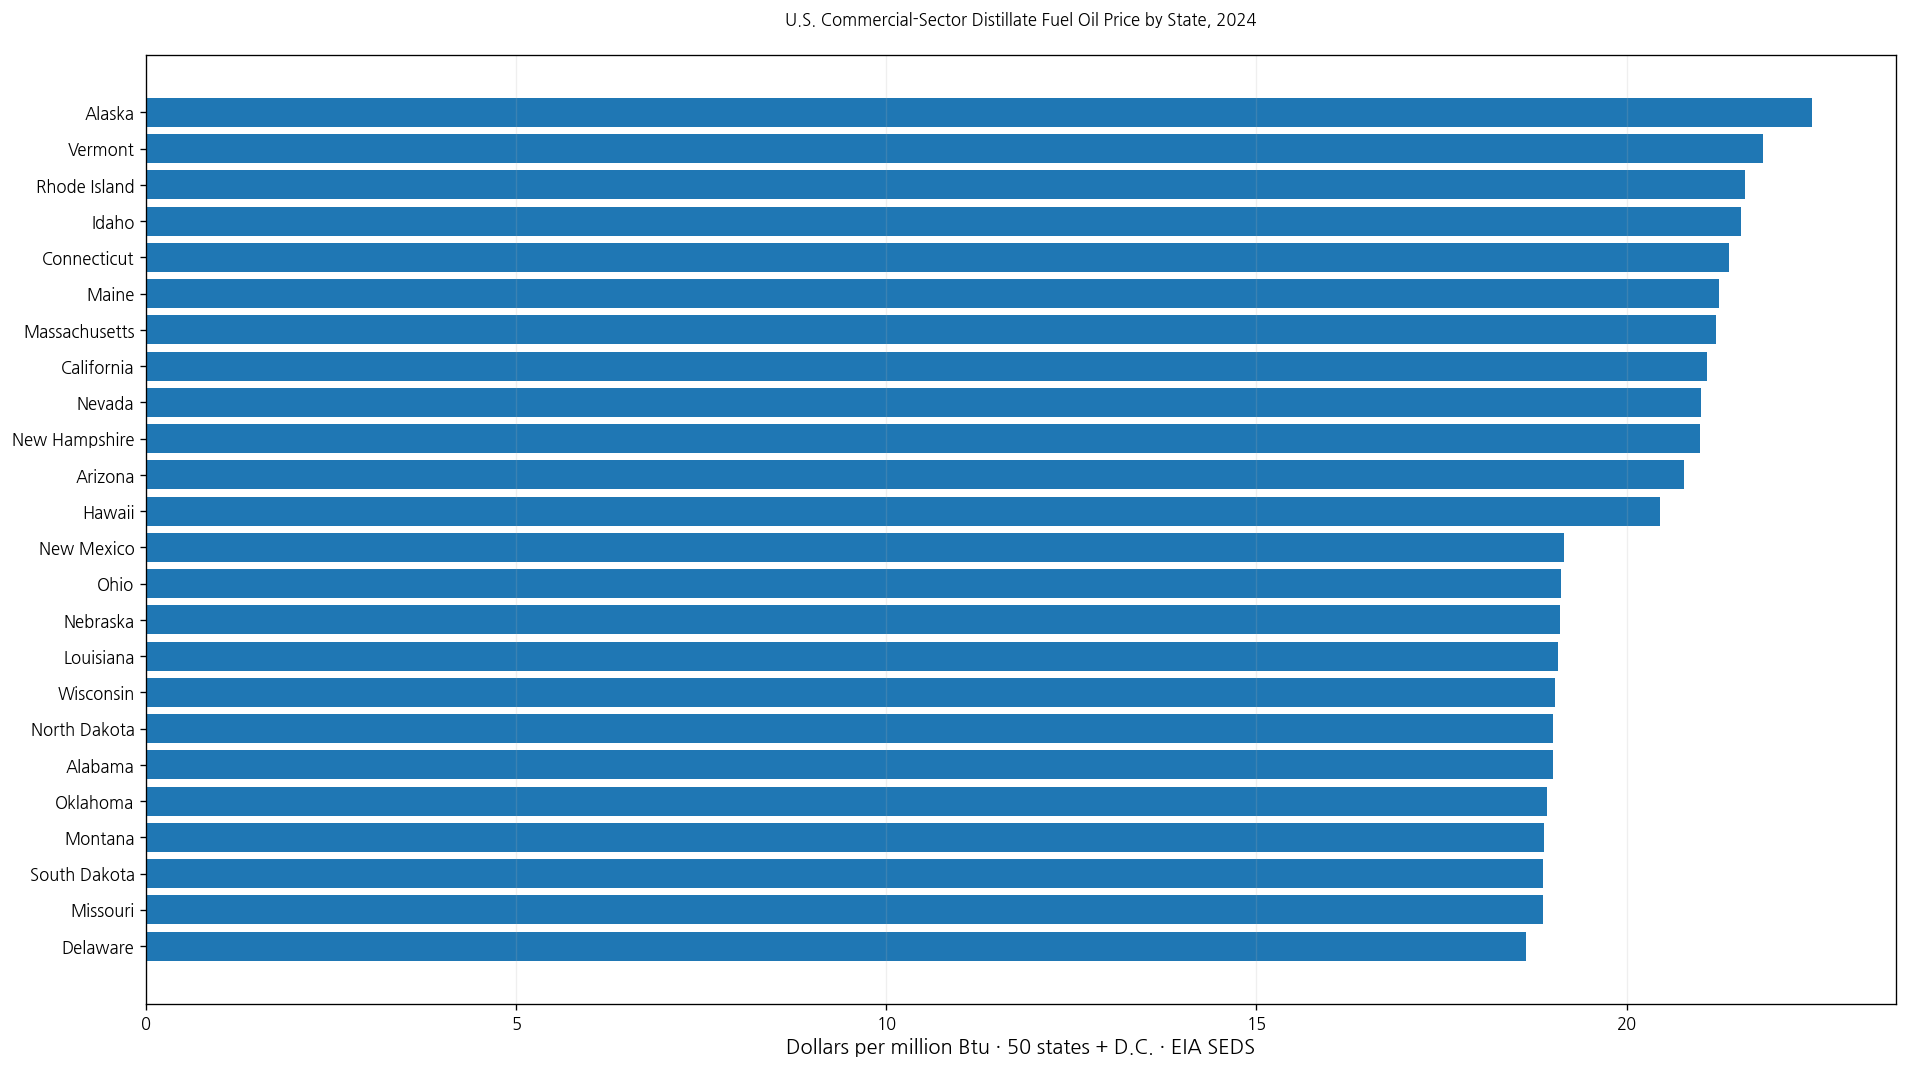
Table of Contents
What the commercial-sector distillate fuel oil price measures
This indicator is the average energy price of distillate fuel oil used in the commercial sector. It is specific to one petroleum-product category and one end-use sector, so it should not be generalized to all petroleum products or all customers in a state.
Commercial-sector use is separate from residential, industrial, transportation, and electric-power categories in SEDS. The same fuel can have different reported prices across sectors because purchasing arrangements, consumption patterns, and product mixes differ.
Dollars per million Btu is different from dollars per gallon
MMBtu means one million British thermal units. A dollars-per-MMBtu price puts fuels on a common energy basis rather than a physical-volume basis. Gallons measure volume, while Btu measures energy content.
Alaska’s $22.51/MMBtu therefore does not mean distillate fuel oil cost $22.51 per gallon. It means the reported commercial-sector average price was $22.51 for one million Btu of energy from that fuel category.
The 2024 mean is $19.85/MMBtu and the median is $19.47
The simple mean across the 50 states and D.C. is $19.85/MMBtu and the median $19.47/MMBtu. The first quartile is $19.19 and the third quartile $20.36, placing the middle half roughly between $19.19 and $20.37/MMBtu.
17 jurisdictions are at or above $20/MMBtu, 9 are at or above $21, and only 1 reaches $22 or more. At the lower end, 5 are below $19 and 34 are below $20.
Alaska is highest at $22.51/MMBtu
Alaska records the highest 2024 value at $22.51/MMBtu. Vermont follows at $21.84, Rhode Island at $21.60, Idaho at $21.55, and Connecticut at $21.39. Maine, Massachusetts, California, and Nevada are also above $21/MMBtu.
| 2024 rank | State/jurisdiction | Commercial-sector distillate fuel oil price |
|---|---|---|
| 1 | Alaska | $22.51/MMBtu |
| 2 | Vermont | $21.84/MMBtu |
| 3 | Rhode Island | $21.60/MMBtu |
| 4 | Idaho | $21.55/MMBtu |
| 5 | Connecticut | $21.39/MMBtu |
| 6 | Maine | $21.25/MMBtu |
| 7 | Massachusetts | $21.21/MMBtu |
| 8 | California | $21.09/MMBtu |
| 9 | Nevada | $21.01/MMBtu |
| 10 | New Hampshire | $20.99/MMBtu |
| 11 | Arizona | $20.77/MMBtu |
| 12 | Hawaii | $20.45/MMBtu |
| 13 | Washington | $20.40/MMBtu |
| 14 | New Jersey | $20.33/MMBtu |
| 15 | District of Columbia | $20.11/MMBtu |
The ranking establishes relative price levels, but the data do not identify a single cause for Alaska’s high value. Logistics, supply conditions, taxes and fees, contract terms, and the mix of distillate products can all influence energy prices, so causal claims require additional evidence.
Delaware is lowest at $18.64/MMBtu
Delaware records the lowest value at $18.64/MMBtu. Missouri and South Dakota are both at $18.87, Montana at $18.89, and Oklahoma at $18.92. Alabama, North Dakota, Wisconsin, Louisiana, and Nebraska are also near the low end.
| Low-order position | State/jurisdiction | Commercial-sector distillate fuel oil price |
|---|---|---|
| 1 | Delaware | $18.64/MMBtu |
| 2 | Missouri | $18.87/MMBtu |
| 3 | South Dakota | $18.87/MMBtu |
| 4 | Montana | $18.89/MMBtu |
| 5 | Oklahoma | $18.92/MMBtu |
| 6 | Alabama | $19.00/MMBtu |
| 7 | North Dakota | $19.01/MMBtu |
| 8 | Wisconsin | $19.03/MMBtu |
| 9 | Louisiana | $19.08/MMBtu |
| 10 | Nebraska | $19.10/MMBtu |
| 11 | Ohio | $19.12/MMBtu |
| 12 | New Mexico | $19.16/MMBtu |
| 13 | Iowa | $19.19/MMBtu |
| 14 | Kentucky | $19.19/MMBtu |
| 15 | Georgia | $19.22/MMBtu |
A low value does not mean every petroleum product is inexpensive in that state. It refers only to the 2024 commercial-sector distillate fuel oil price expressed per million Btu.
The high-low spread is $3.87/MMBtu
The difference between Alaska and Delaware is $3.87/MMBtu, and the highest value is about 1.21 times the lowest. Because all 51 observations are from 2024, the spread does not contain the mixed-year problem common in some international datasets.
The gap still should not be translated directly into a difference in total energy bills. Commercial users consume different amounts of distillate fuel oil and may rely heavily on electricity, natural gas, or other fuels.
Commercial and residential prices are separate measures
Residential distillate fuel oil prices apply to household use, while this indicator applies to the commercial sector. A state can have different prices across those sectors even in the same year.
Sector comparisons should keep the unit, fuel definition, and year aligned. Differences can reflect purchasing patterns and market arrangements rather than a contradiction in the data.
Price is different from average heat content
EIA also publishes heat-content measures for distillate fuel oil. Heat content describes the amount of energy contained in a physical unit of fuel, while this indicator describes the monetary price paid per unit of energy.
A state with a higher average heat content does not necessarily have a higher price. Heat content is a physical property of the fuel mix; price is an economic measure.
A higher price does not necessarily mean higher total spending
This dataset provides a unit price. Total commercial spending also depends on how much distillate fuel oil is consumed. A state with a high price but low consumption can spend less in total than a state with a lower price and much greater consumption.
Comparing overall cost therefore requires both a price series and a consumption series for the same sector and year.
Complete same-year coverage strengthens the state comparison
All 50 states and D.C. have 2024 values, with no missing observations and no reported zeros. Rankings, quartiles, and the median therefore compare a complete set of state jurisdictions in the same year.
That consistency is useful because it avoids having to mix older observations with current ones, as often happens in cross-country datasets.
One year does not establish a price trend
The 2024 snapshot shows where prices were relatively high or low, but it does not show whether prices were rising or falling. A trend requires the same state series for multiple years.
A year-over-year analysis would compare 2023 and 2024 state values while keeping the commercial sector, distillate fuel oil category, and dollars-per-MMBtu unit constant.
The simple state mean is not necessarily the official U.S. average
The $19.85/MMBtu figure used here is an arithmetic mean of 51 jurisdiction values. States consume different amounts of distillate fuel oil in the commercial sector, so the simple mean should not be assumed to equal an official EIA U.S. aggregate.
A national average generally requires appropriate consumption weighting and the official aggregation method. The simple mean is used here only to describe the state distribution.
Complete 2024 state list
The table below lists all 50 states and the District of Columbia alphabetically. Every observation is from 2024 and the unit is dollars per million Btu.
| State/jurisdiction | Code | Year | Commercial-sector distillate fuel oil price |
|---|---|---|---|
| Alabama | AL | 2024 | $19.00/MMBtu |
| Alaska | AK | 2024 | $22.51/MMBtu |
| Arizona | AZ | 2024 | $20.77/MMBtu |
| Arkansas | AR | 2024 | $19.46/MMBtu |
| California | CA | 2024 | $21.09/MMBtu |
| Colorado | CO | 2024 | $19.43/MMBtu |
| Connecticut | CT | 2024 | $21.39/MMBtu |
| Delaware | DE | 2024 | $18.64/MMBtu |
| District of Columbia | DC | 2024 | $20.11/MMBtu |
| Florida | FL | 2024 | $19.59/MMBtu |
| Georgia | GA | 2024 | $19.22/MMBtu |
| Hawaii | HI | 2024 | $20.45/MMBtu |
| Idaho | ID | 2024 | $21.55/MMBtu |
| Illinois | IL | 2024 | $19.47/MMBtu |
| Indiana | IN | 2024 | $19.33/MMBtu |
| Iowa | IA | 2024 | $19.19/MMBtu |
| Kansas | KS | 2024 | $19.28/MMBtu |
| Kentucky | KY | 2024 | $19.19/MMBtu |
| Louisiana | LA | 2024 | $19.08/MMBtu |
| Maine | ME | 2024 | $21.25/MMBtu |
| Maryland | MD | 2024 | $20.11/MMBtu |
| Massachusetts | MA | 2024 | $21.21/MMBtu |
| Michigan | MI | 2024 | $19.32/MMBtu |
| Minnesota | MN | 2024 | $19.48/MMBtu |
| Mississippi | MS | 2024 | $19.55/MMBtu |
| Missouri | MO | 2024 | $18.87/MMBtu |
| Montana | MT | 2024 | $18.89/MMBtu |
| Nebraska | NE | 2024 | $19.10/MMBtu |
| Nevada | NV | 2024 | $21.01/MMBtu |
| New Hampshire | NH | 2024 | $20.99/MMBtu |
| New Jersey | NJ | 2024 | $20.33/MMBtu |
| New Mexico | NM | 2024 | $19.16/MMBtu |
| New York | NY | 2024 | $19.95/MMBtu |
| North Carolina | NC | 2024 | $19.36/MMBtu |
| North Dakota | ND | 2024 | $19.01/MMBtu |
| Ohio | OH | 2024 | $19.12/MMBtu |
| Oklahoma | OK | 2024 | $18.92/MMBtu |
| Oregon | OR | 2024 | $19.44/MMBtu |
| Pennsylvania | PA | 2024 | $19.90/MMBtu |
| Rhode Island | RI | 2024 | $21.60/MMBtu |
| South Carolina | SC | 2024 | $19.59/MMBtu |
| South Dakota | SD | 2024 | $18.87/MMBtu |
| Tennessee | TN | 2024 | $19.37/MMBtu |
| Texas | TX | 2024 | $19.41/MMBtu |
| Utah | UT | 2024 | $20.04/MMBtu |
| Vermont | VT | 2024 | $21.84/MMBtu |
| Virginia | VA | 2024 | $19.30/MMBtu |
| Washington | WA | 2024 | $20.40/MMBtu |
| West Virginia | WV | 2024 | $19.78/MMBtu |
| Wisconsin | WI | 2024 | $19.03/MMBtu |
| Wyoming | WY | 2024 | $19.64/MMBtu |
How to interpret the comparison
First, the unit is dollars per million Btu rather than dollars per gallon. Second, the indicator applies specifically to the commercial sector. Third, it covers distillate fuel oil rather than gasoline or all petroleum products. Fourth, a unit price does not measure total spending.
Fifth, the state price gaps do not by themselves establish their causes. Sixth, the arithmetic mean of state values is not necessarily the official U.S. weighted average. Seventh, same-year coverage supports cross-state comparison, while time trends require additional years.
Source and calculation
The source is the U.S. Energy Information Administration State Energy Data System (SEDS), indicator BULK_3B0940AE1FD4C35A72281875691E5995. Statistics and rankings use all 51 official 2024 observations for the 50 states and District of Columbia.
Frequently Asked Questions
Is this a price per gallon?
No. It is the commercial-sector distillate fuel oil price expressed on an energy basis in dollars per million Btu.
Which jurisdictions are highest and lowest in 2024?
Alaska is highest at $22.51/MMBtu and Delaware is lowest at $18.64/MMBtu.
Is the simple mean of state prices the official U.S. average?
Not necessarily. Commercial distillate fuel oil consumption differs by state, so a national average requires appropriate weighting and EIA aggregation.
Related Articles
Green Map creates custom-edited map images using open geographic data sources such as geoBoundaries, Natural Earth, OpenStreetMap, and government open data. These maps are edited visual materials, not raw data files, and are provided for education, documents, presentations, and graphic reference.