How similar was the share of female and male upper-secondary students enrolled in vocational programmes in 2024? UNESCO Institute for Statistics indicator GTVP.3.V.GPIA compares the sex-specific shares using an adjusted gender parity index. The 84 official observations all refer to 2024. A value of 1 is the parity reference: below 1, the vocational-programme share among female upper-secondary students is lower than the corresponding male share; above 1, the female share is higher. The indicator does not show the percentage of vocational students who are female. It compares two separate within-sex shares—vocational enrolment as a share of female upper-secondary enrolment and vocational enrolment as a share of male upper-secondary enrolment.
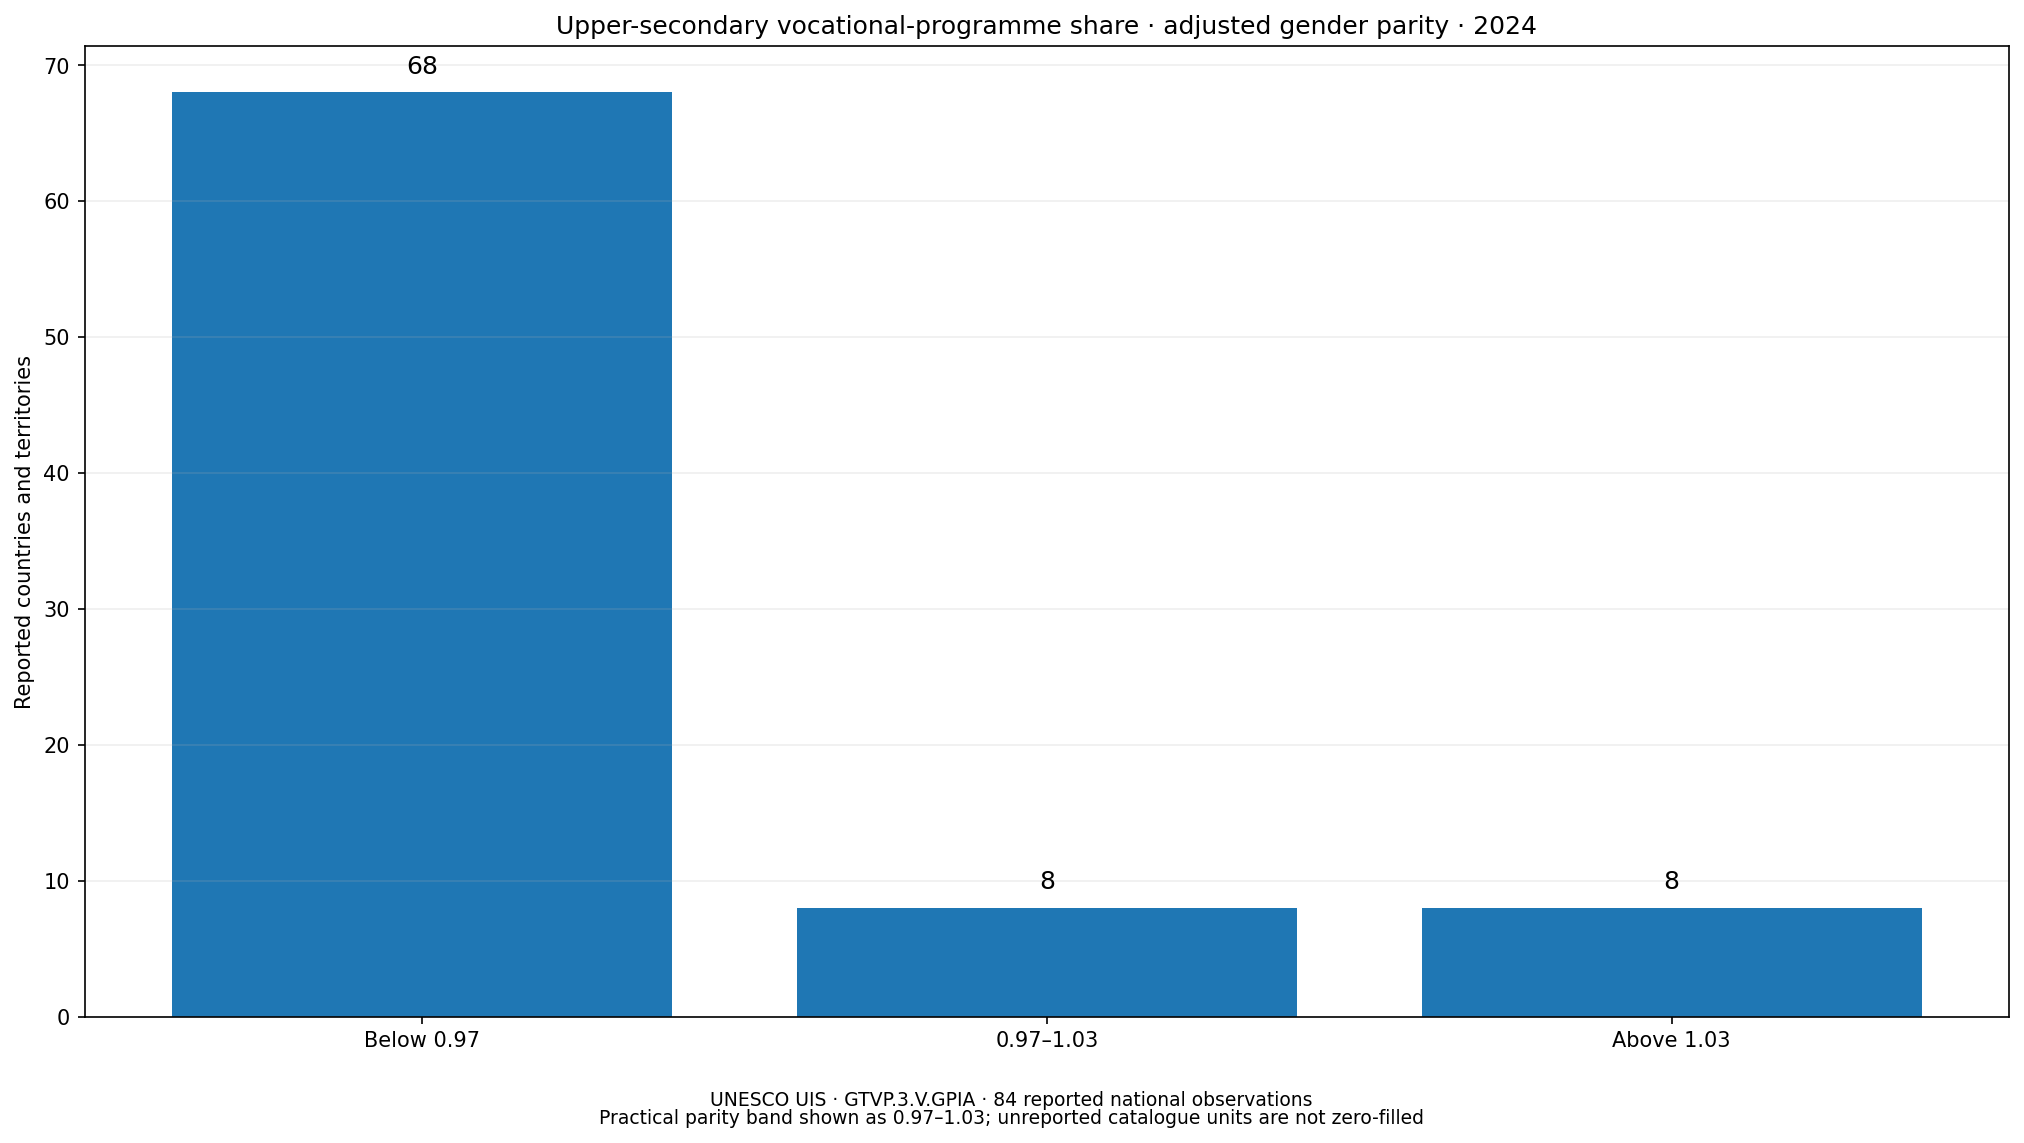
Table of Contents
68 of 84 reported observations are below 0.97
Of the 84 official observations, 68, or 81.0%, fall below 0.97. Only 8 observations (9.5%) sit in the 0.97–1.03 practical parity band, while 8 (9.5%) are above 1.03. By country-row count, the dominant pattern in the reported data is therefore a lower female vocational-programme share within upper-secondary education. This is not a student-weighted global result, however. Each country or territory contributes one index regardless of the size of its upper-secondary student population.
| 2024 GPIA band | Reported observations | Share of 84 |
|---|---|---|
| Below 0.97 | 68 | 81.0% |
| 0.97–1.03 | 8 | 9.5% |
| Above 1.03 | 8 | 9.5% |
The median is 0.75734 and the mean is 0.72403. The first quartile is 0.61257 and the third quartile is 0.89532. The center of the reported distribution is therefore well below 1. The pattern is not driven by one or two outliers: 63 observations are below 0.90, 53 are below 0.80, 35 are below 0.70, and 15 are below 0.50. The lower side of the distribution is broad.
Saudi Arabia’s zero is an official observation, not a missing-value fill
The minimum is Saudi Arabia at 0.00000, and it is the only exact zero. Bahrain follows at 0.08848, Hong Kong SAR, China at 0.15633, Oman at 0.20132, and Albania at 0.21695. The zero for Saudi Arabia is published in the source data; it was not created by replacing missing observations. By contrast, the UIS catalogue contains 157 geographic units that are not reported in this 2024 observation set. Those absent units remain missing and are excluded from the calculations.
| Lowest reported observations | GPIA |
|---|---|
| Saudi Arabia | 0.00000 |
| Bahrain | 0.08848 |
| China, Hong Kong Special Administrative Region | 0.15633 |
| Oman | 0.20132 |
| Albania | 0.21695 |
| Fiji | 0.29591 |
| Qatar | 0.32274 |
| United Arab Emirates | 0.35926 |
| Ghana | 0.37270 |
| Cyprus | 0.37662 |
Keeping official zero and no-data separate is essential. If an unreported country were filled with zero, it would be incorrectly classified as the strongest lower-bound disparity in the dataset. If the official zero were dropped as though it were missing, the source’s actual observation would disappear. The distribution and summary statistics here use only the 84 published national rows.
Only eight observations fall inside the 0.97–1.03 parity band
Exactly 1 observation is published as 1.00000: Bolivia (Plurinational State of). Venezuela (Bolivarian Republic of) is 0.99998 and Côte d’Ivoire is 0.99620. Paraguay records 1.00790, Guatemala 1.00846, Morocco 1.01429, Costa Rica 1.01503, and Honduras 0.97021. Together these make up the eight observations inside the practical parity band. With only about 9.5% of reported rows in this interval, near-equality of the two vocational-programme shares is relatively uncommon in this dataset.
| Observations closest to parity | GPIA |
|---|---|
| Bolivia (Plurinational State of) | 1.00000 |
| Venezuela (Bolivarian Republic of) | 0.99998 |
| Côte d’Ivoire | 0.99620 |
| Paraguay | 1.00790 |
| Guatemala | 1.00846 |
| Morocco | 1.01429 |
| Costa Rica | 1.01503 |
| Honduras | 0.97021 |
A GPIA of 1 does not mean equal numbers of female and male vocational students. Suppose 30% of female upper-secondary students and 30% of male upper-secondary students are in vocational programmes. The shares are equal even if the total numbers of female and male upper-secondary students differ substantially. GTVP.3.V.GPIA therefore describes parity between participation shares, not parity between headcounts.
Values above 1 are not a higher-is-better ranking
There are 8 observations above 1.03. Niger is the maximum at 1.23105, followed by the Dominican Republic at 1.19350, the British Virgin Islands at 1.16545, New Zealand at 1.15466, Brazil at 1.13683, Israel at 1.08706, Nepal at 1.07768, and Chad at 1.03942. These values place the female vocational-programme share above the male share. They should not be called the ‘best’ countries because the parity reference is 1, not the numerical maximum.
| Higher-than-parity observations | GPIA |
|---|---|
| Niger | 1.23105 |
| Dominican Republic | 1.19350 |
| British Virgin Islands | 1.16545 |
| New Zealand | 1.15466 |
| Brazil | 1.13683 |
| Israel | 1.08706 |
| Nepal | 1.07768 |
| Chad | 1.03942 |
| Costa Rica | 1.01503 |
| Morocco | 1.01429 |
The measure is an adjusted GPIA rather than a raw female-to-male ratio. For that reason, a value such as 1.20 should not be translated mechanically as ‘20% higher.’ The adjustment is designed to make departures on the two sides of 1 more comparable. The index supports statements about direction and distance from parity, but the original female and male vocational-programme shares are needed for an exact percentage comparison.
This is a parity measure of vocational shares, not a vocational-enrolment rate for the whole population
The word ‘share’ in the indicator definition matters. For each sex, the numerator is upper-secondary students enrolled in vocational programmes and the denominator is all upper-secondary students of that sex. A low GPIA does not automatically mean that the absolute number of female vocational students is small. If the female upper-secondary population is much larger, the headcount could tell a different story. Likewise, a country with few students can still have a large parity gap in percentage terms.
To compare the scale of vocational education across countries, analysts would need the overall share or count of students in vocational programmes. To ask what percentage of vocational students are female, they would need a different composition measure. GTVP.3.V.GPIA answers a narrower question: are the female and male shares of upper-secondary students choosing vocational programmes similar?
It is distinct from public/private-school share indicators
Several education indicators also use a gender parity framework but measure a different numerator. A private-school share indicator compares the proportion of students enrolled in private institutions by sex. A public-institution share does the same for public institutions. GTVP.3.V.GPIA instead separates vocational from general programmes within upper-secondary education. The same year, countries, and GPIA format do not make those indicators interchangeable because the educational classification being compared is different.
Upper-secondary educational attainment is different again. Attainment asks whether people have completed at least that level of education, usually for an adult age group. The vocational-programme parity indicator looks at currently enrolled upper-secondary students and the type of programme in which they are enrolled. Similar terminology can therefore refer to very different stages of the education process.
The 84 reported rows do not represent a complete world census
UIS reports 84 national observations here, while 157 catalogue units have no observation in this 2024 set. The data should therefore be described as a comparison of reported countries and territories rather than a complete ranking of every country. Missing coverage is especially important when discussing global averages or regional patterns because the absent countries are not randomly guaranteed to resemble the reported set.
The index also does not explain why gender differences occur. Programme availability, occupational pathways, admission rules, labour-market links, family expectations, career guidance, subject preferences, school supply, and national definitions of vocational education could all matter. None of those explanatory variables is contained in GTVP.3.V.GPIA. Establishing causes requires additional evidence rather than inference from the parity index alone.
Four checks keep the interpretation aligned with the indicator
- The measure compares female and male shares of upper-secondary students enrolled in vocational programmes.
- One is the parity reference; 0.97–1.03 is a practical parity band rather than a performance score.
- Official zero is different from no data; 157 unreported catalogue units are not zero-filled.
- Adjusted GPIA shows direction and distance from parity, and values above 1 should not be read as a simple female-to-male percentage ratio.
The direct source is the UNESCO Institute for Statistics GTVP.3.V.GPIA data series. This comparison uses only the official 2024 observations and preserves unreported geographies as missing. Any later-year comparison should keep the same indicator code and upper-secondary programme definition.
Frequently Asked Questions
What does GTVP.3.V.GPIA equal to 1 mean?
It means the share of female upper-secondary students enrolled in vocational programmes equals the corresponding male share. It does not mean the female and male student counts are equal.
How many 2024 observations are in the parity band?
Using 0.97–1.03 as the practical parity band, 8 of 84 official observations fall inside it. 68 are below 0.97 and 8 are above 1.03.
Is Saudi Arabia’s zero a missing value filled with zero?
No. It is an official published observation. Geographic units without a reported 2024 value remain missing and are not zero-filled.
Related Articles
Green Map creates custom-edited map images using open geographic data sources such as geoBoundaries, Natural Earth, OpenStreetMap, and government open data. These maps are edited visual materials, not raw data files, and are provided for education, documents, presentations, and graphic reference.