Residential distillate fuel oil prices varied materially across U.S. states in 2024. Using one consistent annual series from the U.S. Energy Information Administration (EIA) State Energy Data System, the 50 states and the District of Columbia ranged from $19.81 to $26.53 per million Btu. The spread between the highest and lowest observations was $6.72 per million Btu. Because this series is expressed per unit of energy, it is not the same as a simple retail price per gallon; it is designed to make energy-price comparisons on a common heat-content basis.
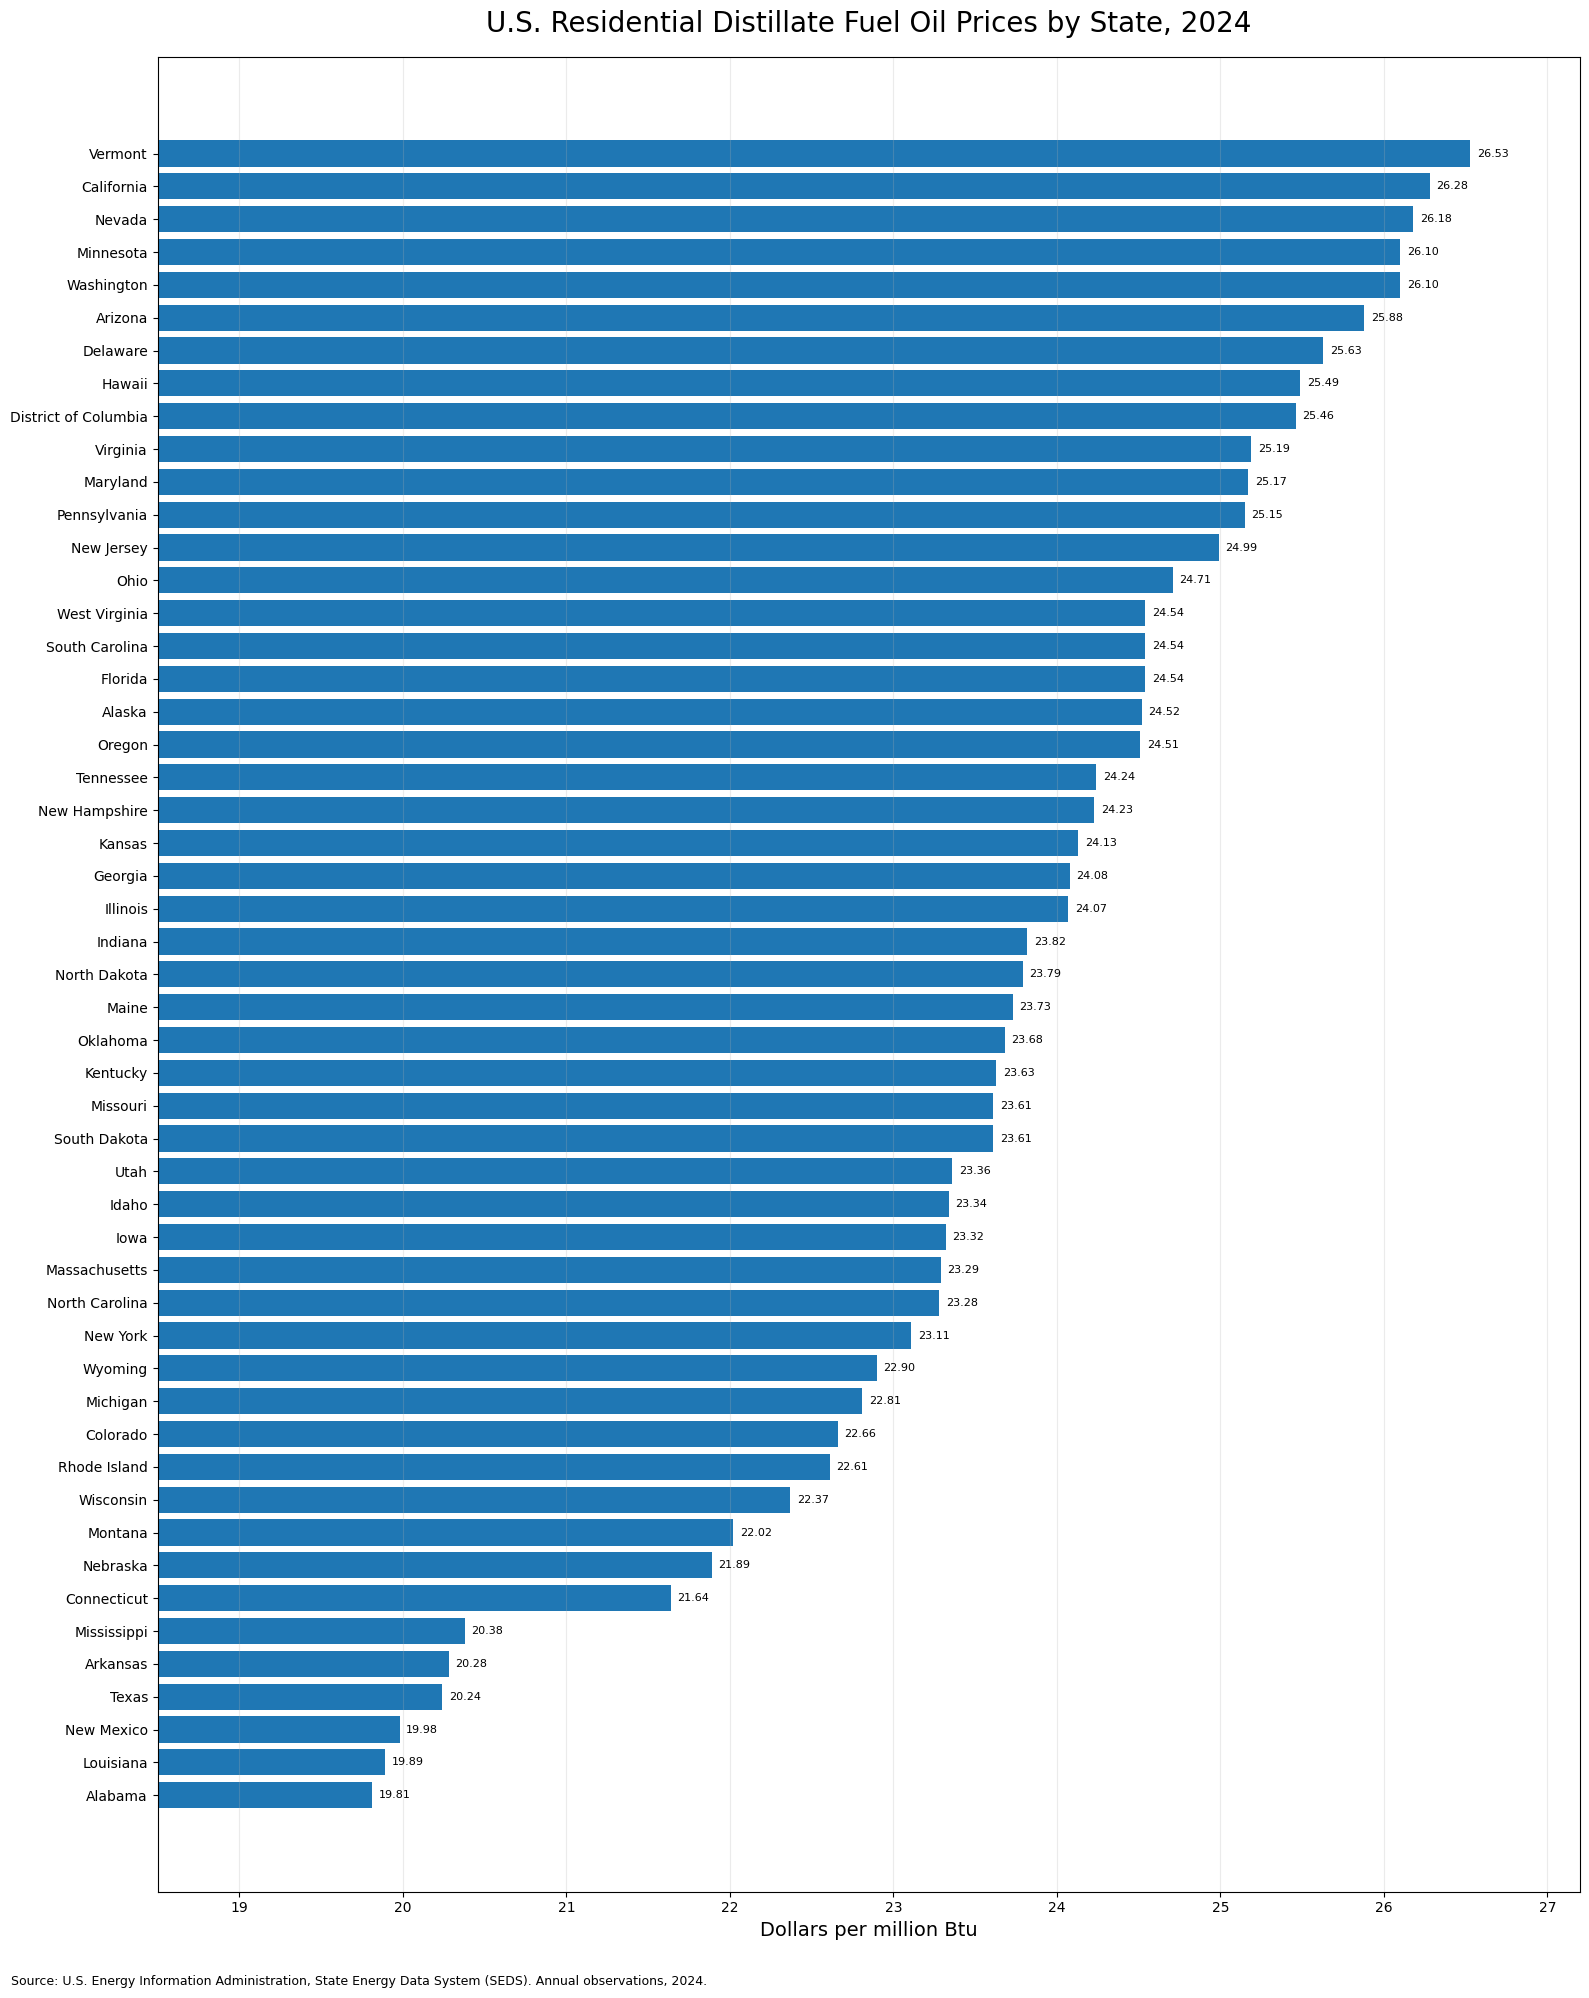
Table of Contents
The 2024 range was wide enough to matter
Vermont recorded the highest value at $26.53 per million Btu, while Alabama had the lowest at $19.81. The simple arithmetic mean of the 51 jurisdictional observations was $23.67, and the median was $23.79. Those two central measures are close, suggesting that the middle of the distribution was not being pulled dramatically in one direction by only a few extreme states. Still, the full range of $6.72 shows that households buying the same broad fuel category could face noticeably different energy-unit prices depending on location.
The mean used here is intentionally descriptive. It gives every state and the District of Columbia equal weight, regardless of how much residential distillate fuel oil is actually sold or consumed there. It therefore should not be treated as a national consumer-weighted price. A true national average for consumers would require sales or consumption weights. The median is often a cleaner reference for a state-by-state comparison because it identifies the midpoint of the 51 observations without implying national weighting.
Which states were at the high end?
Twelve jurisdictions were at or above $25 per million Btu. Vermont led at $26.53, followed by California at $26.28 and Nevada at $26.18. Minnesota and Washington were tied at $26.10, while Arizona reached $25.88. Delaware was $25.63, Hawaii $25.49, the District of Columbia $25.46, Virginia $25.19, Maryland $25.17, and Pennsylvania $25.15.
The high-price group is geographically mixed. It includes parts of New England, the Mid-Atlantic, the West Coast, the Mountain West, the Upper Midwest, the Southwest, and Hawaii. That mixed pattern is a useful warning against assigning the 2024 price distribution to one simple geographic explanation. Transportation distance, wholesale conditions, taxes, product specifications, seasonal demand, supplier competition, and local market structure can all matter in fuel pricing, but this particular dataset reports the resulting price series rather than a causal decomposition.
The lowest values were more concentrated
Six states were below $21 per million Btu: Alabama at $19.81, Louisiana at $19.89, New Mexico at $19.98, Texas at $20.24, Arkansas at $20.28, and Mississippi at $20.38. Connecticut, at $21.64, and Nebraska, at $21.89, were the only two observations in the $21 to under-$22 band. This creates a visible low-price cluster in the South and south-central United States, with New Mexico adding a Southwest example.
The high-to-low ratio was about 1.34, meaning the highest state observation was roughly 34% above the lowest when expressed on this common energy basis. That does not mean a Vermont household necessarily spent 34% more on heating than an Alabama household. Total household expenditure depends on fuel use, home size, weather, insulation, equipment efficiency, and the share of homes that actually use distillate fuel oil. The price series isolates only one part of that broader cost equation.
Most jurisdictions were in the middle
The distribution was not simply split into expensive and inexpensive states. Thirty-one jurisdictions fell from $22 to under $25 per million Btu, and 26 observations were within one dollar of the $23.79 median. Indiana was $23.82, North Dakota $23.79, Maine $23.73, Oklahoma $23.68, Kentucky $23.63, and both Missouri and South Dakota were $23.61. Several other states were separated by only a few cents per million Btu.
That tight middle is important when reading rankings. A difference of several positions may represent only a few cents rather than a meaningful economic gap. State rankings can be convenient for navigation, but the numerical distance between observations is more informative. For example, New Hampshire at $24.23 and Tennessee at $24.24 are essentially adjacent in both rank and value, while the gap between the bottom six and the high-price group is much larger.
Complete state and D.C. ranking
The table below lists all 51 EIA observations from highest to lowest. Values are annual 2024 prices in dollars per million Btu. No missing observation was converted to zero. The District of Columbia is shown because it is included in the same state-level EIA comparison even though it is not a state.
| Rank | State or jurisdiction | Dollars per million Btu |
|---|---|---|
| 1 | Vermont | 26.53 |
| 2 | California | 26.28 |
| 3 | Nevada | 26.18 |
| 4 | Minnesota | 26.10 |
| 5 | Washington | 26.10 |
| 6 | Arizona | 25.88 |
| 7 | Delaware | 25.63 |
| 8 | Hawaii | 25.49 |
| 9 | District of Columbia | 25.46 |
| 10 | Virginia | 25.19 |
| 11 | Maryland | 25.17 |
| 12 | Pennsylvania | 25.15 |
| 13 | New Jersey | 24.99 |
| 14 | Ohio | 24.71 |
| 15 | Florida | 24.54 |
| 16 | West Virginia | 24.54 |
| 17 | South Carolina | 24.54 |
| 18 | Alaska | 24.52 |
| 19 | Oregon | 24.51 |
| 20 | Tennessee | 24.24 |
| 21 | New Hampshire | 24.23 |
| 22 | Kansas | 24.13 |
| 23 | Georgia | 24.08 |
| 24 | Illinois | 24.07 |
| 25 | Indiana | 23.82 |
| 26 | North Dakota | 23.79 |
| 27 | Maine | 23.73 |
| 28 | Oklahoma | 23.68 |
| 29 | Kentucky | 23.63 |
| 30 | South Dakota | 23.61 |
| 31 | Missouri | 23.61 |
| 32 | Utah | 23.36 |
| 33 | Idaho | 23.34 |
| 34 | Iowa | 23.32 |
| 35 | Massachusetts | 23.29 |
| 36 | North Carolina | 23.28 |
| 37 | New York | 23.11 |
| 38 | Wyoming | 22.90 |
| 39 | Michigan | 22.81 |
| 40 | Colorado | 22.66 |
| 41 | Rhode Island | 22.61 |
| 42 | Wisconsin | 22.37 |
| 43 | Montana | 22.02 |
| 44 | Nebraska | 21.89 |
| 45 | Connecticut | 21.64 |
| 46 | Mississippi | 20.38 |
| 47 | Arkansas | 20.28 |
| 48 | Texas | 20.24 |
| 49 | New Mexico | 19.98 |
| 50 | Louisiana | 19.89 |
| 51 | Alabama | 19.81 |
How to interpret dollars per million Btu
A million Btu is an energy-content unit. Reporting price in dollars per million Btu allows energy costs to be compared after accounting for the amount of energy contained in the fuel. A gallon-based price and a dollars-per-million-Btu price answer related but different questions. Converting between them requires an appropriate heat-content assumption for the product. For readers comparing home-heating costs, the EIA measure is useful because it puts the fuel price on an energy basis, but it is not a direct substitute for the price posted by a local dealer per gallon.
The 2024 value is also an annual observation. It does not show how prices moved month by month, how winter prices compared with summer prices, or whether a state experienced short-lived spikes. Annual data are well suited to broad cross-state comparison, but short-term purchasing decisions may require monthly or weekly price series where available.
What this dataset can and cannot show
The dataset supports direct statements about relative state price levels in 2024. It can identify the highest and lowest observations, the size of the spread, the median, and how many states fall into selected price bands. It does not, by itself, explain why a particular state has its observed value. A causal analysis would need additional evidence such as terminal and refinery access, transportation costs, state and local taxes, retail margins, product standards, supply disruptions, and residential consumption patterns.
The series also should not be used as a proxy for household heating burden without additional information. A state can have a high fuel price but relatively few households using heating oil, while another state can have a moderate price and much greater dependence on it. Combining this price series with residential fuel-use shares, weather measures, and household energy expenditures would answer a different and broader question than the one addressed here.
The main 2024 takeaway
The clearest result is the persistence of meaningful state-level variation within one national fuel market. A dozen jurisdictions were at or above $25 per million Btu, six were below $21, and the majority occupied a broad middle between $22 and $25. The expensive group was geographically diverse, while the very lowest observations were more concentrated in southern and south-central states. That pattern makes state-specific values more useful than a single unweighted national summary when the goal is to understand local residential distillate fuel oil pricing.
For comparisons over time, the next step would be to place these 2024 observations beside earlier years using the same EIA series and unit. That would distinguish states that are consistently high or low from states that only moved temporarily in the ranking. The present comparison deliberately stays within a single year so every jurisdiction is evaluated on the same period and metric definition.
Source and calculation notes
The source is the U.S. Energy Information Administration State Energy Data System (SEDS), using direct annual 2024 observations for the residential-sector distillate fuel oil price series. The coverage is 50 states plus the District of Columbia, for 51 observations. The unit is dollars per million Btu. No imputation, interpolation, or cross-series aggregation was used. The ranking, range, median, simple mean, and band counts were calculated directly from those 51 published values.
Frequently Asked Questions
Which jurisdiction had the highest residential distillate fuel oil price in 2024?
Vermont had the highest 2024 EIA observation at $26.53 per million Btu, followed by California at $26.28 and Nevada at $26.18.
Which state had the lowest 2024 price?
Alabama was lowest at $19.81 per million Btu. Louisiana was $19.89 and New Mexico was $19.98.
Is dollars per million Btu the same as a price per gallon?
No. Dollars per million Btu measures price on an energy-content basis. Converting to a gallon price requires an appropriate heat-content value for the fuel.
Related Articles
Green Map creates custom-edited map images using open geographic data sources such as geoBoundaries, Natural Earth, OpenStreetMap, and government open data. These maps are edited visual materials, not raw data files, and are provided for education, documents, presentations, and graphic reference.