Primary gross enrollment is total enrollment in primary education, regardless of age, divided by the population of the age group that officially corresponds to primary school. The World Bank SE.PRM.ENRR file contains 209 latest non-empty observations. Only 13 are from 2025, while 122 are from 2024, making 2024 the largest recent same-year group and the main basis for comparison.
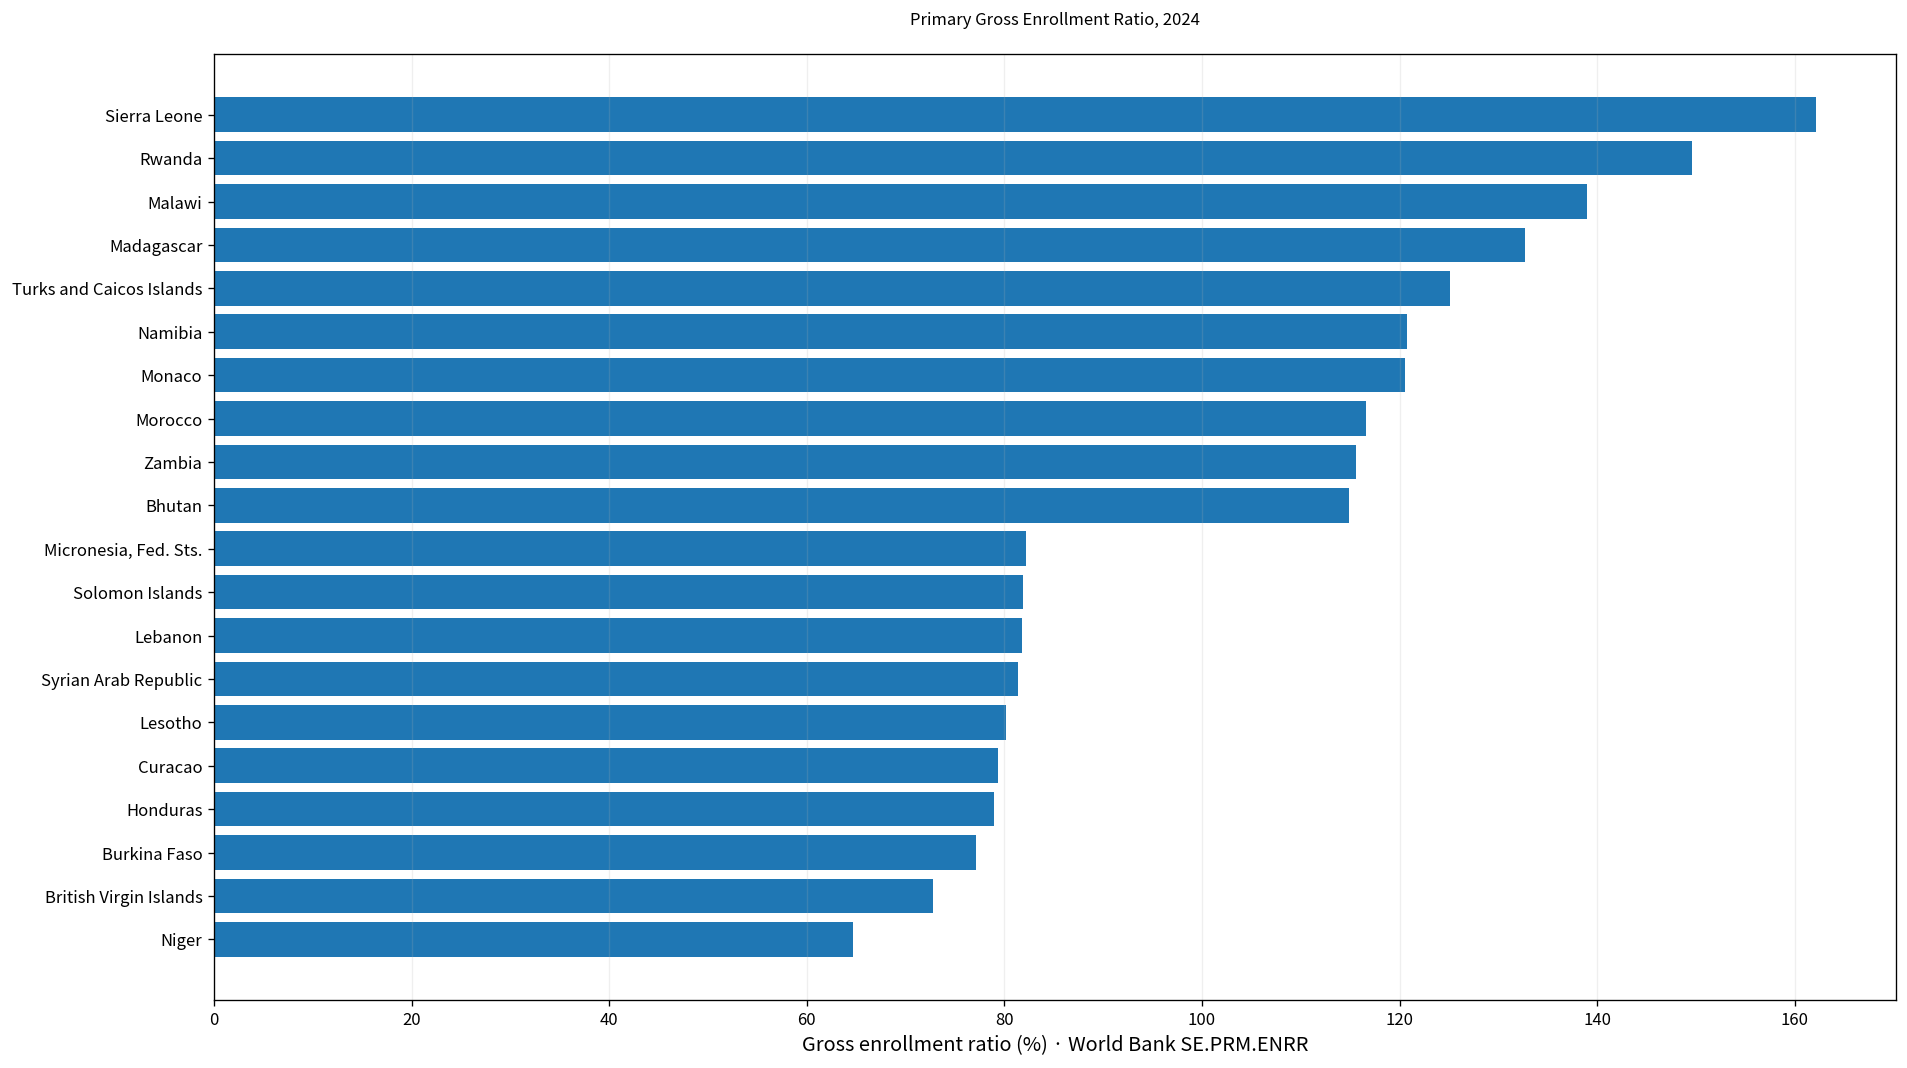
Table of Contents
What primary gross enrollment measures
The World Bank defines gross enrollment as total enrollment in the education level shown, regardless of age, divided by the population of the age group that officially corresponds to that level. Primary education provides foundational reading, writing, mathematics, and introductory learning across other subjects.
The key feature is that the numerator is not restricted to the official age group. Late entrants, grade repeaters, students who start early, and children who remain in primary school beyond the nominal age can all be counted. The denominator remains the official primary-school-age population.
Why values above 100% are valid
In the 2024 subset, 55 of 122 observations are at or above 100%, 20 are at or above 110%, and 7 reach 120% or more. A ratio above 100% can occur when over-age and under-age enrollment raises the number of enrolled pupils above the size of the official-age population.
A 120% gross enrollment ratio therefore does not mean that 120% of primary-school-age children are enrolled. It means total primary enrollment, including pupils outside the official age range, is equivalent to 120% of the reference-age population.
The 2025 group contains only 13 economies
The 2025 observations are Nepal 128.56%, Uzbekistan 120.86%, India 111.03%, Algeria 105.48%, Thailand 100.73%, Burundi 100.63%, Gambia, The 100.43%, Indonesia 100.37%, Kyrgyz Republic 98.95%, Dominica 97.66%, Kazakhstan 97.33%, Naoero 94.40%, and Lao PDR 93.14%.
They are the newest observations in the file, but 13 economies are too few for a broad international distribution. The values remain visible, while the statistical comparison uses the much larger 2024 group.
The 2024 mean is 100.41% and the median is 99.43%
The 2024 subset contains 122 economies. Its mean is 100.41% and its median 99.43%. The first quartile is 94.20% and the third quartile 105.42%, putting the middle half roughly between 94.2% and 105.4%.
55 observations are at least 100%, 20 are at least 110%, and 7 are at least 120%. At the lower end, 19 are below 90% and 5 are below 80%. Similar averages can therefore hide very different enrollment structures.
Sierra Leone is highest in 2024 at 162.12%
Sierra Leone records 162.12%, followed by Rwanda at 149.57%, Malawi at 139.02%, Madagascar at 132.74%, Turks and Caicos Islands at 125.06%, Namibia at 120.72%, and Monaco at 120.58%. Morocco, Zambia, Bhutan, and Sweden are also above 114%.
| 2024 rank | Economy/territory | Primary gross enrollment |
|---|---|---|
| 1 | Sierra Leone | 162.12% |
| 2 | Rwanda | 149.57% |
| 3 | Malawi | 139.02% |
| 4 | Madagascar | 132.74% |
| 5 | Turks and Caicos Islands | 125.06% |
| 6 | Namibia | 120.72% |
| 7 | Monaco | 120.58% |
| 8 | Morocco | 116.59% |
| 9 | Zambia | 115.55% |
| 10 | Bhutan | 114.88% |
| 11 | Sweden | 114.87% |
| 12 | Cameroon | 114.41% |
| 13 | Togo | 114.27% |
| 14 | Venezuela, RB | 113.69% |
| 15 | Peru | 112.79% |
Very high gross enrollment indicates that total primary enrollment is large relative to the official-age population. It should not be interpreted as a ranking of education quality or universal on-time enrollment. Repetition, late entry, and age-grade mismatch can contribute to a high ratio.
Niger is lowest in 2024 at 64.65%
At the lower end, Niger records 64.65%, British Virgin Islands 72.78%, Burkina Faso 77.17%, Honduras 78.97%, and Curacao 79.30%. Lesotho is at 80.18%, Syrian Arab Republic 81.41%, Lebanon 81.77%, Solomon Islands 81.84%, and Micronesia, Fed. Sts. 82.16%.
| Low-order position in 2024 | Economy/territory | Primary gross enrollment |
|---|---|---|
| 1 | Niger | 64.65% |
| 2 | British Virgin Islands | 72.78% |
| 3 | Burkina Faso | 77.17% |
| 4 | Honduras | 78.97% |
| 5 | Curacao | 79.30% |
| 6 | Lesotho | 80.18% |
| 7 | Syrian Arab Republic | 81.41% |
| 8 | Lebanon | 81.77% |
| 9 | Solomon Islands | 81.84% |
| 10 | Micronesia, Fed. Sts. | 82.16% |
| 11 | Pakistan | 83.73% |
| 12 | Barbados | 83.94% |
| 13 | Ethiopia | 84.42% |
| 14 | Senegal | 85.33% |
| 15 | Puerto Rico (US) | 87.93% |
A low gross ratio means total primary enrollment is small relative to the official-age population. The indicator alone does not identify the cause. Non-enrollment, dropout, school availability, conflict, migration, demographic estimates, and the timing of school entry can all influence the result.
The 2023 group also averages close to 100%
The 2023 subset contains 44 economies, with a mean of 100.39% and a median of 101.48%. Its highest values include Djibouti at 135.07%, Antigua and Barbuda at 112.26%, and Afghanistan at 112.23%.
| 2023 high-order position | Economy/territory | Primary gross enrollment |
|---|---|---|
| 1 | Sint Maarten (Dutch part) | 135.07% |
| 2 | St. Kitts and Nevis | 121.12% |
| 3 | Papua New Guinea | 121.09% |
| 4 | Timor-Leste | 119.65% |
| 5 | Congo, Dem. Rep. | 117.60% |
| 6 | Eswatini | 116.53% |
| 7 | Antigua and Barbuda | 112.26% |
| 8 | Afghanistan | 112.23% |
| 9 | Portugal | 110.99% |
| 10 | Nicaragua | 109.54% |
The similarity between the 2023 and 2024 averages does not establish a global time trend, because the groups contain different economies. Trend analysis should match the same countries over consecutive years.
Gross enrollment and net enrollment answer different questions
Gross enrollment describes the total scale of the education system. Net enrollment focuses more directly on children in the official school-age group. When late entry or repetition is common, gross enrollment can be high while net enrollment remains lower.
Using gross enrollment alone can therefore create the mistaken impression that a ratio above 100% is better than complete participation. For age-appropriate access, net enrollment and the out-of-school rate provide essential additional context.
Enrollment is not the same as completion
Enrollment measures who is in school, while completion measures whether children reach and complete the final grade of primary education. A high enrollment ratio does not guarantee a high completion rate.
If repetition and dropout are substantial, a system can have many pupils enrolled while fewer complete primary school on time. Completion rates, survival to the last grade, learning outcomes, and learning-poverty measures address different aspects of performance.
The total indicator is different from male and female series
SE.PRM.ENRR combines boys and girls. Separate male and female indicators are used to examine the gender composition of enrollment. Two countries with similar total gross enrollment can still have very different patterns between girls and boys.
This distinction matters because the filename can be misleading: the actual indicator in the data is the total primary gross enrollment ratio, not the male-only series. Gender analysis should use the sex-specific indicators, while SE.PRM.ENRR describes the combined system.
A gross ratio near 100% does not prove every child is enrolled
A gross enrollment ratio around 100% only means that total enrollment is similar in size to the official-age population. Some official-age children can still be out of school if over-age or under-age pupils make up the numerical difference.
For the number or share of primary-age children who are not enrolled in primary or secondary school, an out-of-school indicator is more direct. Gross enrollment and out-of-school rates answer complementary questions.
The 209 latest observations do not share one year
The latest non-empty observations span 1989–2025. The largest group is 2024 with 122 economies, followed by 2023 with 44 and 2025 with 13. Several economies retain much older latest values from the 1980s or 1990s.
| Observation year | Economies/territories | Share of 209 |
|---|---|---|
| 2025 | 13 | 6.2% |
| 2024 | 122 | 58.4% |
| 2023 | 44 | 21.1% |
| 2022 | 9 | 4.3% |
| 2021 | 2 | 1.0% |
| 2020 | 1 | 0.5% |
| 2019 | 2 | 1.0% |
| 2018 | 2 | 1.0% |
| 2017 | 2 | 1.0% |
| 2016 | 3 | 1.4% |
| 2015 | 1 | 0.5% |
| 2010 | 1 | 0.5% |
| 2007 | 1 | 0.5% |
| 2006 | 1 | 0.5% |
| 1996 | 1 | 0.5% |
| 1994 | 1 | 0.5% |
| 1993 | 1 | 0.5% |
| 1992 | 1 | 0.5% |
| 1989 | 1 | 0.5% |
The complete latest-value file should therefore not be described as a current 209-economy ranking. The observation year must remain visible, and the 2024 group provides the strongest recent same-year basis for direct comparison.
Complete list of the 209 latest observations
The table below lists each economy and territory’s latest non-empty observation in alphabetical order. Values from years other than 2024 should be read with their observation year rather than treated as measurements from the same moment.
| Economy/territory | Observation year | Primary gross enrollment |
|---|---|---|
| Afghanistan | 2023 | 112.23% |
| Albania | 2024 | 111.51% |
| Algeria | 2025 | 105.48% |
| American Samoa | 1992 | 89.91% |
| Andorra | 2024 | 99.86% |
| Angola | 2023 | 86.74% |
| Antigua and Barbuda | 2023 | 112.26% |
| Argentina | 2023 | 102.54% |
| Armenia | 2024 | 101.99% |
| Aruba | 2024 | 107.72% |
| Australia | 2024 | 99.61% |
| Austria | 2024 | 101.31% |
| Azerbaijan | 2024 | 105.63% |
| Bahamas, The | 2024 | 92.86% |
| Bahrain | 2024 | 96.88% |
| Bangladesh | 2024 | 106.49% |
| Barbados | 2024 | 83.94% |
| Belarus | 2024 | 96.82% |
| Belgium | 2023 | 102.11% |
| Belize | 2024 | 96.48% |
| Benin | 2022 | 108.04% |
| Bermuda | 2023 | 92.85% |
| Bhutan | 2024 | 114.88% |
| Bolivia | 2024 | 93.68% |
| Bosnia and Herzegovina | 2023 | 101.19% |
| Botswana | 2022 | 109.27% |
| Brazil | 2024 | 104.30% |
| British Virgin Islands | 2024 | 72.78% |
| Brunei Darussalam | 2024 | 94.82% |
| Bulgaria | 2024 | 95.28% |
| Burkina Faso | 2024 | 77.17% |
| Burundi | 2025 | 100.63% |
| Cabo Verde | 2022 | 102.97% |
| Cambodia | 2024 | 108.97% |
| Cameroon | 2024 | 114.41% |
| Canada | 2023 | 95.01% |
| Cayman Islands | 2024 | 95.74% |
| Central African Republic | 2016 | 96.81% |
| Chad | 2024 | 88.46% |
| Chile | 2024 | 99.49% |
| China | 2024 | 99.64% |
| Colombia | 2022 | 104.83% |
| Comoros | 2024 | 97.00% |
| Congo, Dem. Rep. | 2023 | 117.60% |
| Congo, Rep. | 2023 | 87.88% |
| Costa Rica | 2024 | 104.77% |
| Cote d’Ivoire | 2024 | 93.30% |
| Croatia | 2023 | 101.16% |
| Cuba | 2024 | 98.11% |
| Curacao | 2024 | 79.30% |
| Cyprus | 2024 | 105.26% |
| Czechia | 2023 | 99.70% |
| Denmark | 2024 | 99.78% |
| Dominica | 2025 | 97.66% |
| Dominican Republic | 2024 | 101.94% |
| Ecuador | 2023 | 97.25% |
| Egypt, Arab Rep. | 2024 | 96.71% |
| El Salvador | 2024 | 89.88% |
| Equatorial Guinea | 2015 | 47.55% |
| Eritrea | 2022 | 89.73% |
| Estonia | 2024 | 97.82% |
| Eswatini | 2023 | 116.53% |
| Ethiopia | 2024 | 84.42% |
| Fiji | 2024 | 110.38% |
| Finland | 2024 | 98.87% |
| France | 2024 | 103.44% |
| French Polynesia | 1996 | 108.14% |
| Gabon | 2019 | 100.17% |
| Gambia, The | 2025 | 100.43% |
| Georgia | 2024 | 99.36% |
| Germany | 2024 | 102.64% |
| Ghana | 2024 | 100.97% |
| Gibraltar | 2024 | 101.77% |
| Greece | 2023 | 102.02% |
| Grenada | 2024 | 110.59% |
| Guam | 1989 | 77.92% |
| Guatemala | 2024 | 101.49% |
| Guinea | 2020 | 100.47% |
| Guinea-Bissau | 2010 | 113.44% |
| Guyana | 2024 | 97.55% |
| Haiti | 2016 | 183.99% |
| Honduras | 2024 | 78.97% |
| Hong Kong SAR, China | 2024 | 103.15% |
| Hungary | 2024 | 102.89% |
| Iceland | 2023 | 98.22% |
| India | 2025 | 111.03% |
| Indonesia | 2025 | 100.37% |
| Iran, Islamic Rep. | 2023 | 101.96% |
| Iraq | 2007 | 104.57% |
| Ireland | 2022 | 96.48% |
| Israel | 2024 | 97.44% |
| Italy | 2023 | 103.57% |
| Jamaica | 2024 | 97.30% |
| Japan | 2023 | 101.13% |
| Jordan | 2024 | 98.55% |
| Kazakhstan | 2025 | 97.33% |
| Kenya | 2023 | 98.25% |
| Kiribati | 2024 | 95.27% |
| Korea, Dem. People’s Rep. | 2018 | 92.06% |
| Korea, Rep. | 2024 | 100.87% |
| Kuwait | 2021 | 82.36% |
| Kyrgyz Republic | 2025 | 98.95% |
| Lao PDR | 2025 | 93.14% |
| Latvia | 2024 | 97.57% |
| Lebanon | 2024 | 81.77% |
| Lesotho | 2024 | 80.18% |
| Liberia | 2022 | 66.59% |
| Libya | 2006 | 107.00% |
| Liechtenstein | 2021 | 102.11% |
| Lithuania | 2024 | 100.53% |
| Luxembourg | 2024 | 99.22% |
| Macao SAR, China | 2024 | 89.81% |
| Madagascar | 2024 | 132.74% |
| Malawi | 2024 | 139.02% |
| Malaysia | 2024 | 90.36% |
| Maldives | 2024 | 99.71% |
| Mali | 2023 | 72.80% |
| Malta | 2023 | 97.71% |
| Marshall Islands | 2024 | 101.80% |
| Mauritania | 2024 | 105.43% |
| Mauritius | 2024 | 107.35% |
| Mexico | 2024 | 102.28% |
| Micronesia, Fed. Sts. | 2024 | 82.16% |
| Moldova | 2024 | 107.61% |
| Monaco | 2024 | 120.58% |
| Mongolia | 2024 | 92.34% |
| Montenegro | 2023 | 106.11% |
| Morocco | 2024 | 116.59% |
| Mozambique | 2022 | 119.16% |
| Myanmar | 2018 | 120.21% |
| Namibia | 2024 | 120.72% |
| Naoero | 2025 | 94.40% |
| Nepal | 2025 | 128.56% |
| Netherlands | 2023 | 104.16% |
| New Caledonia | 1994 | 116.01% |
| New Zealand | 2024 | 96.69% |
| Nicaragua | 2023 | 109.54% |
| Niger | 2024 | 64.65% |
| Nigeria | 2023 | 89.59% |
| North Macedonia | 2023 | 96.31% |
| Norway | 2024 | 98.54% |
| Oman | 2024 | 94.72% |
| Pakistan | 2024 | 83.73% |
| Palau | 2024 | 106.94% |
| Panama | 2024 | 96.94% |
| Papua New Guinea | 2023 | 121.09% |
| Paraguay | 2024 | 89.44% |
| Peru | 2024 | 112.79% |
| Philippines | 2024 | 94.03% |
| Poland | 2024 | 105.36% |
| Portugal | 2023 | 110.99% |
| Puerto Rico (US) | 2024 | 87.93% |
| Qatar | 2024 | 97.56% |
| Romania | 2023 | 84.95% |
| Russian Federation | 2023 | 97.75% |
| Rwanda | 2024 | 149.57% |
| Samoa | 2024 | 101.04% |
| San Marino | 2024 | 93.53% |
| Sao Tome and Principe | 2017 | 110.38% |
| Saudi Arabia | 2024 | 103.98% |
| Senegal | 2024 | 85.33% |
| Serbia | 2024 | 95.99% |
| Seychelles | 2024 | 93.38% |
| Sierra Leone | 2024 | 162.12% |
| Singapore | 2023 | 100.25% |
| Sint Maarten (Dutch part) | 2023 | 135.07% |
| Slovak Republic | 2024 | 102.75% |
| Slovenia | 2023 | 100.88% |
| Solomon Islands | 2024 | 81.84% |
| Somalia, Fed. Rep. | 2023 | 20.92% |
| South Africa | 2023 | 101.77% |
| South Sudan | 2024 | 98.44% |
| Spain | 2024 | 102.94% |
| Sri Lanka | 2023 | 91.45% |
| St. Kitts and Nevis | 2023 | 121.12% |
| St. Lucia | 2024 | 96.78% |
| St. Vincent and the Grenadines | 2024 | 111.44% |
| Sudan | 2019 | 72.40% |
| Suriname | 2024 | 91.92% |
| Sweden | 2024 | 114.87% |
| Switzerland | 2024 | 101.21% |
| Syrian Arab Republic | 2024 | 81.41% |
| Tajikistan | 2024 | 95.76% |
| Tanzania | 2024 | 92.69% |
| Thailand | 2025 | 100.73% |
| Timor-Leste | 2023 | 119.65% |
| Togo | 2024 | 114.27% |
| Tonga | 2024 | 108.79% |
| Trinidad and Tobago | 2024 | 98.26% |
| Tunisia | 2023 | 104.42% |
| Turkiye | 2023 | 102.44% |
| Turkmenistan | 2024 | 95.69% |
| Turks and Caicos Islands | 2024 | 125.06% |
| Tuvalu | 2024 | 101.14% |
| Uganda | 2017 | 106.17% |
| Ukraine | 2024 | 93.31% |
| United Arab Emirates | 2024 | 108.04% |
| United Kingdom | 2023 | 102.17% |
| United States | 2022 | 96.97% |
| Uruguay | 2023 | 104.53% |
| Uzbekistan | 2025 | 120.86% |
| Vanuatu | 2024 | 112.49% |
| Venezuela, RB | 2024 | 113.69% |
| Viet Nam | 2024 | 106.33% |
| Virgin Islands (U.S.) | 1993 | 124.08% |
| West Bank and Gaza | 2023 | 91.44% |
| Yemen, Rep. | 2016 | 76.98% |
| Zambia | 2024 | 115.55% |
| Zimbabwe | 2024 | 93.08% |
How to interpret the comparison
First, gross enrollment includes pupils of all ages and can exceed 100%. Second, a high gross ratio is not automatically a better education outcome. Third, gross enrollment is different from net enrollment, completion, and learning outcomes. Fourth, the 209 latest observations are mixed-year data.
Fifth, the total indicator must not be confused with male- or female-only series. SE.PRM.ENRR is the combined primary gross enrollment ratio. Gender gaps, out-of-school children, completion, and learning require their own indicators.
Source and calculation
The source is World Bank World Development Indicators SE.PRM.ENRR, School enrollment, primary (% gross). The 2024 mean, median, quartiles, threshold counts, and rankings are calculated from the 122 observations dated 2024. The complete table uses the latest non-empty observation for all 209 economies.
Frequently Asked Questions
Can primary gross enrollment exceed 100%?
Yes. Pupils outside the official primary-school age are included in enrollment, so total enrollment can exceed the size of the official-age population.
What is the 2024 median?
The median across the 122 observations dated 2024 is 99.43%, while the mean is 100.41%.
Is this the male primary gross enrollment indicator?
No. SE.PRM.ENRR is the total primary gross enrollment ratio for both sexes combined. Male and female ratios use separate indicators.
Related Articles
Green Map creates custom-edited map images using open geographic data sources such as geoBoundaries, Natural Earth, OpenStreetMap, and government open data. These maps are edited visual materials, not raw data files, and are provided for education, documents, presentations, and graphic reference.