World Bank indicator NY.GDP.MKTP.KD.ZG provides a 2025 real GDP growth observation for 186 countries and economies in a 217-economy frame; 31 rows are source-missing. Across the 186 numeric observations, the unweighted mean is 3.56%, the median 3.40%, the first quartile 1.79%, and the third quartile 4.96%.
Positive growth is reported for 176 economies and negative growth for 10; none of the numeric observations is exactly zero. Guyana has the highest value at 19.34%, while Equatorial Guinea has the lowest at -5.85%. The wide spread makes the distribution and regional contrasts more informative than a single global-style average.
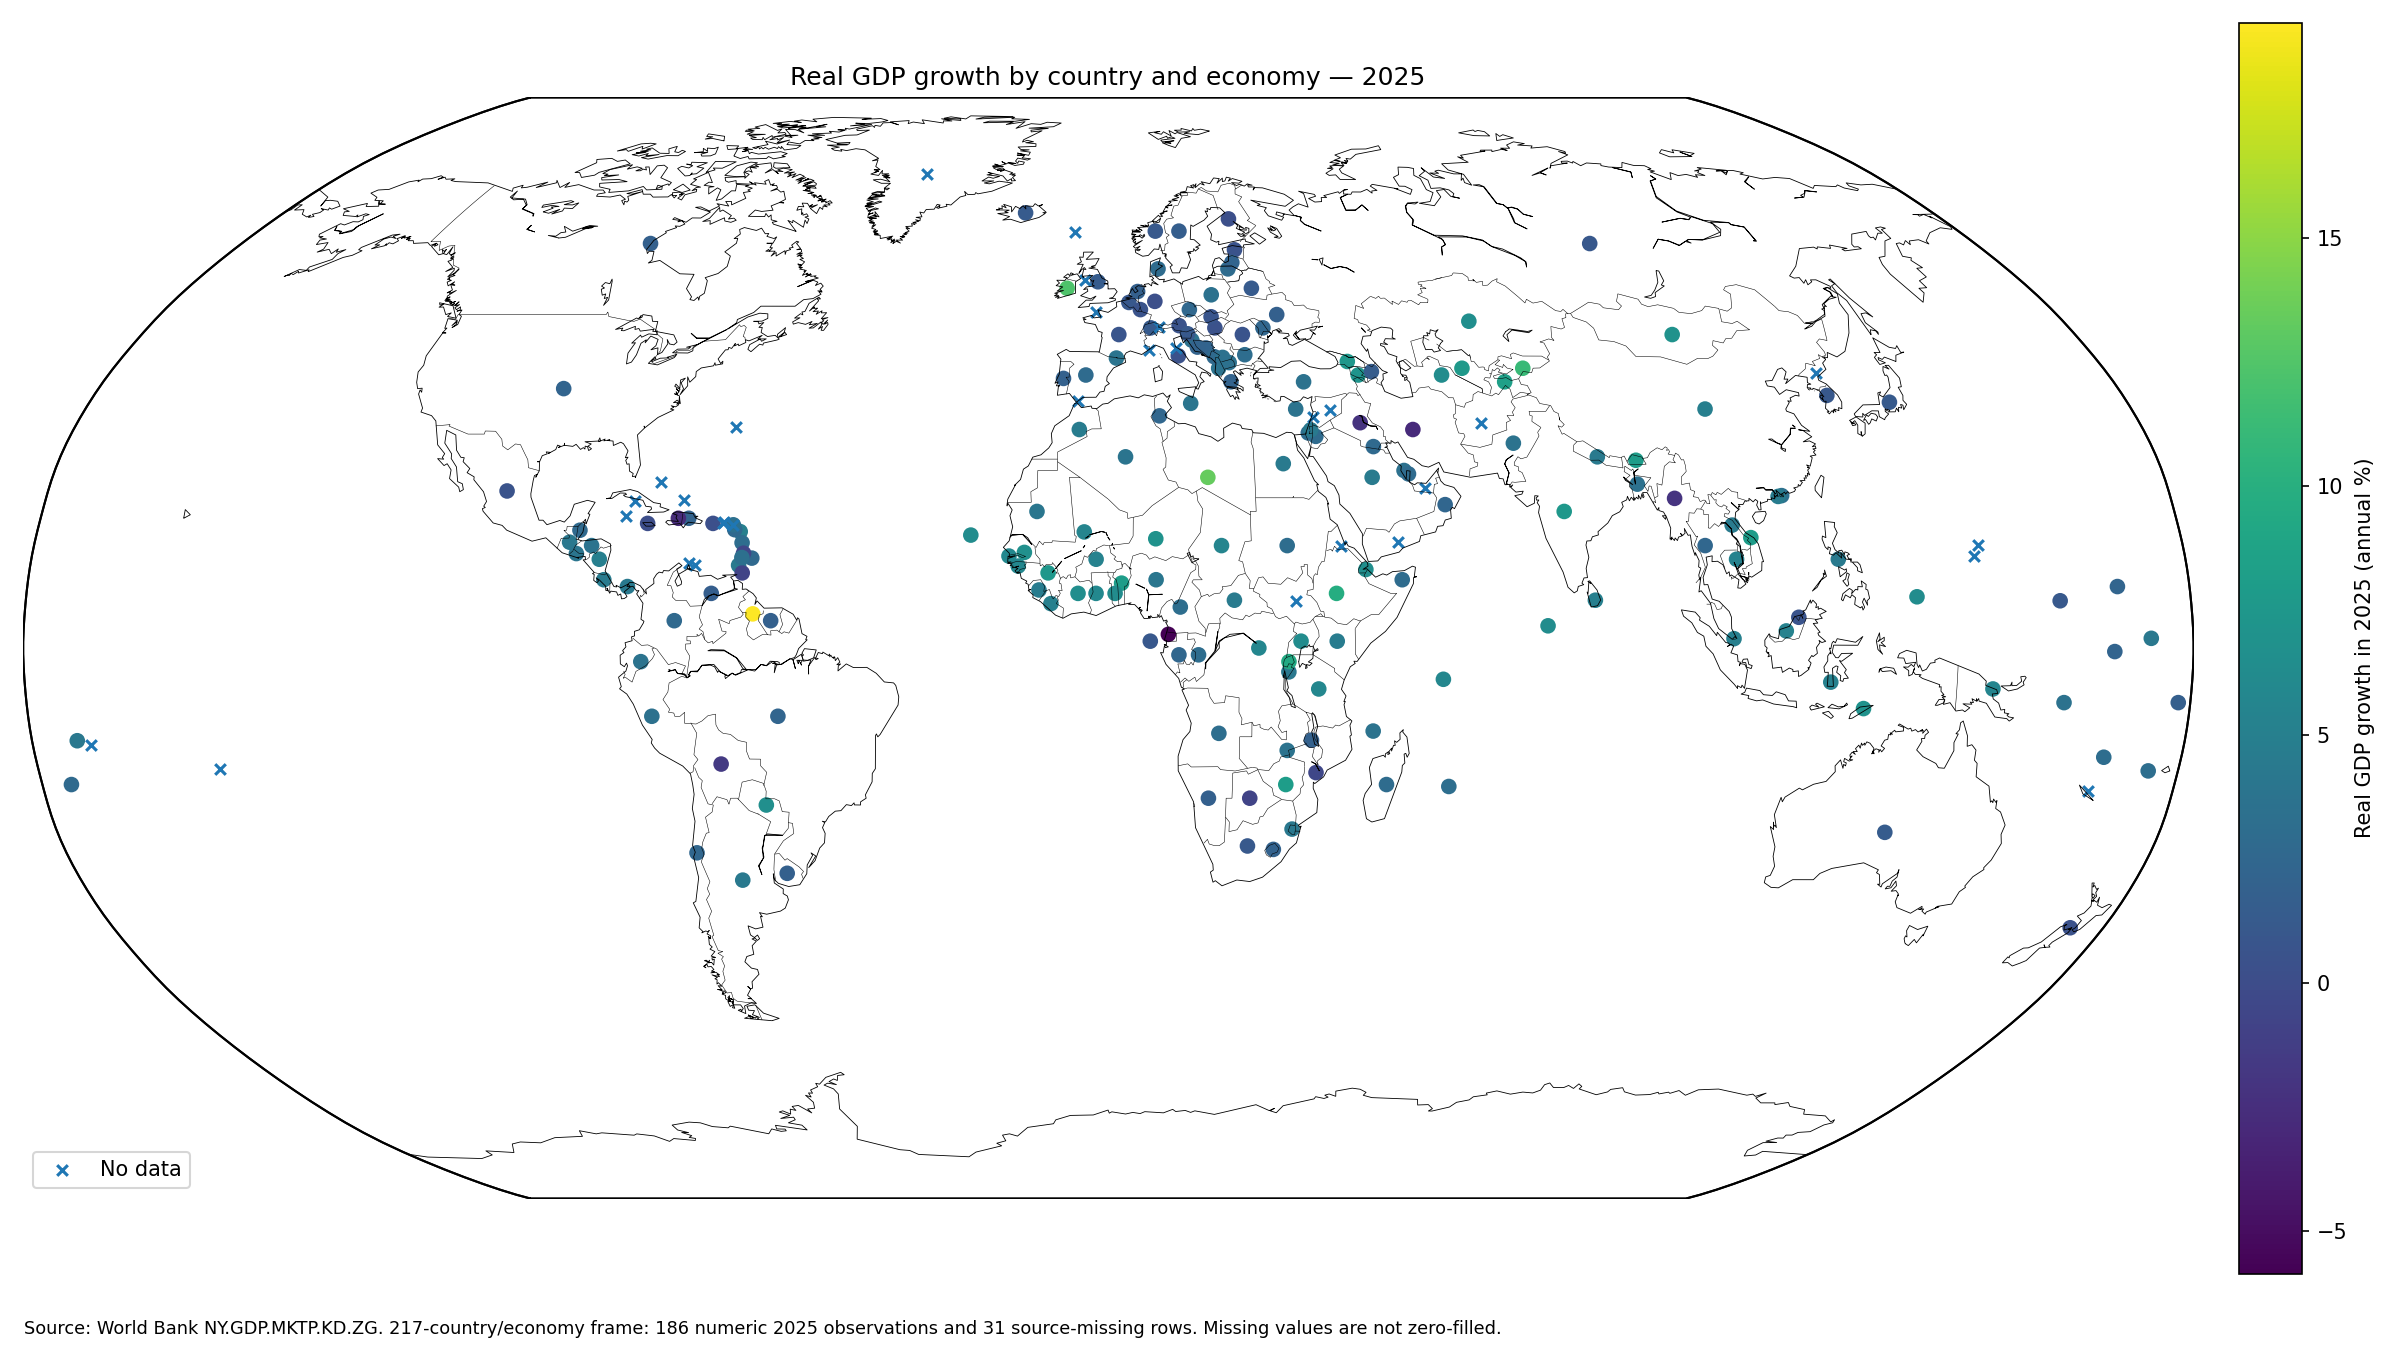
Table of Contents
The indicator measures real rather than nominal GDP growth
The World Bank metadata glossary defines NY.GDP.MKTP.KD.ZG as the annual percentage growth rate of GDP at market prices based on constant-price national accounts. The purpose of constant prices is to remove the effect of price changes and focus on the change in real production.
A country can therefore record strong nominal GDP growth during high inflation without posting the same real growth rate. Every numeric value used here refers to the change from the 2024 real GDP level to the 2025 real GDP level.
The median 2025 growth rate is 3.40%
The median across 186 reported economies is 3.40%. The middle half lies between 1.79% and 4.96%. The mean of 3.56% is close to the median, although a few double-digit observations lift the upper tail.
10 economies contract, 16 grow by less than 1%, 26 by 1% to under 2%, 30 by 2% to under 3%, 33 by 3% to under 4%, 26 by 4% to under 5%, 28 by 5% to under 7%, 13 by 7% to under 10%, and 4 grow by at least 10%.
| 2025 real GDP growth | Economies | Share of 186 |
|---|---|---|
| Below 0% | 10 | 5.4% |
| 0% to under 1% | 16 | 8.6% |
| 1% to under 2% | 26 | 14.0% |
| 2% to under 3% | 30 | 16.1% |
| 3% to under 4% | 33 | 17.7% |
| 4% to under 5% | 26 | 14.0% |
| 5% to under 7% | 28 | 15.1% |
| 7% to under 10% | 13 | 7.0% |
| 10% or more | 4 | 2.2% |
Guyana has the highest reported 2025 growth rate
Guyana leads at 19.34%, followed by Libya at 13.37%, Ireland 12.34%, the Kyrgyz Republic 11.10%, Ethiopia 9.77%, and Rwanda 9.38%. Tajikistan, Zimbabwe, Benin, Viet Nam, Bhutan and Uzbekistan are also near or above 8%.
The growth-rate series alone does not identify why a country is near the top. New resource production, recovery from a weak previous year, rapid expansion in a particular industry, investment, exports, or national-accounting effects can all matter. Causal interpretation requires expenditure- or industry-level national accounts.
| Rank | Country or economy | 2025 real GDP growth |
|---|---|---|
| 1 | Guyana | 19.34% |
| 2 | Libya | 13.37% |
| 3 | Ireland | 12.34% |
| 4 | Kyrgyz Republic | 11.10% |
| 5 | Ethiopia | 9.77% |
| 6 | Rwanda | 9.38% |
| 7 | Tajikistan | 8.40% |
| 8 | Zimbabwe | 8.11% |
| 9 | Benin | 8.07% |
| 10 | Viet Nam | 8.02% |
| 11 | Bhutan | 8.01% |
| 12 | Uzbekistan | 7.70% |
| 13 | India | 7.57% |
| 14 | Georgia | 7.46% |
| 15 | Guinea | 7.45% |
Ten economies report a contraction
Equatorial Guinea records the deepest contraction at -5.85%. Iran, Islamic Rep. is at -2.83%, Haiti -2.71%, Iraq -2.16%, Myanmar -2.01%, and Bolivia -1.58%.
Trinidad and Tobago, Botswana, St. Lucia and Mozambique are also below zero. By contrast, Jamaica, Finland, Germany and several other economies are positive but below 1%, so very slow growth should not be confused with contraction.
| Low-end rank | Country or economy | 2025 real GDP growth |
|---|---|---|
| 1 | Equatorial Guinea | -5.85% |
| 2 | Iran, Islamic Rep. | -2.83% |
| 3 | Haiti | -2.71% |
| 4 | Iraq | -2.16% |
| 5 | Myanmar | -2.01% |
| 6 | Bolivia | -1.58% |
| 7 | Trinidad and Tobago | -0.79% |
| 8 | Botswana | -0.73% |
| 9 | St. Lucia | -0.57% |
| 10 | Mozambique | -0.52% |
| 11 | Jamaica | 0.08% |
| 12 | Finland | 0.17% |
| 13 | Germany | 0.24% |
| 14 | Puerto Rico (US) | 0.32% |
| 15 | New Zealand | 0.46% |
Central Asia and the Caucasus form a high-growth cluster with one clear exception
The Kyrgyz Republic records 11.10%, Tajikistan 8.40%, Uzbekistan 7.70%, Georgia 7.46%, Armenia 7.20%, and Kazakhstan 6.50%. Azerbaijan is much lower at 1.45%.
The pattern shows that a regional cluster can coexist with substantial differences among neighboring economies. The map documents the result but cannot identify whether trade, investment, commodity production, domestic demand or base effects explain the common high-growth area.
| Central Asia and Caucasus example | 2025 growth |
|---|---|
| Kyrgyz Republic | 11.10% |
| Tajikistan | 8.40% |
| Uzbekistan | 7.70% |
| Georgia | 7.46% |
| Armenia | 7.20% |
| Kazakhstan | 6.50% |
| Azerbaijan | 1.45% |
East Africa combines rapid growth with a nearby contraction
Ethiopia records 9.77%, Rwanda 9.38%, Uganda 6.33%, Tanzania 5.85%, and Kenya 4.63%, while Mozambique is at -0.52%.
Geographic proximity therefore does not imply a common growth outcome. Differences in agriculture, services, investment, exports, shocks and the previous-year base can produce very different annual growth rates within the same broad region.
| East Africa example | 2025 growth |
|---|---|
| Ethiopia | 9.77% |
| Rwanda | 9.38% |
| Uganda | 6.33% |
| Tanzania | 5.85% |
| Kenya | 4.63% |
| Mozambique | -0.52% |
Most of Southeast Asia grows, but the pace varies widely
Viet Nam records 8.02%, Timor-Leste 6.98%, Cambodia 5.35%, Malaysia 5.17%, Indonesia 5.11%, and Singapore 5.03%. The Philippines is at 4.40%, Thailand 2.44%, while Myanmar contracts by 2.01%.
The regional comparison is a reminder that GDP growth is a rate of change, not a development-level ranking. A faster-growing economy can still have a much smaller GDP or lower income per person than a slower-growing neighbor.
| Southeast Asia example | 2025 growth |
|---|---|
| Viet Nam | 8.02% |
| Timor-Leste | 6.98% |
| Cambodia | 5.35% |
| Malaysia | 5.17% |
| Indonesia | 5.11% |
| Singapore | 5.03% |
| Lao PDR | 4.54% |
| Philippines | 4.40% |
| Thailand | 2.44% |
| Myanmar | -2.01% |
Ireland is a large outlier within Western Europe
Ireland reports 12.34%, compared with Spain at 2.82%, Portugal 1.86%, the Netherlands 1.78%, Belgium 0.98%, France 0.84%, Austria 0.62%, Italy 0.54%, Germany 0.24%, and Finland 0.17%.
GDP can be especially volatile in small, open economies where a limited number of large industries or multinational activities have an outsized effect on national accounts. A double-digit GDP rate should therefore not be interpreted as an identical increase in household living standards.
| Western Europe example | 2025 growth |
|---|---|
| Ireland | 12.34% |
| Spain | 2.82% |
| Portugal | 1.86% |
| Netherlands | 1.78% |
| Belgium | 0.98% |
| France | 0.84% |
| Austria | 0.62% |
| Italy | 0.54% |
| Germany | 0.24% |
| Finland | 0.17% |
Guyana is an extreme South American outlier
Guyana’s 19.34% is far above the rest of the South American subset. Paraguay records 6.64%, Argentina 4.37%, Ecuador 3.73%, Peru 3.43%, Colombia 2.64%, Chile 2.46%, Brazil 2.29%, Uruguay 1.78%, and Bolivia -1.58%.
A regional arithmetic mean would be strongly pulled upward by Guyana. Medians and the full country distribution are therefore safer summaries when one economy is far from its neighbors.
| South America example | 2025 growth |
|---|---|
| Guyana | 19.34% |
| Paraguay | 6.64% |
| Argentina | 4.37% |
| Ecuador | 3.73% |
| Peru | 3.43% |
| Colombia | 2.64% |
| Chile | 2.46% |
| Brazil | 2.29% |
| Uruguay | 1.78% |
| Bolivia | -1.58% |
GDP growth and GDP per-capita growth answer different questions
Real GDP growth measures the change in total economic output. If population grows rapidly, GDP per capita can rise much more slowly than total GDP. If population falls, per-capita GDP growth can be higher than aggregate GDP growth.
Questions about average economic output per resident should use real GDP per-capita growth rather than treating aggregate GDP growth as a direct living-standard measure.
A high growth rate does not mean the economy is large
Growth is a percentage change. Ten percent growth in a small economy can add less output in absolute terms than two percent growth in a very large economy.
GDP levels are needed for economic size, GDP per capita for output relative to population, and purchasing-power measures for comparisons that adjust for price levels. This dataset answers only how fast real GDP changed in 2025.
Base effects can produce unusually high or low one-year rates
If output fell sharply in the previous year and then recovered, the following year’s percentage increase can be very large. The reverse can occur after an exceptional boom.
A single-year growth rate therefore should not be treated as a measure of long-run growth potential. Multi-year time series are needed to distinguish a sustained expansion from a rebound or temporary shock.
Thirty-one No data rows are not zero growth
The 217-economy frame contains 31 rows with no numeric 2025 observation. Those economies are not assumed to have 0% growth; the source simply does not provide a usable number in this extract.
Among the 186 numeric observations, exactly 0 are equal to zero. The map marks source-missing locations separately so they do not distort the distribution or average.
Recent GDP estimates can be revised
National accounts are routinely revised as more complete administrative, business and survey information becomes available. Recent-year GDP growth rates can therefore change after first publication.
The 2025 figures should be read as the World Bank observations available in this dataset rather than as values that can never be revised.
The simple country mean is not world GDP growth
The 3.56% mean gives each of the 186 reporting economies equal weight. A large economy and a small territory contribute one rate each.
Official world GDP growth requires weighting economies by their economic size. The simple mean here is useful only for describing the distribution of national growth rates.
Source and calculation notes
The source is World Bank World Development Indicators series NY.GDP.MKTP.KD.ZG. The analysis uses 186 numeric 2025 observations from a 217-economy frame to calculate the mean, median, quartiles, rankings and growth bands, while 31 source-missing rows are excluded from numeric statistics.
All 217 geography codes are matched to map centroids, producing a 100% geographic match. The 186 numeric observations are mapped by value and the 31 source-missing rows are shown as No data rather than zero.
Frequently Asked Questions
Is the 2025 GDP growth rate nominal GDP growth?
No. NY.GDP.MKTP.KD.ZG is the annual growth rate of real GDP based on constant-price national accounts.
Are GDP growth and GDP-per-capita growth the same?
No. Aggregate GDP growth measures total output, while per-capita growth also reflects changes in population.
Do the 31 No data economies have zero growth?
No. They lack a usable 2025 numeric observation in the source and are not converted to zero.
Related Articles
Green Map creates custom-edited map images using open geographic data sources such as geoBoundaries, Natural Earth, OpenStreetMap, and government open data. These maps are edited visual materials, not raw data files, and are provided for education, documents, presentations, and graphic reference.