Tertiary gross enrollment is the ratio of total enrollment in tertiary education, regardless of age, to the population of the age group officially associated with that education level. Because the numerator includes students outside the official age group, the ratio can exceed 100%. The World Bank SE.TER.ENRR file contains 203 latest non-empty observations. Only 9 are from 2025, while 87 are from 2024, making 2024 the largest recent same-year comparison group.
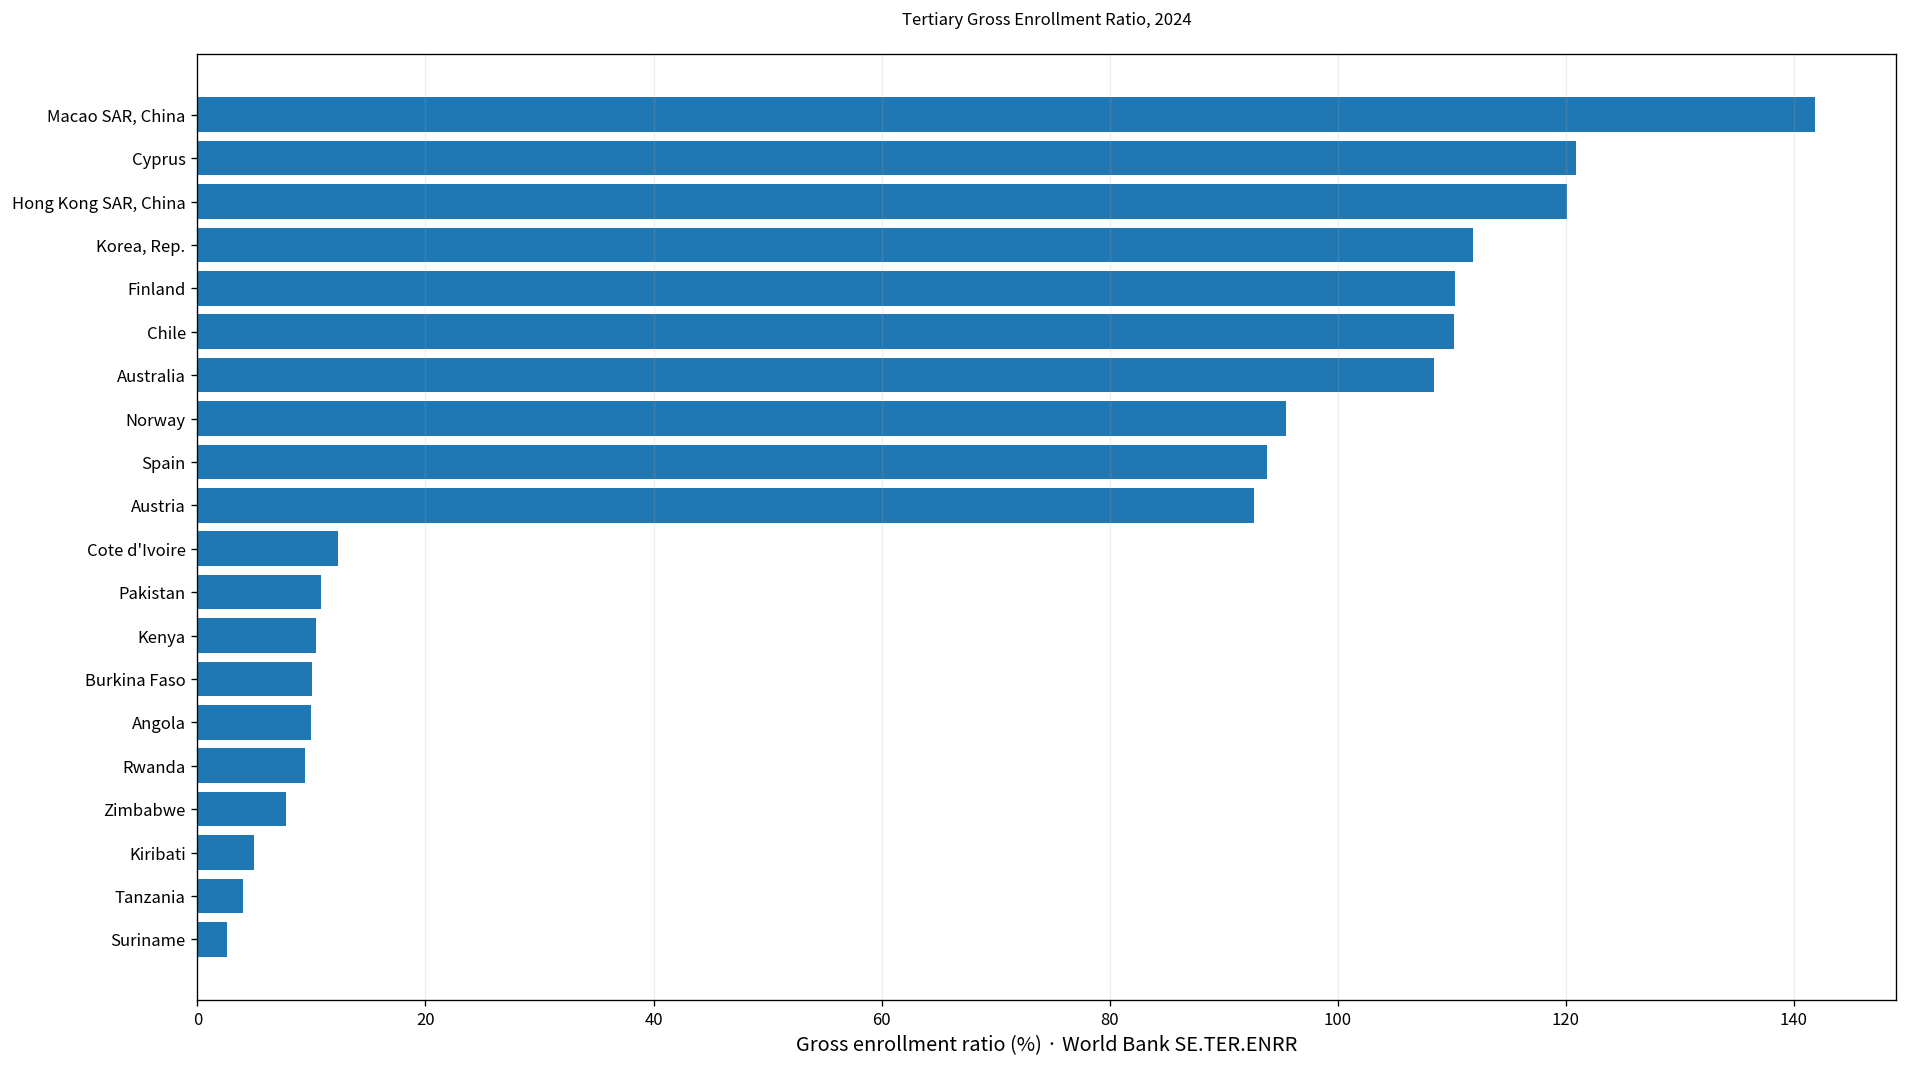
Table of Contents
What tertiary gross enrollment measures
The World Bank defines the gross enrollment ratio as total enrollment in an education level, regardless of age, divided by the population of the age group that officially corresponds to that level. Tertiary education normally requires successful completion of secondary education as a minimum admission condition and includes a broad range of post-secondary programs.
The numerator and denominator therefore do not contain exactly the same age population. Older students, younger entrants, people returning to education, and students whose study path is longer than the nominal duration can all remain in the numerator. That design makes the gross ratio useful for system scale but different from a strict age-specific participation rate.
Values above 100% are valid
In the 2024 subset, 7 of the 87 observations are at or above 100%. Macao SAR, China records 141.86%, Cyprus 120.88%, Hong Kong SAR, China 120.09%, Finland 110.30%, Chile 110.18%, and Australia 108.42%.
A value of 120% does not mean that 120% of the official-age population is literally enrolled. It means total tertiary enrollment, including students outside the official age range, is equivalent to 120% of the size of the official-age reference population.
The 2025 group is too small for a broad global comparison
The nine 2025 observations are Georgia 89.49%, Uzbekistan 59.81%, Kyrgyz Republic 53.88%, Kazakhstan 52.86%, Barbados 50.80%, Thailand 49.08%, Egypt, Arab Rep. 38.04%, India 34.45%, and Burundi 6.38%.
They are the newest observations in the file, but nine economies cannot describe the global distribution. For that reason, the article keeps them visible but uses the 87-economy 2024 subset for the main same-year comparison.
The 2024 mean is 52.18% and the median is 52.77%
The 2024 subset contains 87 economies. The mean is 52.18% and the median 52.77%. The first quartile is 21.93% and the third quartile 75.31%, putting the middle half roughly between 21.9% and 75.3%.
44 observations are at least 50%, 23 are at least 75%, and 7 are at least 100%. At the lower end, 27 are below 25% and 6 are below 10%. The spread is wide even within one common year.
Macao SAR, China is highest in 2024 at 141.86%
Macao SAR, China records 141.86%, followed by Cyprus at 120.88%, Hong Kong SAR, China at 120.09%, Finland at 110.30%, Chile at 110.18%, and Australia at 108.42%. Norway records 95.50%, Spain 93.77%, Austria 92.61%, and Ukraine 87.19%.
| 2024 rank | Economy/territory | Tertiary gross enrollment |
|---|---|---|
| 1 | Macao SAR, China | 141.86% |
| 2 | Cyprus | 120.88% |
| 3 | Hong Kong SAR, China | 120.09% |
| 4 | Korea, Rep. | 111.85% |
| 5 | Finland | 110.30% |
| 6 | Chile | 110.18% |
| 7 | Australia | 108.42% |
| 8 | Norway | 95.50% |
| 9 | Spain | 93.77% |
| 10 | Austria | 92.61% |
| 11 | Ukraine | 87.19% |
| 12 | Albania | 84.15% |
| 13 | Sweden | 84.00% |
| 14 | Saudi Arabia | 83.88% |
| 15 | Latvia | 82.92% |
A high gross enrollment ratio indicates a large tertiary student population relative to the official-age reference population. It does not directly measure education quality, graduation, labor-market outcomes, affordability, or spending per student.
Suriname is lowest in 2024 at 2.57%
At the lower end, Suriname records 2.57%, Tanzania 4.02%, Kiribati 4.96%, Zimbabwe 7.75%, Rwanda 9.41%, and Angola 9.95%. Burkina Faso is at 10.04%, Kenya 10.42%, Pakistan 10.86%, and Cote d’Ivoire 12.34%.
| Low-order position in 2024 | Economy/territory | Tertiary gross enrollment |
|---|---|---|
| 1 | Suriname | 2.57% |
| 2 | Tanzania | 4.02% |
| 3 | Kiribati | 4.96% |
| 4 | Zimbabwe | 7.75% |
| 5 | Rwanda | 9.41% |
| 6 | Angola | 9.95% |
| 7 | Burkina Faso | 10.04% |
| 8 | Kenya | 10.42% |
| 9 | Pakistan | 10.86% |
| 10 | Cote d’Ivoire | 12.34% |
| 11 | Bhutan | 13.01% |
| 12 | Gambia, The | 13.48% |
| 13 | Aruba | 14.07% |
| 14 | Seychelles | 14.53% |
| 15 | Senegal | 15.33% |
A low value means tertiary enrollment is small relative to the official-age population. The indicator alone does not identify the cause. Secondary completion, admission systems, tuition, institutional capacity, distance, labor-market incentives, adult learning, and study abroad can all matter.
Greece reaches 165.11% in the 2023 group
The 2023 subset contains 43 economies, with a mean of 55.93% and a median of 55.01%. Greece is highest at 165.11%, followed by Argentina at 107.82%, Turkiye at 105.89%, Singapore at 97.29%, and the Netherlands at 86.59%.
| 2023 high-order position | Economy/territory | Tertiary gross enrollment |
|---|---|---|
| 1 | Greece | 165.11% |
| 2 | Argentina | 107.82% |
| 3 | Turkiye | 105.89% |
| 4 | Singapore | 97.29% |
| 5 | Netherlands | 86.59% |
| 6 | Belgium | 82.15% |
| 7 | Croatia | 81.18% |
| 8 | Malta | 80.53% |
| 9 | United Kingdom | 80.41% |
| 10 | Slovenia | 80.08% |
| 11 | Uruguay | 79.95% |
| 12 | Puerto Rico (US) | 77.93% |
The 2023 mean is higher than the 2024 mean, but that does not establish a one-year global decline. The annual groups contain different economies. A time trend should match the same countries across years.
Gross enrollment is different from net enrollment
Gross enrollment includes students regardless of age. Net enrollment or age-specific participation measures focus more directly on people in the official age range. Gross enrollment is therefore a broad measure of the scale and reach of the tertiary system, not a pure age-cohort participation rate.
This distinction is particularly important in tertiary education because entry age, program duration, returning students, and adult education vary widely. Ratios above 100% are therefore more plausible than they would be under a strictly age-matched measure.
Enrollment is also different from educational attainment
Enrollment measures people currently participating in education. Attainment measures the share of a population that has already completed a specified level. A country can have high current enrollment without yet having a similarly high share of older adults who completed tertiary education.
Completion, dropout, migration, and past access conditions all affect the relationship between current enrollment and accumulated attainment. Long-run human-capital analysis should therefore use attainment indicators alongside enrollment.
Male and female enrollment reveal the composition behind the total
The total gross enrollment ratio combines women and men. Two economies can have the same total value with very different gender patterns. Separate female and male gross-enrollment indicators show whether women are more numerous, men are more numerous, or participation is relatively balanced.
The total ratio is useful for system size; sex-specific ratios are better for understanding composition and balance. Neither should be substituted for the other.
Cross-border study can also affect interpretation
Tertiary enrollment can be influenced by international student mobility. Small economies and education hubs can have enrollment that is large relative to their own official-age population. However, this indicator alone cannot determine how much of a value above 100% is caused by international students.
To identify the mechanism, one would need data on foreign students, outbound study, age distribution, institutional capacity, and program duration. The gross enrollment ratio reports the resulting scale rather than decomposing its causes.
The 203 latest observations do not share one year
The complete latest-observation file spans 1986–2025. The largest group is 2024 with 87 economies, followed by 2023 with 43 and 2025 with 9. A number of economies retain much older final observations.
| Observation year | Economies/territories | Share of 203 |
|---|---|---|
| 2025 | 9 | 4.4% |
| 2024 | 87 | 42.9% |
| 2023 | 43 | 21.2% |
| 2022 | 9 | 4.4% |
| 2021 | 2 | 1.0% |
| 2020 | 5 | 2.5% |
| 2019 | 2 | 1.0% |
| 2018 | 6 | 3.0% |
| 2017 | 2 | 1.0% |
| 2016 | 2 | 1.0% |
| 2015 | 5 | 2.5% |
| 2014 | 3 | 1.5% |
| 2013 | 2 | 1.0% |
| 2012 | 4 | 2.0% |
| 2011 | 3 | 1.5% |
| 2010 | 1 | 0.5% |
| 2009 | 1 | 0.5% |
| 2008 | 1 | 0.5% |
| 2006 | 1 | 0.5% |
| 2005 | 1 | 0.5% |
| 2004 | 1 | 0.5% |
| 2003 | 2 | 1.0% |
| 2002 | 1 | 0.5% |
| 2000 | 2 | 1.0% |
| 1999 | 1 | 0.5% |
| 1995 | 1 | 0.5% |
| 1993 | 2 | 1.0% |
| 1992 | 1 | 0.5% |
| 1989 | 1 | 0.5% |
| 1987 | 1 | 0.5% |
| 1986 | 1 | 0.5% |
The latest-value inventory should therefore not be described as a current 203-economy ranking. Haiti’s latest observation is from 1986 and American Samoa’s from 1989, for example. The observation year must remain visible when interpreting the complete table.
Complete list of the 203 latest observations
The table below lists each economy and territory’s latest non-empty observation in alphabetical order. For a strict same-year comparison, the 87 observations from 2024 provide the strongest recent coverage.
| Economy/territory | Observation year | Tertiary gross enrollment |
|---|---|---|
| Afghanistan | 2020 | 10.85% |
| Albania | 2024 | 84.15% |
| Algeria | 2024 | 54.43% |
| American Samoa | 1989 | 19.62% |
| Andorra | 2024 | 67.68% |
| Angola | 2024 | 9.95% |
| Antigua and Barbuda | 2012 | 25.12% |
| Argentina | 2023 | 107.82% |
| Armenia | 2024 | 52.77% |
| Aruba | 2024 | 14.07% |
| Australia | 2024 | 108.42% |
| Austria | 2024 | 92.61% |
| Azerbaijan | 2024 | 41.34% |
| Bahamas, The | 1995 | 14.84% |
| Bahrain | 2024 | 58.37% |
| Bangladesh | 2024 | 23.73% |
| Barbados | 2025 | 50.80% |
| Belarus | 2024 | 70.11% |
| Belgium | 2023 | 82.15% |
| Belize | 2024 | 24.81% |
| Benin | 2022 | 10.24% |
| Bermuda | 2023 | 17.34% |
| Bhutan | 2024 | 13.01% |
| Bosnia and Herzegovina | 2023 | 45.50% |
| Botswana | 2024 | 21.41% |
| Brazil | 2024 | 69.73% |
| British Virgin Islands | 2024 | 29.56% |
| Brunei Darussalam | 2023 | 36.42% |
| Bulgaria | 2024 | 69.55% |
| Burkina Faso | 2024 | 10.04% |
| Burundi | 2025 | 6.38% |
| Cabo Verde | 2018 | 24.29% |
| Cambodia | 2024 | 21.44% |
| Cameroon | 2024 | 16.66% |
| Canada | 2023 | 76.27% |
| Cayman Islands | 2008 | 33.02% |
| Central African Republic | 2012 | 2.78% |
| Chad | 2020 | 4.40% |
| Chile | 2024 | 110.18% |
| China | 2024 | 76.88% |
| Colombia | 2022 | 59.29% |
| Comoros | 2017 | 18.82% |
| Congo, Dem. Rep. | 2020 | 6.38% |
| Congo, Rep. | 2023 | 10.38% |
| Costa Rica | 2019 | 55.02% |
| Cote d’Ivoire | 2024 | 12.34% |
| Croatia | 2023 | 81.18% |
| Cuba | 2024 | 43.10% |
| Curacao | 2013 | 23.08% |
| Cyprus | 2024 | 120.88% |
| Czechia | 2023 | 66.73% |
| Denmark | 2024 | 78.96% |
| Djibouti | 2011 | 5.16% |
| Dominica | 1993 | 6.95% |
| Dominican Republic | 2024 | 57.65% |
| Ecuador | 2023 | 67.89% |
| Egypt, Arab Rep. | 2025 | 38.04% |
| El Salvador | 2024 | 32.83% |
| Equatorial Guinea | 2000 | 1.84% |
| Eritrea | 2016 | 3.20% |
| Estonia | 2024 | 65.67% |
| Eswatini | 2013 | 6.44% |
| Ethiopia | 2014 | 5.92% |
| Fiji | 2024 | 75.01% |
| Finland | 2024 | 110.30% |
| France | 2024 | 71.53% |
| French Polynesia | 1992 | 1.46% |
| Gabon | 2003 | 7.66% |
| Gambia, The | 2024 | 13.48% |
| Georgia | 2025 | 89.49% |
| Germany | 2024 | 76.71% |
| Ghana | 2024 | 21.33% |
| Greece | 2023 | 165.11% |
| Grenada | 2018 | 99.99% |
| Guatemala | 2023 | 27.29% |
| Guinea | 2014 | 10.85% |
| Guinea-Bissau | 2006 | 2.62% |
| Guyana | 2024 | 26.43% |
| Haiti | 1986 | 1.05% |
| Honduras | 2024 | 23.32% |
| Hong Kong SAR, China | 2024 | 120.09% |
| Hungary | 2024 | 60.52% |
| Iceland | 2023 | 76.52% |
| India | 2025 | 34.45% |
| Indonesia | 2023 | 44.88% |
| Iran, Islamic Rep. | 2022 | 58.68% |
| Iraq | 2005 | 15.56% |
| Ireland | 2022 | 77.59% |
| Israel | 2024 | 56.26% |
| Italy | 2023 | 75.95% |
| Jamaica | 2015 | 26.23% |
| Japan | 2023 | 64.49% |
| Jordan | 2024 | 35.92% |
| Kazakhstan | 2025 | 52.86% |
| Kenya | 2024 | 10.42% |
| Kiribati | 2024 | 4.96% |
| Korea, Dem. People’s Rep. | 2018 | 26.72% |
| Korea, Rep. | 2024 | 111.85% |
| Kuwait | 2021 | 51.90% |
| Kyrgyz Republic | 2025 | 53.88% |
| Lao PDR | 2023 | 14.88% |
| Latvia | 2024 | 82.92% |
| Lebanon | 2023 | 54.40% |
| Lesotho | 2018 | 9.94% |
| Liberia | 2012 | 10.84% |
| Libya | 2003 | 58.54% |
| Liechtenstein | 2021 | 46.02% |
| Lithuania | 2024 | 75.62% |
| Luxembourg | 2024 | 22.41% |
| Macao SAR, China | 2024 | 141.86% |
| Madagascar | 2023 | 6.15% |
| Malawi | 2022 | 2.71% |
| Malaysia | 2024 | 38.50% |
| Maldives | 2022 | 48.50% |
| Mali | 2015 | 5.13% |
| Malta | 2023 | 80.53% |
| Marshall Islands | 2024 | 37.69% |
| Mauritania | 2020 | 5.97% |
| Mauritius | 2024 | 45.78% |
| Mexico | 2024 | 48.20% |
| Micronesia, Fed. Sts. | 2000 | 13.36% |
| Moldova | 2024 | 74.71% |
| Monaco | 2024 | 77.48% |
| Mongolia | 2024 | 69.04% |
| Montenegro | 2023 | 55.17% |
| Morocco | 2024 | 48.18% |
| Mozambique | 2018 | 7.46% |
| Myanmar | 2018 | 20.37% |
| Namibia | 2022 | 26.11% |
| Nepal | 2024 | 21.29% |
| Netherlands | 2023 | 86.59% |
| New Zealand | 2024 | 77.24% |
| Nicaragua | 2023 | 30.36% |
| Niger | 2019 | 4.15% |
| Nigeria | 2011 | 9.74% |
| North Macedonia | 2023 | 55.01% |
| Norway | 2024 | 95.50% |
| Oman | 2024 | 42.23% |
| Pakistan | 2024 | 10.86% |
| Palau | 2024 | 71.84% |
| Panama | 2023 | 53.69% |
| Papua New Guinea | 1999 | 1.95% |
| Paraguay | 2010 | 37.62% |
| Peru | 2017 | 71.24% |
| Philippines | 2024 | 47.41% |
| Poland | 2024 | 80.91% |
| Portugal | 2023 | 77.68% |
| Puerto Rico (US) | 2023 | 77.93% |
| Qatar | 2024 | 43.02% |
| Romania | 2023 | 55.17% |
| Russian Federation | 2024 | 60.39% |
| Rwanda | 2024 | 9.41% |
| Samoa | 2024 | 16.03% |
| San Marino | 2024 | 57.55% |
| Sao Tome and Principe | 2015 | 12.82% |
| Saudi Arabia | 2024 | 83.88% |
| Senegal | 2024 | 15.33% |
| Serbia | 2024 | 70.58% |
| Seychelles | 2024 | 14.53% |
| Sierra Leone | 2002 | 1.99% |
| Singapore | 2023 | 97.29% |
| Sint Maarten (Dutch part) | 2023 | 7.65% |
| Slovak Republic | 2024 | 54.47% |
| Slovenia | 2023 | 80.08% |
| Somalia, Fed. Rep. | 1987 | 2.41% |
| South Africa | 2023 | 23.49% |
| Spain | 2024 | 93.77% |
| Sri Lanka | 2023 | 20.74% |
| St. Kitts and Nevis | 2015 | 93.92% |
| St. Lucia | 2023 | 15.04% |
| St. Vincent and the Grenadines | 2022 | 41.50% |
| Sudan | 2015 | 15.86% |
| Suriname | 2024 | 2.57% |
| Sweden | 2024 | 84.00% |
| Switzerland | 2024 | 73.54% |
| Syrian Arab Republic | 2016 | 43.76% |
| Tajikistan | 2024 | 35.64% |
| Tanzania | 2024 | 4.02% |
| Thailand | 2025 | 49.08% |
| Timor-Leste | 2023 | 30.96% |
| Togo | 2020 | 14.90% |
| Tonga | 2023 | 42.86% |
| Trinidad and Tobago | 2024 | 23.85% |
| Tunisia | 2023 | 38.12% |
| Turkiye | 2023 | 105.89% |
| Turkmenistan | 2024 | 20.43% |
| Turks and Caicos Islands | 2023 | 25.25% |
| Tuvalu | 2023 | 19.35% |
| Uganda | 2014 | 4.62% |
| Ukraine | 2024 | 87.19% |
| United Arab Emirates | 2024 | 63.74% |
| United Kingdom | 2023 | 80.41% |
| United States | 2022 | 79.36% |
| Uruguay | 2023 | 79.95% |
| Uzbekistan | 2025 | 59.81% |
| Vanuatu | 2004 | 4.88% |
| Venezuela, RB | 2009 | 78.27% |
| Viet Nam | 2024 | 37.59% |
| Virgin Islands (U.S.) | 1993 | 33.55% |
| West Bank and Gaza | 2023 | 44.49% |
| Yemen, Rep. | 2011 | 8.81% |
| Zambia | 2012 | 3.96% |
| Zimbabwe | 2024 | 7.75% |
How to interpret the comparison
First, gross enrollment can exceed 100% because students outside the official age group are included. Second, enrollment is not the same as completion or education quality. Third, the 203 latest observations are mixed-year data. Fourth, the total indicator does not show gender gaps by itself.
Fifth, cross-country differences can reflect many factors rather than a single cause. Secondary completion, capacity, cost, adult learning, student mobility, and demography all matter. Net enrollment, attainment, completion, and gender-specific measures provide useful additional context.
Source and calculation
The source is World Bank World Development Indicators SE.TER.ENRR, School enrollment, tertiary (% gross). The 2024 mean, median, quartiles, threshold counts, and rankings are calculated from the 87 observations dated 2024. The 43 observations from 2023 are presented separately as additional context.
Frequently Asked Questions
Can the tertiary gross enrollment ratio exceed 100%?
Yes. Enrollment includes students of all ages, so total enrollment can be larger than the official-age reference population.
What is the 2024 median?
The median across the 87 observations dated 2024 is 52.77%, while the mean is 52.18%.
Is gross enrollment the same as the graduation rate?
No. Gross enrollment measures current enrollment scale, while graduation and educational attainment are separate outcomes.
Related Articles
Green Map creates custom-edited map images using open geographic data sources such as geoBoundaries, Natural Earth, OpenStreetMap, and government open data. These maps are edited visual materials, not raw data files, and are provided for education, documents, presentations, and graphic reference.