The U.S. Energy Information Administration’s State Energy Data System (SEDS) reports a 2024 series labeled “Waste energy total consumption” for all 50 states and the District of Columbia. All 51 jurisdictions share the same year and unit, Billion Btu. 50 observations are positive and Wyoming alone has a published value of zero.
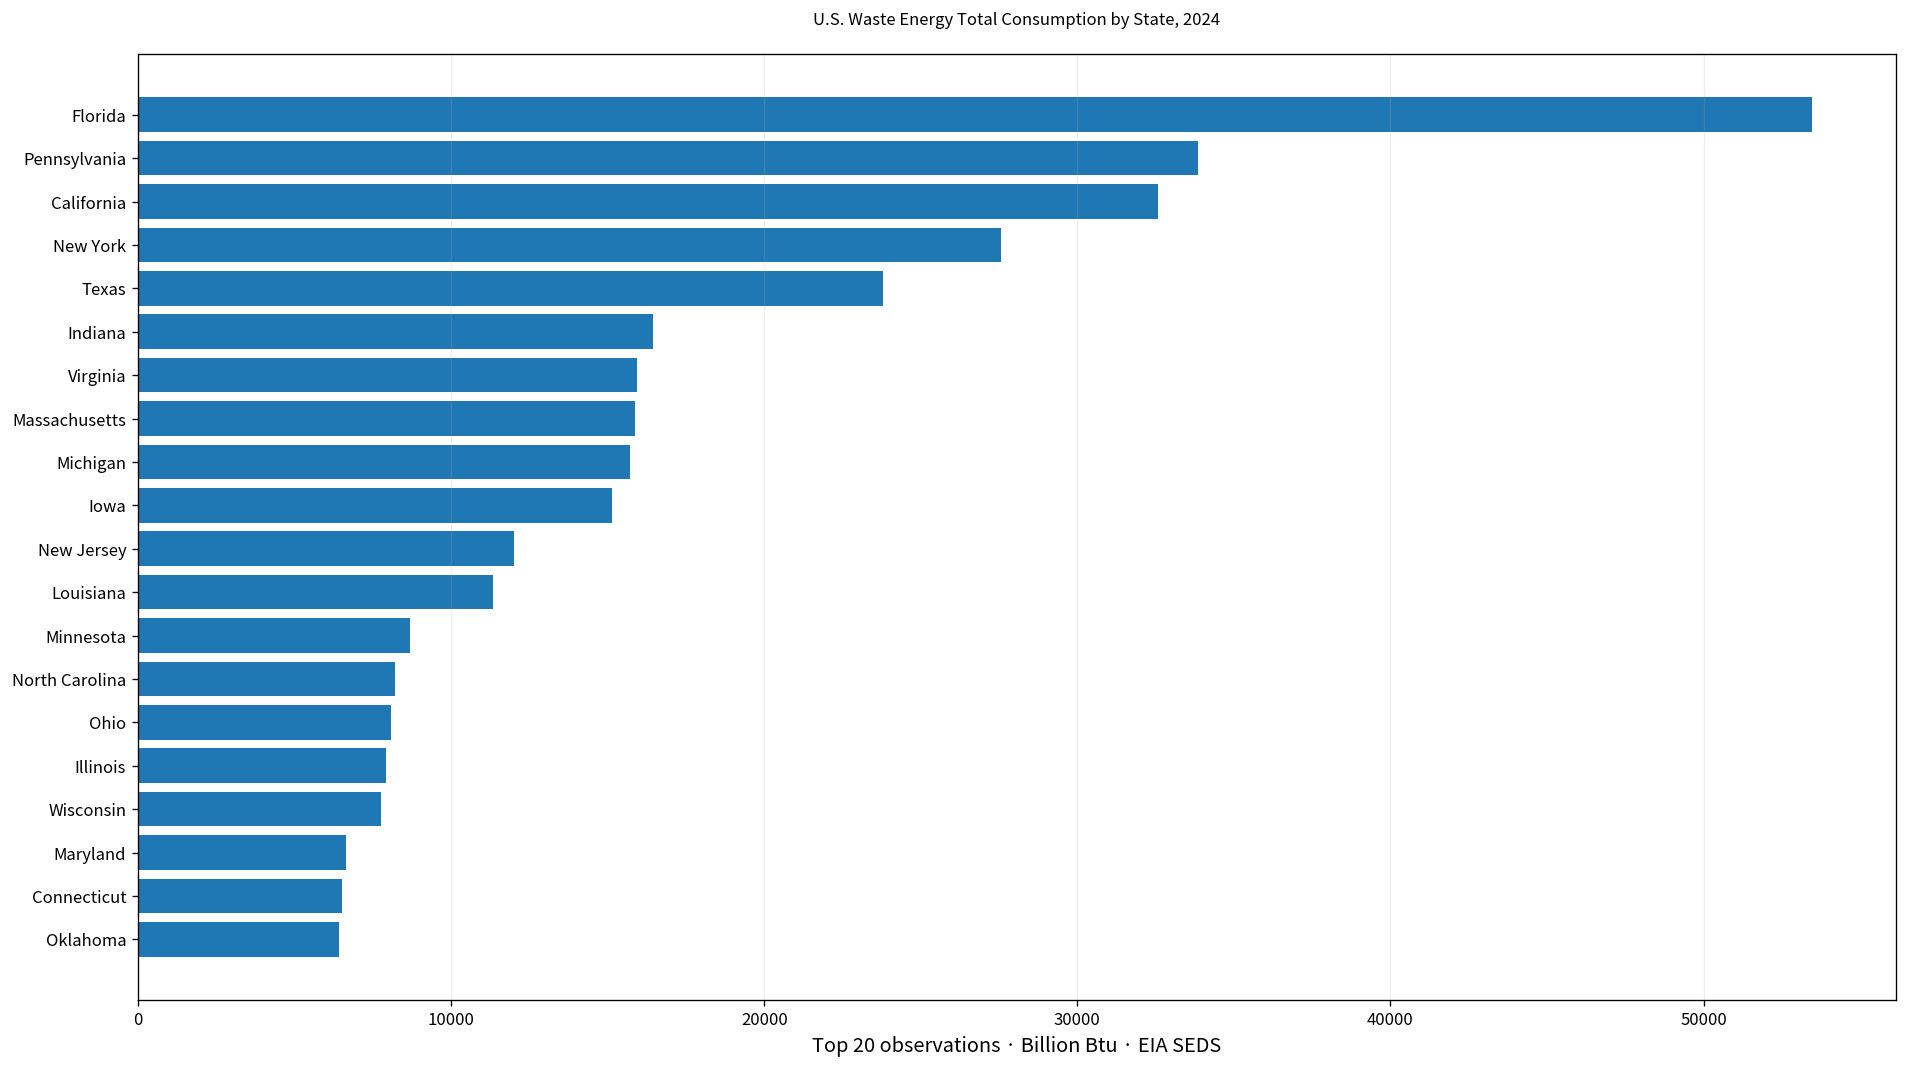
Table of Contents
Waste energy total consumption is not a measure of waste generation
The exact source series is “Waste energy total consumption.” This article keeps that definition rather than relabeling the values as tons of waste generated, recycled, landfilled, or incinerated. The numbers are energy quantities, not physical waste volumes.
SEDS is designed to compare state energy activity across fuels and sectors in common energy units. A high value in this series means a high recorded quantity of waste energy consumption under this EIA definition. It does not by itself identify how much municipal waste a state produces or how its waste-management system operates.
All 51 jurisdictions are from 2024, with no missing values
Every row is dated 2024 and every row contains a numeric value, so there is no mixed-year problem and no missing-data imputation. Wyoming’s zero is a direct published observation rather than a blank cell replaced with zero.
The sum of the 51 state/DC observations is 386,886 Billion Btu. The simple mean is 7,586 Billion Btu and the median is 3,007. The first quartile is 910 and the third quartile 8,447 Billion Btu.
Florida is highest at 53,469 Billion Btu
Florida records 53,469 Billion Btu, followed by Pennsylvania at 33,869, California at 32,579, New York at 27,578, and Texas at 23,798. These are the five jurisdictions above 20,000 Billion Btu.
| Rank | State/jurisdiction | 2024 waste energy total consumption |
|---|---|---|
| 1 | Florida | 53,469 Billion Btu |
| 2 | Pennsylvania | 33,869 Billion Btu |
| 3 | California | 32,579 Billion Btu |
| 4 | New York | 27,578 Billion Btu |
| 5 | Texas | 23,798 Billion Btu |
| 6 | Indiana | 16,465 Billion Btu |
| 7 | Virginia | 15,940 Billion Btu |
| 8 | Massachusetts | 15,879 Billion Btu |
| 9 | Michigan | 15,719 Billion Btu |
| 10 | Iowa | 15,155 Billion Btu |
| 11 | New Jersey | 11,999 Billion Btu |
| 12 | Louisiana | 11,342 Billion Btu |
| 13 | Minnesota | 8,678 Billion Btu |
| 14 | North Carolina | 8,216 Billion Btu |
| 15 | Ohio | 8,069 Billion Btu |
| 16 | Illinois | 7,912 Billion Btu |
| 17 | Wisconsin | 7,772 Billion Btu |
| 18 | Maryland | 6,636 Billion Btu |
| 19 | Connecticut | 6,527 Billion Btu |
| 20 | Oklahoma | 6,417 Billion Btu |
Florida alone represents about 13.8% of the sum of the 51 observations. The top three account for 31.0%, the top five for 44.3%, and the top ten for 64.7%. The distribution is concentrated, although not as dominated by a single state as some other state-energy series.
Twelve jurisdictions are at or above 10,000 Billion Btu
12 jurisdictions reach at least 10,000 Billion Btu, including 5 at or above 20,000 and 3 at or above 30,000. Indiana records 16,465, Virginia 15,940, Massachusetts 15,879, Michigan 15,719, and Iowa 15,155 Billion Btu.
New Jersey records 11,999 and Louisiana 11,342 Billion Btu. Below that group are Minnesota at 8,678, North Carolina at 8,216, Ohio at 8,069, Illinois at 7,912, and Wisconsin at 7,772. Large observations therefore appear across several parts of the country rather than in one single region.
Wyoming is the only zero observation
Wyoming is the only jurisdiction with a published value of zero. North Dakota is next at 177 Billion Btu, followed by West Virginia at 187, Arizona at 210, South Dakota at 220, Montana at 333, New Mexico at 390, Delaware at 499, Alaska at 520, and Vermont at 579.
| Low-order position | State/jurisdiction | 2024 waste energy total consumption |
|---|---|---|
| 1 | Wyoming | 0 Billion Btu |
| 2 | North Dakota | 177 Billion Btu |
| 3 | West Virginia | 187 Billion Btu |
| 4 | Arizona | 210 Billion Btu |
| 5 | South Dakota | 220 Billion Btu |
| 6 | Montana | 333 Billion Btu |
| 7 | New Mexico | 390 Billion Btu |
| 8 | Delaware | 499 Billion Btu |
| 9 | Alaska | 520 Billion Btu |
| 10 | Vermont | 579 Billion Btu |
| 11 | Nevada | 715 Billion Btu |
| 12 | Utah | 873 Billion Btu |
| 13 | District of Columbia | 899 Billion Btu |
| 14 | Mississippi | 921 Billion Btu |
| 15 | Alabama | 1,047 Billion Btu |
| 16 | Colorado | 1,050 Billion Btu |
| 17 | Arkansas | 1,052 Billion Btu |
| 18 | Idaho | 1,127 Billion Btu |
| 19 | Nebraska | 1,826 Billion Btu |
| 20 | Maine | 2,013 Billion Btu |
14 jurisdictions are below 1,000 Billion Btu. The zero and small positive observations are retained exactly as published. They should not be expanded into claims that a state has no waste resource or no waste-management activity; they describe only this specific EIA energy-consumption series.
The geographic spread is descriptive, not causal
Large values appear in Florida and other eastern states, but California and Texas are also in the top five and Iowa is in the top ten. Lower values appear in several Plains and Mountain states. That geography can be described directly from the observations, but the dataset does not establish why the pattern exists.
Population, industry, waste-to-energy infrastructure, fuel classification, and the sector composition of energy use could all be relevant. Determining the contribution of any one factor would require additional official data on facilities and the specific types of waste energy used.
Total consumption must be kept separate from sector-specific consumption
The words “total consumption” are part of the series identity. EIA SEDS contains many energy-source and sector combinations, so another series containing “waste energy” may represent electric-power use, end use, or another sector boundary.
Values from those different series should not be merged simply because they share the same energy-source label. The current comparison uses one fixed official series, one unit, one year, and one state coverage.
Billion Btu is an energy unit, not a mass of waste
A Btu is a unit of energy, and Billion Btu means one billion British thermal units. The values therefore do not indicate tons, kilograms, or cubic meters of waste. Converting them directly into a waste mass would require information on the type and heat content of the material.
The common energy unit is useful because SEDS can compare consumption across very different fuels. It also means the article should be read as an energy comparison rather than a waste-volume comparison.
The mean is much higher than the median
The average of 7,586 Billion Btu is more than twice the median of 3,007. Florida, Pennsylvania, California, New York, and Texas pull the mean upward. The median and quartile range therefore give an important complement to the average.
Roughly half of the jurisdictions are at or below 3,007 Billion Btu, while the upper-quartile boundary is about 8,447. The gap between the middle of the distribution and the top states is one of the clearest features of the 2024 data.
Complete 2024 table for all 50 states and DC
The table below preserves all 51 observations in alphabetical order. Every row is from 2024, every value is in Billion Btu, and Wyoming’s published zero remains zero.
| State/jurisdiction | Code | Waste energy total consumption |
|---|---|---|
| Alabama | AL | 1,047 Billion Btu |
| Alaska | AK | 520 Billion Btu |
| Arizona | AZ | 210 Billion Btu |
| Arkansas | AR | 1,052 Billion Btu |
| California | CA | 32,579 Billion Btu |
| Colorado | CO | 1,050 Billion Btu |
| Connecticut | CT | 6,527 Billion Btu |
| Delaware | DE | 499 Billion Btu |
| District of Columbia | DC | 899 Billion Btu |
| Florida | FL | 53,469 Billion Btu |
| Georgia | GA | 5,234 Billion Btu |
| Hawaii | HI | 3,726 Billion Btu |
| Idaho | ID | 1,127 Billion Btu |
| Illinois | IL | 7,912 Billion Btu |
| Indiana | IN | 16,465 Billion Btu |
| Iowa | IA | 15,155 Billion Btu |
| Kansas | KS | 2,224 Billion Btu |
| Kentucky | KY | 2,935 Billion Btu |
| Louisiana | LA | 11,342 Billion Btu |
| Maine | ME | 2,013 Billion Btu |
| Maryland | MD | 6,636 Billion Btu |
| Massachusetts | MA | 15,879 Billion Btu |
| Michigan | MI | 15,719 Billion Btu |
| Minnesota | MN | 8,678 Billion Btu |
| Mississippi | MS | 921 Billion Btu |
| Missouri | MO | 2,223 Billion Btu |
| Montana | MT | 333 Billion Btu |
| Nebraska | NE | 1,826 Billion Btu |
| Nevada | NV | 715 Billion Btu |
| New Hampshire | NH | 3,007 Billion Btu |
| New Jersey | NJ | 11,999 Billion Btu |
| New Mexico | NM | 390 Billion Btu |
| New York | NY | 27,578 Billion Btu |
| North Carolina | NC | 8,216 Billion Btu |
| North Dakota | ND | 177 Billion Btu |
| Ohio | OH | 8,069 Billion Btu |
| Oklahoma | OK | 6,417 Billion Btu |
| Oregon | OR | 4,149 Billion Btu |
| Pennsylvania | PA | 33,869 Billion Btu |
| Rhode Island | RI | 2,135 Billion Btu |
| South Carolina | SC | 2,457 Billion Btu |
| South Dakota | SD | 220 Billion Btu |
| Tennessee | TN | 6,295 Billion Btu |
| Texas | TX | 23,798 Billion Btu |
| Utah | UT | 873 Billion Btu |
| Vermont | VT | 579 Billion Btu |
| Virginia | VA | 15,940 Billion Btu |
| Washington | WA | 3,844 Billion Btu |
| West Virginia | WV | 187 Billion Btu |
| Wisconsin | WI | 7,772 Billion Btu |
| Wyoming | WY | 0 Billion Btu |
What this dataset can and cannot tell us
Because the data cover all 50 states and DC in one year, they support direct comparisons of state values, rankings, quartiles, and concentration. Florida’s lead, Wyoming’s zero, and the size of the top-state contribution can all be calculated directly.
The series does not directly measure waste generation, recycling rates, landfill shares, incinerator counts, electricity generation from waste, environmental impact, or the economics of waste management. Those questions need different source variables.
Source and calculation
The source is the U.S. Energy Information Administration State Energy Data System (SEDS), series “Waste energy total consumption.” The analysis uses the 51 directly published 2024 observations for the 50 states and District of Columbia. The sum, mean, median, quartiles, rankings, and concentration shares are calculated directly from those values with no imputation.
Frequently Asked Questions
Is waste energy total consumption the same as the amount of waste generated?
No. It is an EIA SEDS energy-consumption series measured in Billion Btu, not a physical mass or volume of waste.
Which state has the largest 2024 value?
Florida is highest at 53,469 Billion Btu, followed by Pennsylvania at 33,869 and California at 32,579.
Which state reports zero?
Wyoming is the only state with a published 2024 value of zero; it is not a missing observation converted to zero.
Related Articles
Green Map creates custom-edited map images using open geographic data sources such as geoBoundaries, Natural Earth, OpenStreetMap, and government open data. These maps are edited visual materials, not raw data files, and are provided for education, documents, presentations, and graphic reference.