Industrial combustion released very different amounts of nitrous oxide across countries and territories in 2024. The World Bank indicator EN.GHG.N2O.IC.MT.CE.AR5 reports annual nitrous oxide (N₂O) emissions from industrial combustion within the energy sector, expressed in million tonnes of CO₂ equivalent (Mt CO₂e). The 2024 comparison contains 193 reported values, so unlike a mixed “latest available” dataset, the countries shown here can be compared on the same observation year.
Industrial combustion is narrower than total national N₂O emissions. It focuses on fuel combustion associated with manufacturing industries and construction rather than agriculture, waste, transport, power generation, buildings or separate industrial-process emissions. That distinction matters because a country can have high total N₂O emissions for reasons that are not captured by this series.
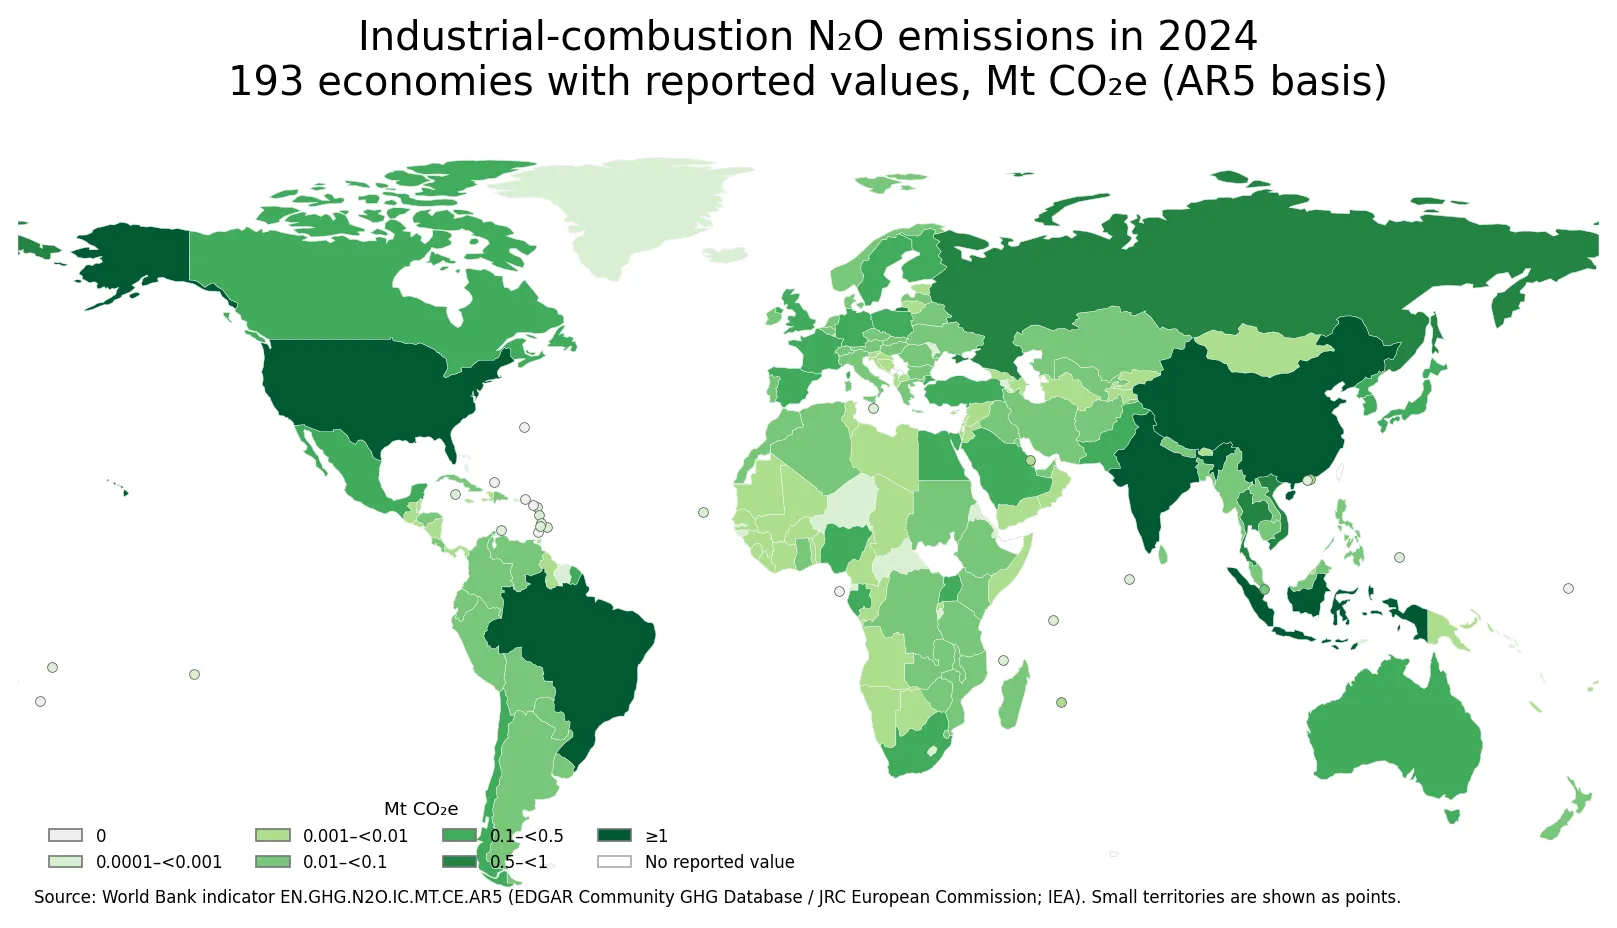
Table of Contents
A true same-year comparison: 193 reported values for 2024
The World Bank country-and-economy master list used for this indicator contains 217 non-aggregate entries for 2024. Of those, 193 have a numeric observation and 24 are source-missing. The missing rows are preserved as missing rather than treated as zero. This gives the map a clear interpretation: every colored polygon or point represents a reported 2024 value, while an unfilled location does not imply that industrial-combustion N₂O emissions were zero.
Because all 193 numeric observations refer to 2024, differences in the chart are not caused by mixing old and new reporting years. This is a major advantage over many international indicators whose “latest” country values come from different periods. It does not, however, remove every comparability issue. The figures are absolute annual emissions, not emissions per person, per unit of GDP, per tonne of industrial output or per unit of energy used. Country size and the scale and structure of manufacturing therefore remain important when reading the ranking.
India and China account for almost half of the reported total
The largest 2024 values are concentrated in a small group. India records 5.8369 Mt CO₂e and China 5.7324 Mt CO₂e. Brazil follows at 2.4277, the United States at 2.0003, and Indonesia at 1.0101 Mt CO₂e. Across the 193 reported observations, the simple sum is 25.7183 Mt CO₂e. India and China together make up about 45.0% of that reported-value sum, while the top five account for about 66.1%.
The concentration remains visible farther down the ranking. The ten largest reported values account for about 76.3% of the sum across the 193 available observations. This does not mean that the ten countries produce the same share of every kind of N₂O or greenhouse-gas emission. It describes only this indicator: N₂O from industrial combustion in the energy sector, converted to CO₂-equivalent units on the stated AR5 basis.
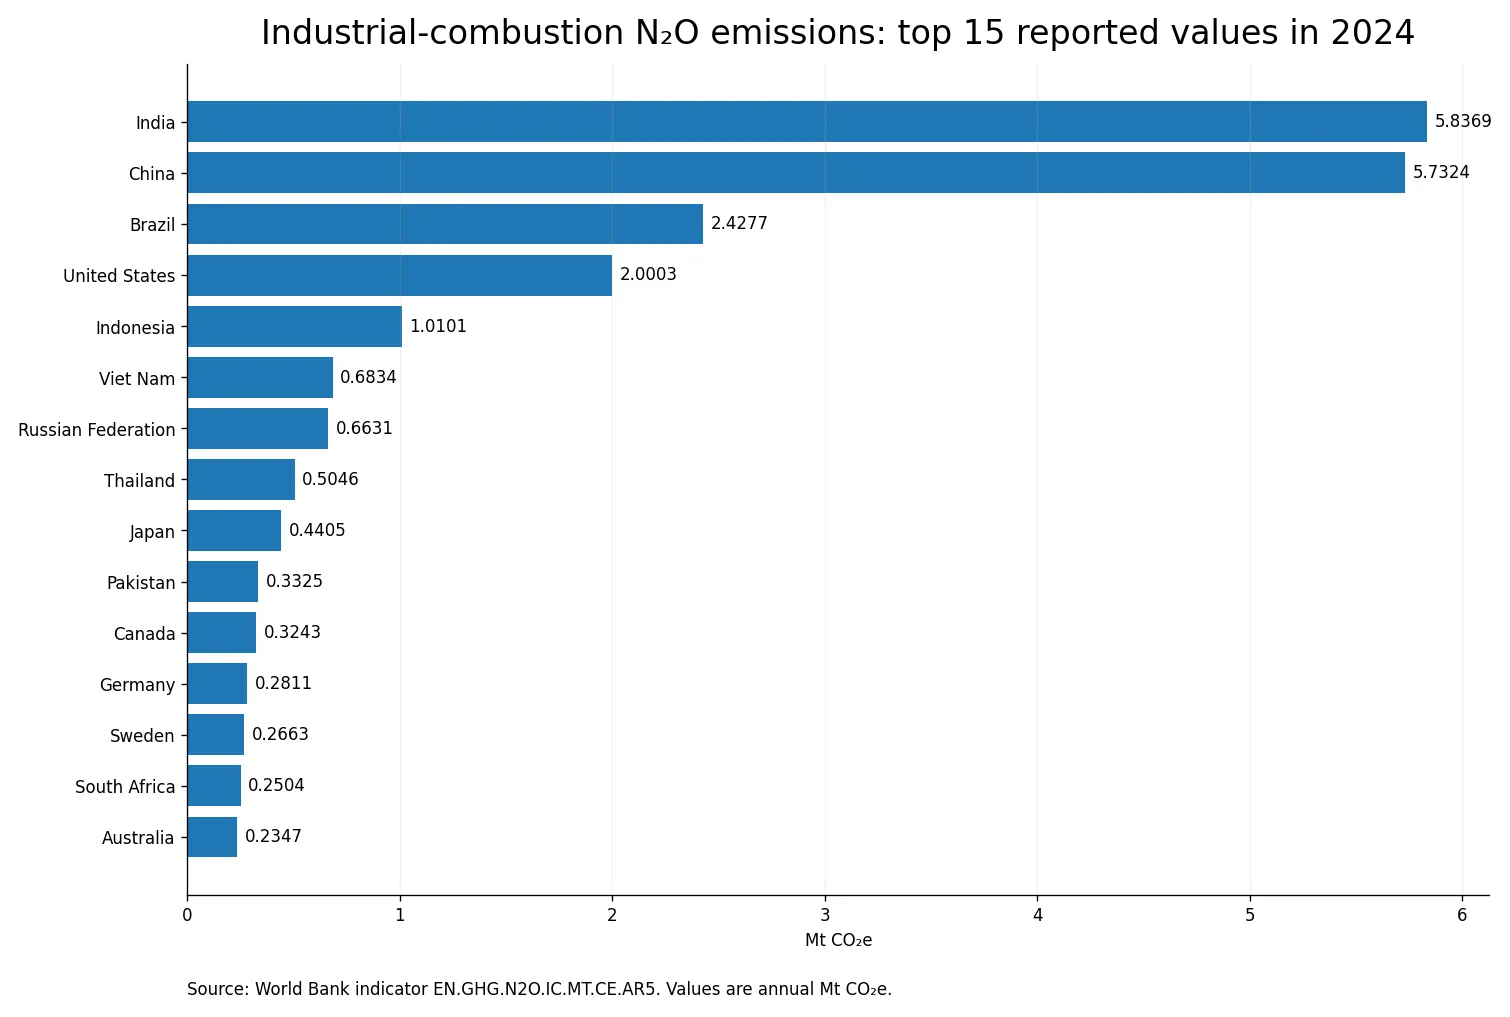
| Economy | 2024 Mt CO₂e |
|---|---|
| India | 5.8369 |
| China | 5.7324 |
| Brazil | 2.4277 |
| United States | 2.0003 |
| Indonesia | 1.0101 |
| Viet Nam | 0.6834 |
| Russian Federation | 0.6631 |
| Thailand | 0.5046 |
| Japan | 0.4405 |
| Pakistan | 0.3325 |
The median is only 0.0078 Mt CO₂e, showing a strongly skewed distribution
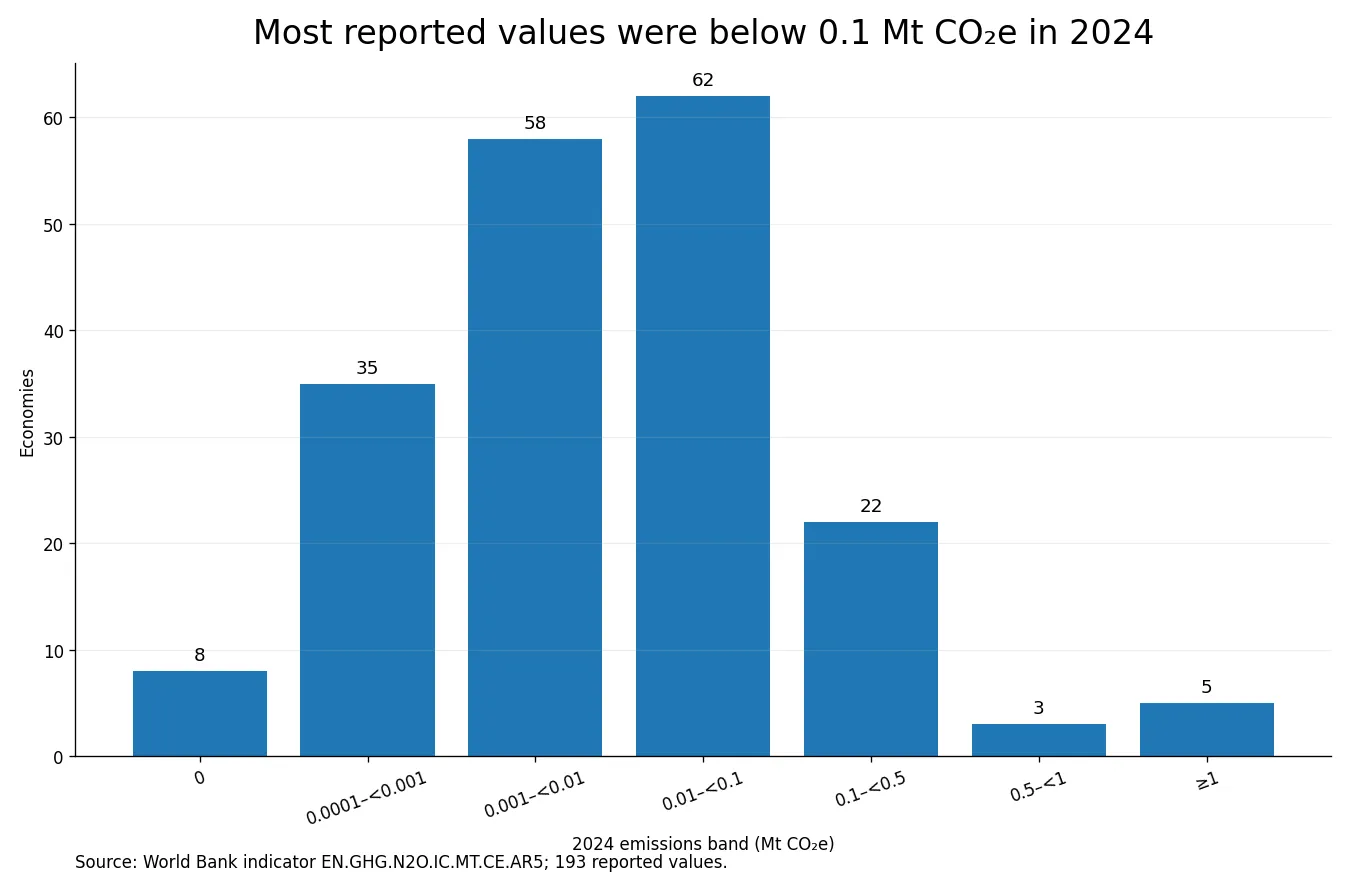
The country ranking has a long upper tail. The median reported value is 0.0078 Mt CO₂e, while the arithmetic mean is much higher at 0.1333 Mt CO₂e. The first quartile is 0.0014 and the third quartile is 0.0418 Mt CO₂e. In other words, three quarters of the reported economies are at or below 0.0418, yet a handful of large values lift the mean far above the median.
A total of 163 of 193 economies (84.5%) report less than 0.1 Mt CO₂e. Eight observations are exactly 0.0000 at the precision supplied in the dataset; 38 are above zero but below 0.001; 56 are from 0.001 to below 0.01; and 61 are from 0.01 to below 0.1. Only 30 observations reach 0.1 Mt CO₂e or more, and just five exceed 1 Mt CO₂e.
How to read the map without overstating small differences
The map uses broad magnitude bands because the values span several orders of magnitude. A linear color scale would make most countries look nearly identical once the largest observations set the upper end of the legend. The grouped bands make it easier to distinguish very small reported values from moderate and large ones while keeping zero separate from missing data. Small island states and territories that cannot be drawn clearly as polygons at this world scale are represented by points.
A difference between 0.001 and 0.010 Mt CO₂e is proportionally large, but both values remain small in absolute terms compared with the top of the distribution. Conversely, two countries in the same color band may still have materially different values. For exact comparisons, the numerical table or source series should take priority over the map color. The map is most useful for locating broad geographic patterns and the small set of high-emission outliers.
Industrial combustion is not the same as industrial-process emissions
The wording of the indicator is easy to misread. “Industrial combustion” belongs to the energy-sector side of the emissions inventory: it concerns emissions associated with burning fuels in manufacturing industries and construction. “Industrial processes” is a separate category covering emissions that arise from the production process itself rather than from fuel combustion. A cement, chemical or metal-producing economy can therefore have emissions in both categories, but they are not interchangeable and should not be added or compared casually without checking the underlying inventory structure.
The same caution applies when comparing this indicator with total N₂O emissions. Agriculture is an important source of N₂O in many countries, while transport, power generation, buildings, fugitive emissions and waste are tracked separately in related greenhouse-gas series. A low value here cannot be read as evidence of low national N₂O emissions overall. It says only that the industrial-combustion component reported for 2024 was low.
What Mt CO₂e on an AR5 basis means
The unit is not the physical mass of N₂O released. The indicator converts N₂O into CO₂-equivalent terms so that its climate effect can be expressed on a common scale. The “AR5” label identifies the Global Warming Potential framework associated with the IPCC Fifth Assessment Report used for the conversion. This makes values within the series comparable in climate-impact units, but it should not be described as tonnes of carbon dioxide actually emitted from the combustion source.
“Mt” means one million metric tonnes. Because the reported numbers are already CO₂-equivalent values, multiplying them again by a warming-potential factor would be incorrect. The safest way to quote a country value is therefore to retain the published unit exactly: for example, 0.5 Mt CO₂e of N₂O emissions from industrial combustion.
Absolute emissions are not an efficiency score
Countries with large manufacturing sectors, large populations or substantial industrial energy use can appear near the top even if their factories are relatively efficient per unit of output. The reverse can also be true: a small absolute total may reflect a small industrial base rather than unusually low emissions intensity. This dataset does not normalize for industrial production, energy consumption, GDP or population, so it should not be used by itself to rank countries by environmental efficiency.
For a more complete comparison, absolute emissions can be paired with measures of manufacturing output, industrial energy consumption, energy mix and emissions intensity. Changes over time can also be informative, but the present article intentionally holds the year fixed at 2024. That avoids combining trend questions with a cross-sectional comparison and keeps every number in the main ranking on the same calendar-year basis.
Source, coverage and interpretation limits
The source series is the World Bank World Development Indicators indicator EN.GHG.N2O.IC.MT.CE.AR5. The World Bank page identifies the EDGAR Community GHG Database of the Joint Research Centre of the European Commission, with International Energy Agency input, as the source behind the series. The published series covers 1970–2024 and is released under a CC BY 4.0 license; this comparison uses only the 2024 observations.
The 193-country sum shown above is a descriptive sum of reported values, not a formally complete world total, because 24 master-list economies have no numeric value in the 2024 extract. No missing observation was replaced with zero, and no value was estimated. Rankings and shares therefore describe the available 2024 observations. They are useful for understanding how unevenly this specific source category is distributed, but they should remain within the indicator’s sector, gas, unit and year boundaries.
Frequently Asked Questions
What does this indicator measure?
It measures N₂O emissions from fuel combustion in manufacturing industries and construction within the energy sector, expressed as Mt CO₂e. Other sources such as agriculture, waste, transport and industrial processes are separate categories.
Are all 193 values from 2024?
Yes. All 193 numeric observations used here refer to 2024. Another 24 entries in the non-aggregate master list are source-missing and remain missing rather than being filled with zero.
Does a high value mean a country is less industrially efficient?
Not by itself. These are absolute emissions, so industrial scale and energy use matter. An efficiency comparison would need a denominator such as industrial output or energy consumption.
Related Articles
Green Map creates custom-edited map images using open geographic data sources such as geoBoundaries, Natural Earth, OpenStreetMap, and government open data. These maps are edited visual materials, not raw data files, and are provided for education, documents, presentations, and graphic reference.