World Bank indicator NY.ADJ.DFOR.GN.ZS measures net forest depletion as a share of GNI, but it is not a direct forest-area-loss rate. Net forest depletion is calculated from unit resource rents multiplied by roundwood harvest in excess of natural growth, then expressed relative to gross national income. The latest non-empty file contains 186 observations, and 169 of them are from 2021, making 2021 the main same-year comparison.
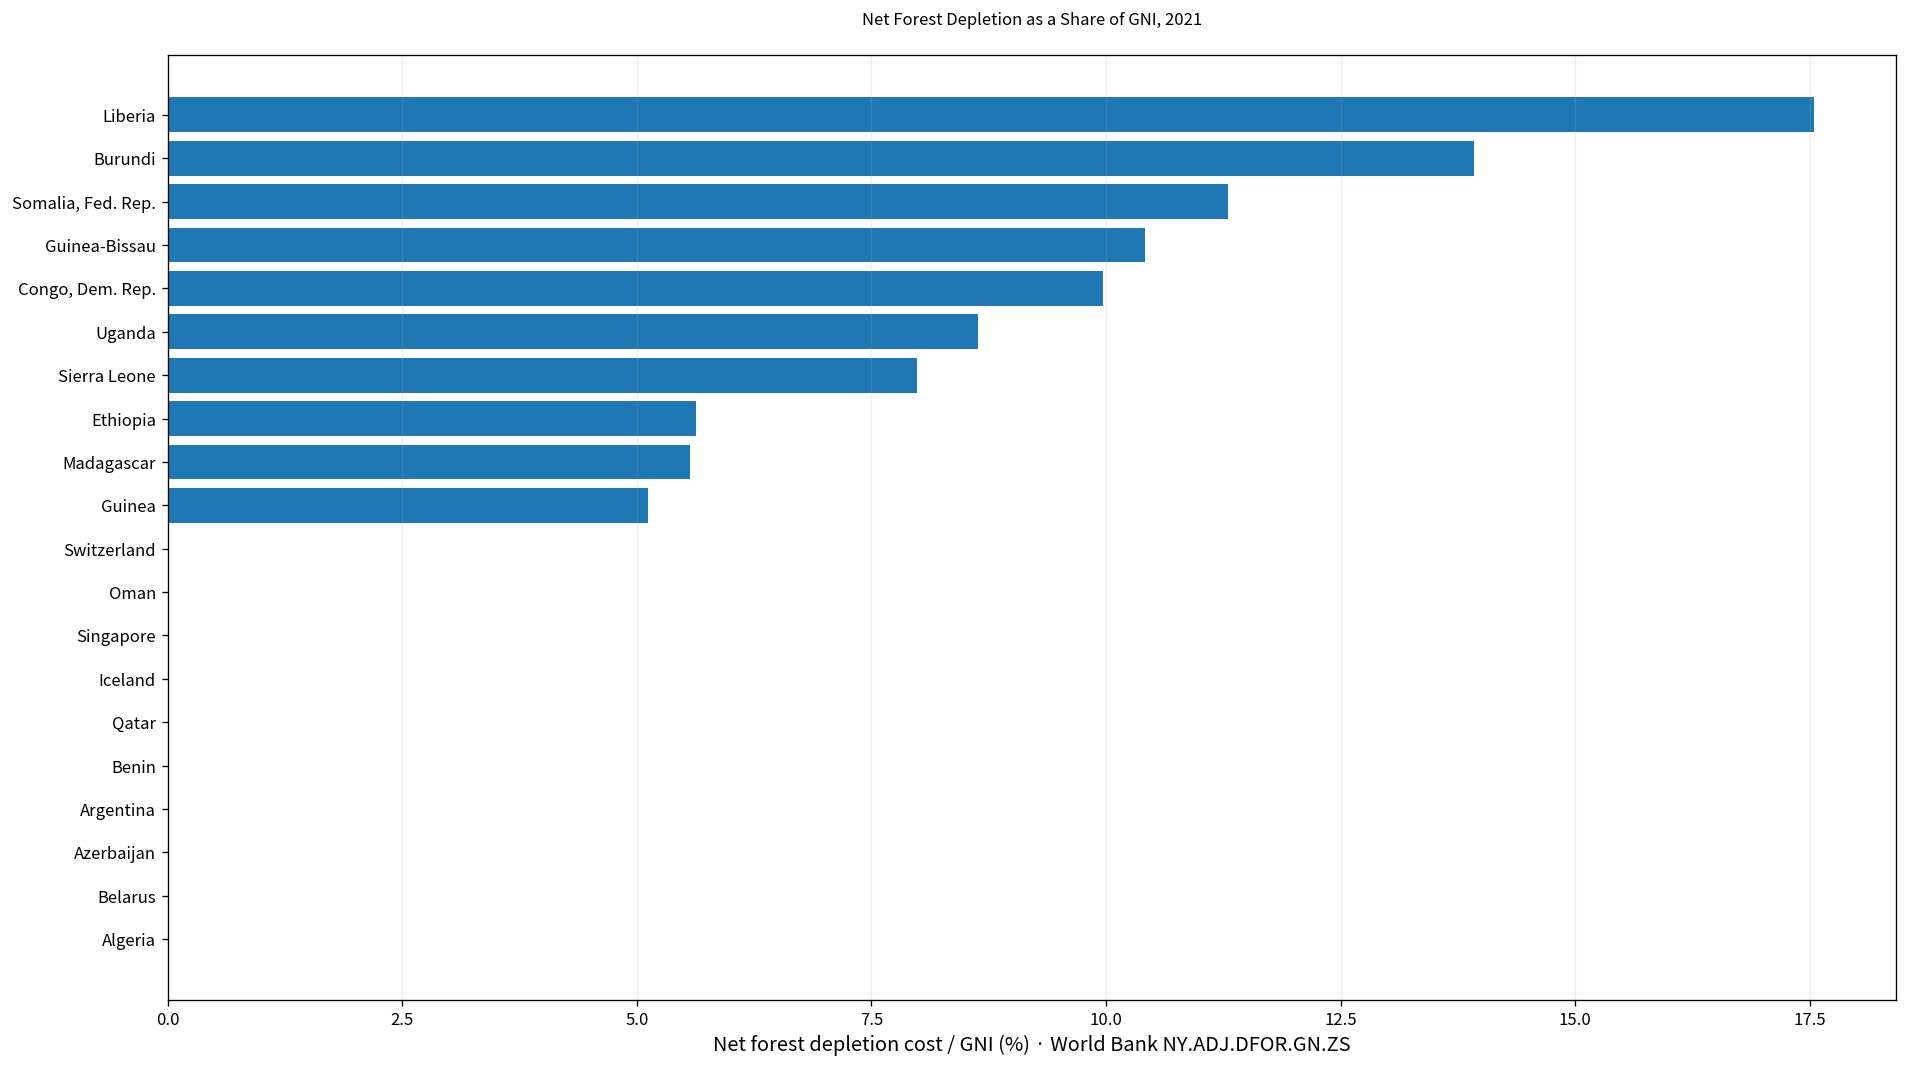
Table of Contents
Net forest depletion is not the percentage of forest area lost
The indicator does not measure annual deforestation area or the percentage decline in forest cover. World Bank documentation defines net forest depletion as the product of unit resource rents and the excess of roundwood harvest over natural growth. The resulting economic depletion value is then divided by GNI.
A value of 5% therefore does not mean that 5% of the country’s forest disappeared. It means the estimated economic value of net forest depletion is equivalent to 5% of GNI. Physical forest-area change requires a separate forest-area or deforestation indicator.
The words ‘adjusted savings’ do not mean this is the adjusted-savings rate
The indicator belongs to the adjusted-savings accounting framework, but it is only the net-forest-depletion component. It is not the country’s overall adjusted net savings rate.
A 4% value should not be paraphrased as ‘adjusted savings equals 4%’. Adjusted savings combines several elements, including resource depletion and other additions or deductions. This series isolates one natural-resource-depletion component.
Most latest observations are from 2021
Of the 186 latest non-empty observations, 169 are dated 2021, or about 90.9%. There are 5 observations from 2020, 4 from 2019, and smaller groups from earlier years.
| Observation year | Economies/territories | Share of 186 |
|---|---|---|
| 2021 | 169 | 90.9% |
| 2020 | 5 | 2.7% |
| 2019 | 4 | 2.2% |
| 2018 | 2 | 1.1% |
| 2015 | 1 | 0.5% |
| 2014 | 1 | 0.5% |
| 2011 | 1 | 0.5% |
| 2000 | 2 | 1.1% |
| 1980 | 1 | 0.5% |
The mixed-year file has a mean of 0.94% and a median of 0.006%. Because the file still spans 1980–2021, the complete 186-row set should not be described as a perfectly synchronized global ranking.
The 2021 mean is 1.01% and the median is 0.01%
The 2021 subset contains 169 economies. Its mean is 1.01% and its median 0.010%. The first quartile is 0.00% and the third quartile 0.49%. The distribution is strongly right-skewed.
36 observations are at least 1%, 27 are at least 2%, 10 are at least 5%, and 4 are at least 10%. At the other end, 105 are below 0.1%. A small number of high values pull the mean far above the median.
Liberia is highest in 2021 at 17.54%
Liberia records 17.54%, followed by Burundi at 13.92%, Somalia, Fed. Rep. at 11.30%, Guinea-Bissau at 10.41%, Congo, Dem. Rep. at 9.97%, Uganda at 8.64%, and Sierra Leone at 7.98%. Ethiopia, Madagascar, and Guinea are also above 5%.
| 2021 rank | Economy/territory | Net forest depletion / GNI |
|---|---|---|
| 1 | Liberia | 17.54% |
| 2 | Burundi | 13.92% |
| 3 | Somalia, Fed. Rep. | 11.30% |
| 4 | Guinea-Bissau | 10.41% |
| 5 | Congo, Dem. Rep. | 9.97% |
| 6 | Uganda | 8.64% |
| 7 | Sierra Leone | 7.98% |
| 8 | Ethiopia | 5.63% |
| 9 | Madagascar | 5.56% |
| 10 | Guinea | 5.12% |
| 11 | Malawi | 4.28% |
| 12 | Chad | 3.96% |
| 13 | Ghana | 3.85% |
| 14 | Rwanda | 3.83% |
| 15 | Lesotho | 3.79% |
| 16 | Gabon | 3.14% |
| 17 | Congo, Rep. | 3.11% |
| 18 | Togo | 2.98% |
| 19 | Gambia, The | 2.93% |
| 20 | Cameroon | 2.64% |
A high value means the estimated economic cost of roundwood depletion beyond natural growth is large relative to national income. It does not by itself identify illegal logging, explain the cause of forest loss, or measure biodiversity damage.
Seventy 2021 observations are exactly zero
Among the 169 observations from 2021, 70 are published as exactly 0%. Examples include Argentina, Azerbaijan, Benin, Burkina Faso, Niger, Nigeria, the Netherlands, Norway, New Zealand, Panama, the Philippines, Poland, Romania, Sudan, Sweden, and Thailand.
These zeros are source values, not missing observations filled with zero. However, a zero should not be expanded into ‘no logging’, ‘no deforestation’, or ‘no forest damage’. It only means the measured net-depletion value under this indicator’s calculation is zero.
Many positive observations are extremely small
The smallest positive 2021 values include Qatar at 0.00007%, Iceland at 0.00011%, Singapore at 0.00021%, Oman at 0.00145%, Switzerland at 0.00172%, Mauritius at 0.00210%, and Aruba at 0.00213%.
| Low positive order | Economy/territory | Net forest depletion / GNI |
|---|---|---|
| 1 | Qatar | 0.00% |
| 2 | Iceland | 0.00% |
| 3 | Singapore | 0.00% |
| 4 | Oman | 0.00% |
| 5 | Switzerland | 0.00% |
| 6 | Mauritius | 0.00% |
| 7 | Aruba | 0.00% |
| 8 | Turks and Caicos Islands | 0.00% |
| 9 | Iraq | 0.00% |
| 10 | Maldives | 0.00% |
| 11 | Denmark | 0.01% |
| 12 | Luxembourg | 0.01% |
| 13 | Belgium | 0.01% |
| 14 | Greece | 0.01% |
| 15 | Italy | 0.01% |
Very small positive values can visually resemble zero after rounding. Keeping the source precision helps distinguish an actual published zero from a small but positive depletion estimate.
GNI in the denominator matters
Because the indicator divides depletion value by gross national income, the same monetary depletion can produce very different percentages in economies of different income scale. A smaller economy can show a larger ratio even if its absolute depletion cost is lower.
The ranking is therefore a ranking of depletion relative to national income, not of absolute monetary forest depletion. A current-dollar depletion series would be needed to compare monetary scale directly.
The balance between natural growth and roundwood harvest is central
The calculation focuses on harvest in excess of natural growth rather than total timber extraction alone. If natural growth is high enough relative to harvest, measured net depletion can be small even when gross harvest is substantial.
That makes the indicator closer to an economic natural-capital accounting measure than a simple logging-volume statistic. Estimates still depend on underlying information about forest growth, roundwood harvest, and resource rents.
Forest area and economic depletion answer different questions
Forest-area indicators describe physical land cover. Net forest depletion estimates the economic value of depletion in commercially relevant forest resources. The two can move together, but they are not interchangeable.
A broader forest assessment should combine area change, biomass, harvest, regeneration, habitat condition, and biodiversity measures. This indicator is particularly useful for placing forest-resource depletion in the scale of national income.
Complete list of the 186 latest observations
The table below lists the latest non-empty observation for each economy and territory in alphabetical order. Most are from 2021, but older final observations retain their actual year.
| Economy/territory | Observation year | Net forest depletion / GNI |
|---|---|---|
| Afghanistan | 2021 | 0.32% |
| Albania | 2021 | 0.14% |
| Algeria | 2021 | 0.00% |
| Angola | 2021 | 0.74% |
| Argentina | 2021 | 0.00% |
| Armenia | 2021 | 0.28% |
| Aruba | 2021 | 0.00% |
| Australia | 2021 | 0.12% |
| Austria | 2021 | 0.03% |
| Azerbaijan | 2021 | 0.00% |
| Bahamas, The | 2021 | 0.02% |
| Bahrain | 2020 | 0.00% |
| Bangladesh | 2021 | 0.07% |
| Barbados | 2021 | 0.01% |
| Belarus | 2021 | 0.00% |
| Belgium | 2021 | 0.01% |
| Belize | 2021 | 0.25% |
| Benin | 2021 | 0.00% |
| Bhutan | 2021 | 2.55% |
| Bolivia | 2021 | 0.00% |
| Bosnia and Herzegovina | 2021 | 0.00% |
| Botswana | 2021 | 0.31% |
| Brazil | 2021 | 0.00% |
| Brunei Darussalam | 2021 | 0.05% |
| Bulgaria | 2021 | 0.00% |
| Burkina Faso | 2021 | 0.00% |
| Burundi | 2021 | 13.92% |
| Cabo Verde | 2021 | 0.30% |
| Cambodia | 2021 | 0.00% |
| Cameroon | 2021 | 2.64% |
| Canada | 2021 | 0.00% |
| Central African Republic | 2021 | 0.00% |
| Chad | 2021 | 3.96% |
| Chile | 2021 | 0.00% |
| China | 2021 | 0.00% |
| Colombia | 2021 | 0.00% |
| Comoros | 2021 | 1.62% |
| Congo, Dem. Rep. | 2021 | 9.97% |
| Congo, Rep. | 2021 | 3.11% |
| Costa Rica | 2021 | 0.00% |
| Cote d’Ivoire | 2021 | 0.00% |
| Croatia | 2021 | 0.15% |
| Cuba | 2019 | 0.07% |
| Cyprus | 2021 | 0.00% |
| Czechia | 2021 | 0.17% |
| Denmark | 2021 | 0.01% |
| Djibouti | 2021 | 0.28% |
| Dominica | 2021 | 0.03% |
| Dominican Republic | 2021 | 0.03% |
| Ecuador | 2021 | 0.00% |
| Egypt, Arab Rep. | 2021 | 0.11% |
| El Salvador | 2021 | 0.57% |
| Equatorial Guinea | 2021 | 2.59% |
| Eritrea | 2011 | 0.00% |
| Estonia | 2021 | 0.00% |
| Eswatini | 2021 | 2.58% |
| Ethiopia | 2021 | 5.63% |
| Fiji | 2021 | 1.20% |
| Finland | 2021 | 0.00% |
| France | 2021 | 0.02% |
| French Polynesia | 2000 | 0.00% |
| Gabon | 2021 | 3.14% |
| Gambia, The | 2021 | 2.93% |
| Georgia | 2021 | 0.06% |
| Germany | 2021 | 0.00% |
| Ghana | 2021 | 3.85% |
| Greece | 2021 | 0.01% |
| Guatemala | 2021 | 0.00% |
| Guinea | 2021 | 5.12% |
| Guinea-Bissau | 2021 | 10.41% |
| Guyana | 2021 | 2.34% |
| Haiti | 2021 | 0.33% |
| Honduras | 2021 | 0.00% |
| Hong Kong SAR, China | 1980 | 0.00% |
| Hungary | 2021 | 0.00% |
| Iceland | 2021 | 0.00% |
| India | 2021 | 0.16% |
| Indonesia | 2021 | 0.00% |
| Iran, Islamic Rep. | 2021 | 0.00% |
| Iraq | 2021 | 0.00% |
| Ireland | 2021 | 0.00% |
| Israel | 2021 | 0.00% |
| Italy | 2021 | 0.01% |
| Jamaica | 2021 | 0.06% |
| Japan | 2021 | 0.00% |
| Jordan | 2021 | 0.02% |
| Kazakhstan | 2021 | 0.00% |
| Kenya | 2021 | 1.24% |
| Kiribati | 2021 | 0.02% |
| Korea, Rep. | 2021 | 0.00% |
| Kuwait | 2019 | 0.00% |
| Kyrgyz Republic | 2021 | 0.00% |
| Lao PDR | 2021 | 1.59% |
| Latvia | 2021 | 0.00% |
| Lebanon | 2021 | 0.00% |
| Lesotho | 2021 | 3.79% |
| Liberia | 2021 | 17.54% |
| Libya | 2021 | 0.08% |
| Liechtenstein | 2019 | 0.00% |
| Lithuania | 2021 | 0.00% |
| Luxembourg | 2021 | 0.01% |
| Madagascar | 2021 | 5.56% |
| Malawi | 2021 | 4.28% |
| Malaysia | 2021 | 1.75% |
| Maldives | 2021 | 0.00% |
| Mali | 2021 | 2.34% |
| Mauritania | 2021 | 0.65% |
| Mauritius | 2021 | 0.00% |
| Mexico | 2021 | 0.00% |
| Micronesia, Fed. Sts. | 2021 | 0.02% |
| Moldova | 2021 | 0.00% |
| Mongolia | 2021 | 0.00% |
| Montenegro | 2021 | 0.13% |
| Morocco | 2021 | 0.00% |
| Mozambique | 2021 | 0.00% |
| Myanmar | 2021 | 2.23% |
| Namibia | 2021 | 0.88% |
| Nepal | 2021 | 0.49% |
| Netherlands | 2021 | 0.00% |
| New Caledonia | 2000 | 0.02% |
| New Zealand | 2021 | 0.00% |
| Nicaragua | 2021 | 0.00% |
| Niger | 2021 | 0.00% |
| Nigeria | 2021 | 0.00% |
| North Macedonia | 2021 | 0.00% |
| Norway | 2021 | 0.00% |
| Oman | 2021 | 0.00% |
| Pakistan | 2021 | 0.13% |
| Panama | 2021 | 0.00% |
| Papua New Guinea | 2021 | 2.04% |
| Paraguay | 2021 | 1.31% |
| Peru | 2021 | 0.13% |
| Philippines | 2021 | 0.00% |
| Poland | 2021 | 0.00% |
| Portugal | 2021 | 0.09% |
| Qatar | 2021 | 0.00% |
| Romania | 2021 | 0.00% |
| Russian Federation | 2021 | 0.00% |
| Rwanda | 2021 | 3.83% |
| Samoa | 2021 | 0.29% |
| Sao Tome and Principe | 2021 | 1.86% |
| Saudi Arabia | 2020 | 0.00% |
| Senegal | 2021 | 0.00% |
| Serbia | 2021 | 0.00% |
| Seychelles | 2021 | 0.13% |
| Sierra Leone | 2021 | 7.98% |
| Singapore | 2021 | 0.00% |
| Slovak Republic | 2021 | 0.00% |
| Slovenia | 2021 | 0.15% |
| Solomon Islands | 2021 | 0.00% |
| Somalia, Fed. Rep. | 2021 | 11.30% |
| South Africa | 2021 | 0.00% |
| South Sudan | 2015 | 3.02% |
| Spain | 2021 | 0.00% |
| Sri Lanka | 2021 | 0.06% |
| St. Lucia | 2021 | 0.01% |
| St. Vincent and the Grenadines | 2021 | 0.02% |
| Sudan | 2021 | 0.00% |
| Suriname | 2021 | 1.90% |
| Sweden | 2021 | 0.00% |
| Switzerland | 2021 | 0.00% |
| Syrian Arab Republic | 2020 | 0.03% |
| Tajikistan | 2021 | 0.64% |
| Tanzania | 2021 | 0.00% |
| Thailand | 2021 | 0.00% |
| Timor-Leste | 2021 | 0.10% |
| Togo | 2021 | 2.98% |
| Tonga | 2021 | 0.04% |
| Trinidad and Tobago | 2021 | 0.05% |
| Tunisia | 2021 | 0.21% |
| Turkiye | 2020 | 0.00% |
| Turkmenistan | 2019 | 0.00% |
| Turks and Caicos Islands | 2021 | 0.00% |
| Uganda | 2021 | 8.64% |
| Ukraine | 2021 | 0.00% |
| United Arab Emirates | 2020 | 0.00% |
| United Kingdom | 2018 | 0.00% |
| United States | 2021 | 0.00% |
| Uruguay | 2021 | 0.00% |
| Uzbekistan | 2021 | 0.00% |
| Vanuatu | 2021 | 0.52% |
| Venezuela, RB | 2014 | 0.00% |
| Viet Nam | 2021 | 0.00% |
| Yemen, Rep. | 2018 | 0.06% |
| Zambia | 2021 | 0.00% |
| Zimbabwe | 2021 | 1.87% |
How to interpret the comparison
First, this is not a forest-area-loss rate; it is the economic value of harvest beyond natural growth relative to GNI. Second, it is one adjusted-savings component, not the overall adjusted-savings rate. Third, published zeros are valid values but do not prove the absence of every type of forest loss.
Fourth, a ratio to GNI is not the same as an absolute depletion value. Fifth, the latest 186 observations are not perfectly same-year data, although the 169 observations from 2021 dominate the file and provide a strong same-year basis.
Source and calculation
The source is World Bank World Development Indicators NY.ADJ.DFOR.GN.ZS, Adjusted savings: net forest depletion (% of GNI). The 2021 mean, median, quartiles, threshold counts, and rankings are calculated only from the 169 observations dated 2021.
Frequently Asked Questions
Does 5% net forest depletion mean 5% of forest area disappeared?
No. It is the estimated economic value of roundwood harvest exceeding natural growth, expressed as a share of GNI.
What is the 2021 median?
The median across the 169 observations dated 2021 is 0.010%, while the mean is 1.01%.
Does a published 0% mean there was no forest damage?
No. It means the indicator's measured net-depletion value is zero; it does not prove the absence of logging, forest-area change, or ecological loss.
Related Articles
Green Map creates custom-edited map images using open geographic data sources such as geoBoundaries, Natural Earth, OpenStreetMap, and government open data. These maps are edited visual materials, not raw data files, and are provided for education, documents, presentations, and graphic reference.