In 2024, U.S. Energy Information Administration data show 12.98990 million MMBtu of petroleum-liquid fuel consumption assigned to useful thermal output across the 50 states and the District of Columbia. Hawaii recorded 2.62767 million MMBtu, followed by Georgia at 2.11263, Maryland at 1.79115, and Virginia at 1.74154. Together, those four jurisdictions represented 63.7% of the national state-level total.
The distribution is highly uneven. The simple mean across 51 jurisdictions was 0.25470 million MMBtu, while the median was only 0.03679. Eight states reported a value of zero, and 22 jurisdictions were below 0.01 million MMBtu. A national average therefore says relatively little about a typical state; the median and concentration among the largest users are more informative.
EIA defines useful thermal output as thermal energy made available from a combined-heat-and-power system for industrial or commercial processes, heating, cooling, or delivery to other end users, rather than for electricity generation. That definition is crucial. This series is not a general measure of petroleum burned for power generation, nor is it total petroleum consumption within each state.
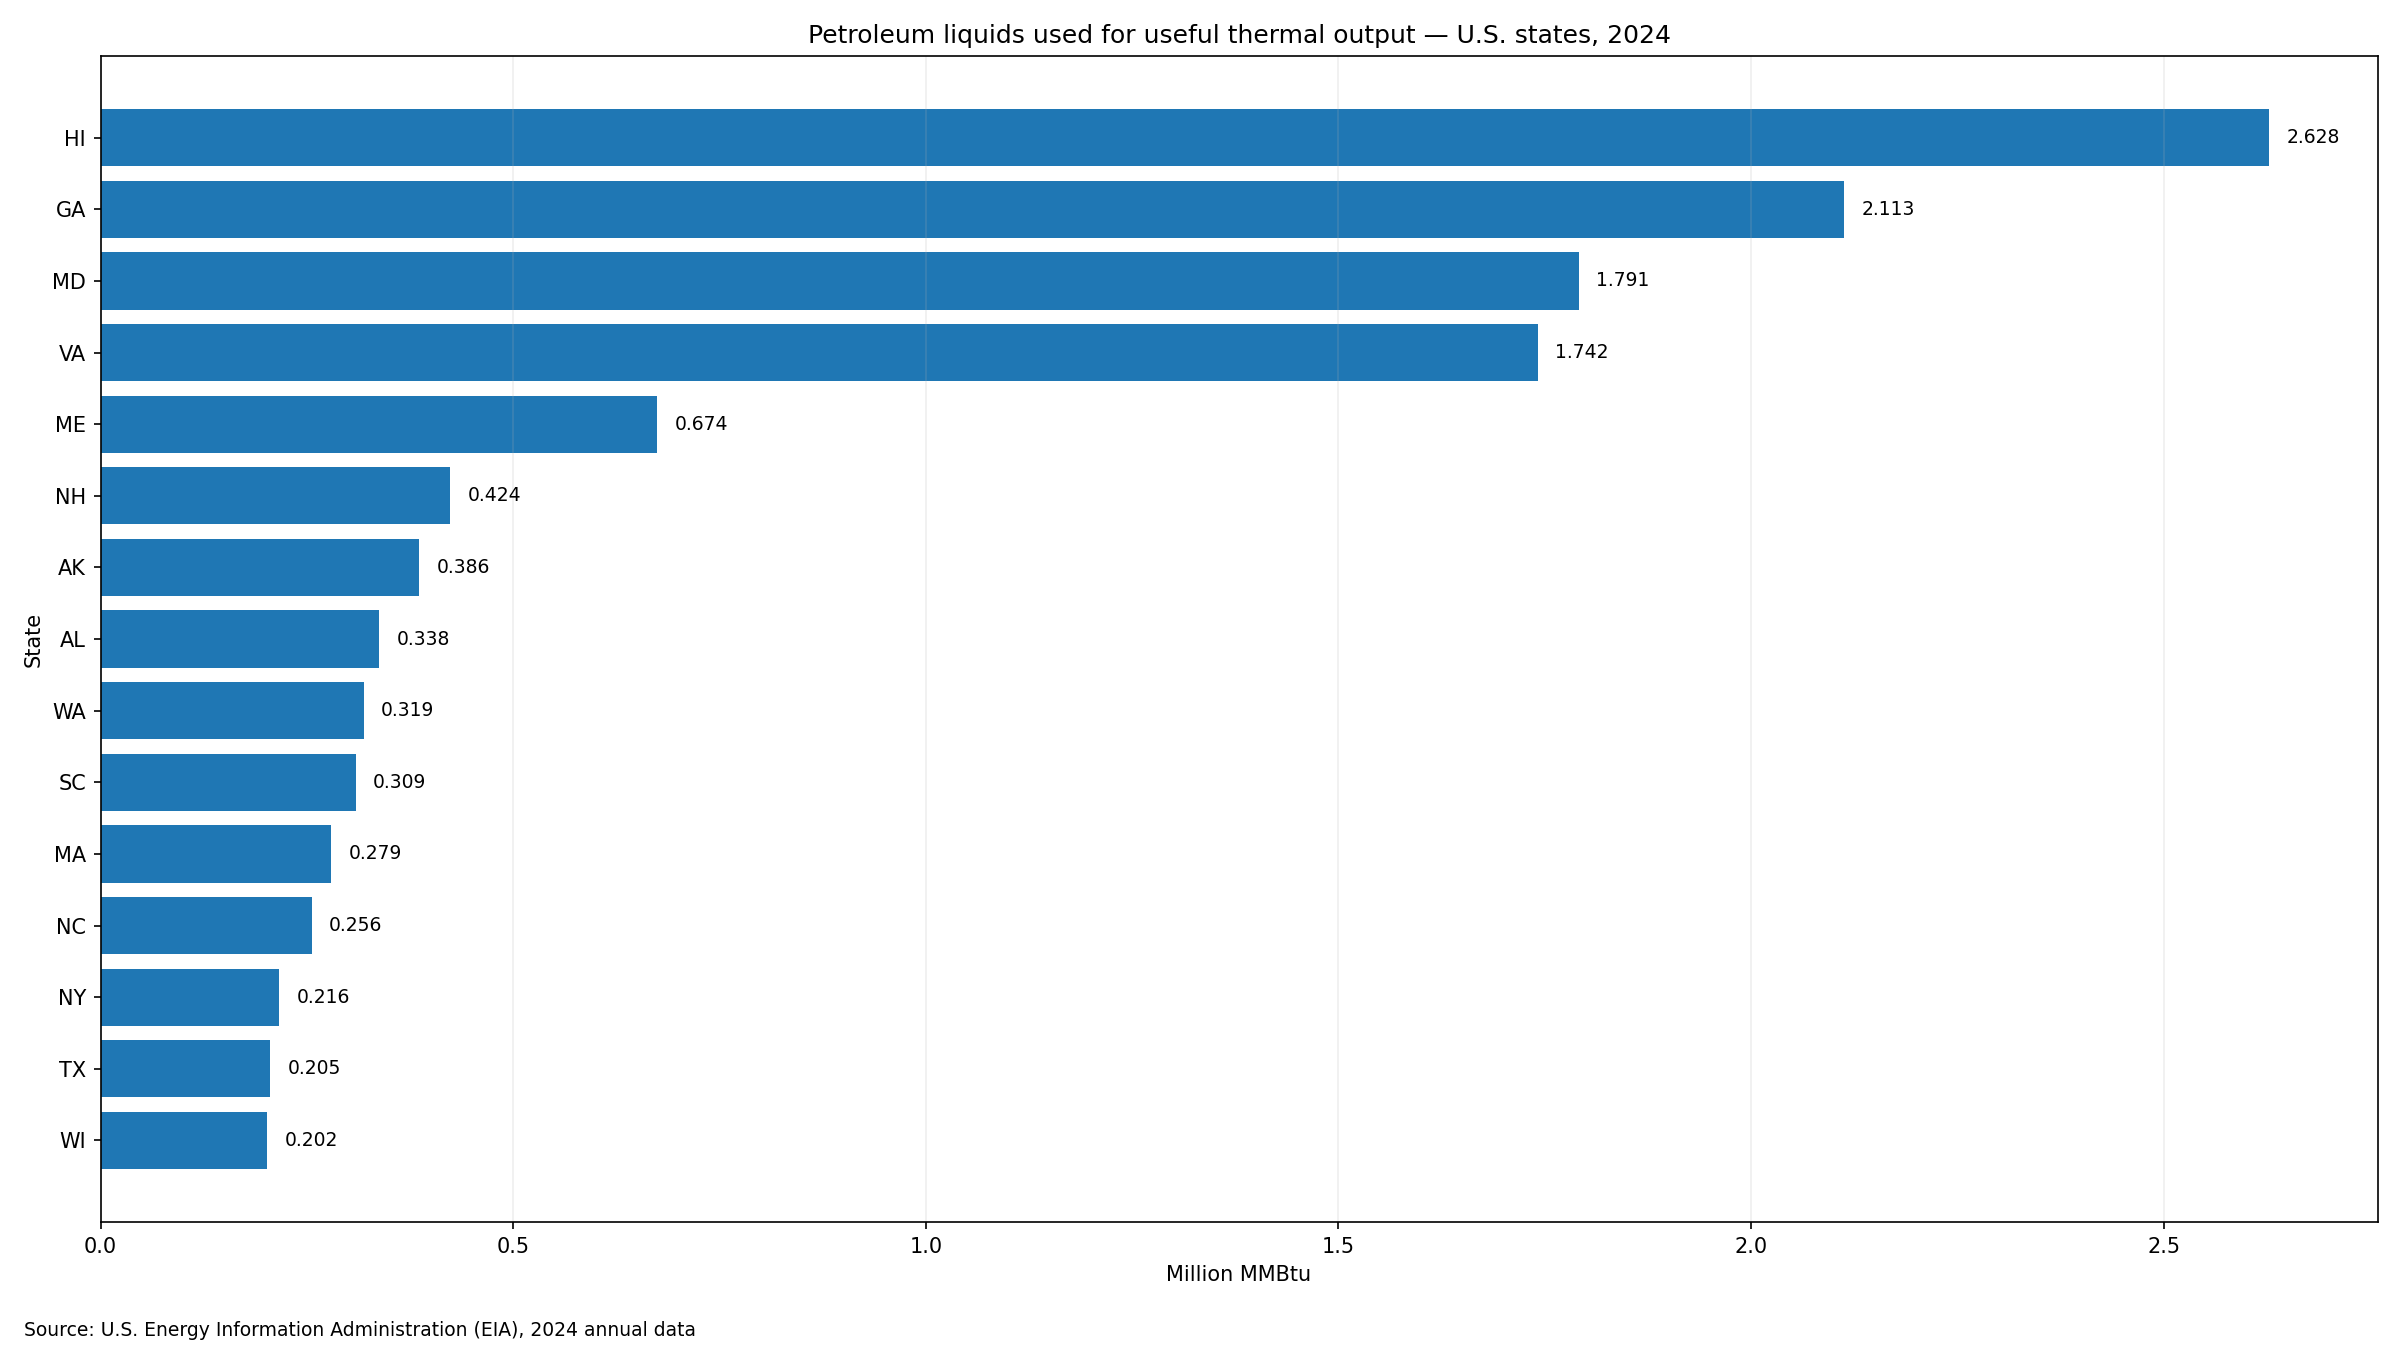
Table of Contents
What the measure captures
The dataset measures the energy content of petroleum liquids consumed for useful thermal output. Because it is reported in million MMBtu, the values are energy quantities rather than barrels. One MMBtu is one million British thermal units, so one million MMBtu equals one trillion Btu. The 51-jurisdiction total of about 12.99 million MMBtu is therefore equivalent to about 12.99 trillion Btu.
Useful thermal output belongs to the combined-heat-and-power context. CHP facilities can use one fuel stream to produce electricity and useful heat. EIA separates fuel associated with electricity generation from fuel associated with useful thermal output. The latter can support industrial process heat, building heat, cooling applications, or other thermal uses. A high state value therefore indicates substantial petroleum-liquid use on the thermal side of CHP activity, not necessarily a large petroleum share of the state’s electricity mix.
Hawaii, Georgia, Maryland, and Virginia formed the leading group
Hawaii alone accounted for about 20.2% of the 51-jurisdiction total. Georgia contributed about 16.3%, Maryland 13.8%, and Virginia 13.4%. Their combined 8.27299 million MMBtu made up 63.7% of the total.
The drop after the top four is notable. Maine ranked fifth at 0.67423 million MMBtu, far below Virginia’s 1.74154. The top five jurisdictions accounted for 68.9% of the total, and the top ten for 82.5%. This concentration means national totals are shaped strongly by a small number of state-level CHP fuel-use patterns.
| Rank | State | Code | Million MMBtu |
|---|---|---|---|
| 1 | Hawaii | HI | 2.62767 |
| 2 | Georgia | GA | 2.11263 |
| 3 | Maryland | MD | 1.79115 |
| 4 | Virginia | VA | 1.74154 |
| 5 | Maine | ME | 0.67423 |
| 6 | New Hampshire | NH | 0.42369 |
| 7 | Alaska | AK | 0.38584 |
| 8 | Alabama | AL | 0.33790 |
| 9 | Washington | WA | 0.31893 |
| 10 | South Carolina | SC | 0.30903 |
| 11 | Massachusetts | MA | 0.27937 |
| 12 | North Carolina | NC | 0.25608 |
| 13 | New York | NY | 0.21618 |
| 14 | Texas | TX | 0.20532 |
| 15 | Wisconsin | WI | 0.20199 |
A low median reveals the long lower tail
The first quartile was 0.00012 million MMBtu and the third quartile 0.21075. Half of the jurisdictions lie between those values, but even that middle range spans several orders of magnitude. Only 19 jurisdictions reached at least 0.1 million MMBtu, while 22 were below 0.01 million MMBtu.
The eight zero observations are recorded data values, not missing data that have been replaced with zero. That distinction matters for maps and rankings. A state with a reported zero belongs in the comparison as a measured observation, whereas a genuinely unavailable value should be shown as no data. Here, all 51 jurisdictions have a numeric observation for 2024.
What state differences do not prove
A large value does not by itself imply poor energy efficiency, high costs, or weak environmental performance. Useful thermal output is tied to the presence, scale, fuel choice, and operating level of CHP facilities. Industrial structure can also matter because process-heat demand varies substantially across activities. The state-level series does not isolate those causes, so it should not be used to assign a single explanation to the ranking.
Population size is also an unreliable shortcut. Texas ranked 14th at 0.20532 million MMBtu and California was much lower at 0.05084, while smaller jurisdictions such as Hawaii, Maryland, and Maine ranked near the top. The contrast is consistent with a facility-based energy measure rather than household or general consumer petroleum use.
Why this is different from petroleum used to generate electricity
EIA publishes separate tables for petroleum liquids consumed for useful thermal output and for petroleum liquids consumed for electricity generation plus useful thermal output. The categories answer different questions. A researcher looking for fuel burned to produce electricity should use the electricity-generation series, while this dataset is specifically about the thermal-output portion.
This separation also explains why comparisons with state electricity generation, petroleum-fired generation shares, or retail fuel sales can be misleading. Those statistics use different numerators, denominators, and system boundaries. The safest comparison is with another EIA useful-thermal-output series that uses the same year, fuel definition, sector coverage, and unit.
Source and calculation notes
The underlying observations come from the U.S. Energy Information Administration’s Electric Power Operational Data for 2024, using the petroleum-liquids fuel category and the consumption-for-useful-thermal-output measure. Coverage includes all 50 states plus the District of Columbia. Rankings, shares, quartiles, mean, and median in this analysis are calculated directly from those 51 observations.
As a cross-check, EIA’s Electric Power Annual reports about 12,990 billion Btu of petroleum liquids consumed for useful thermal output in 2024. That is equivalent to about 12.99 trillion Btu, which matches the 12.9899 million MMBtu sum of the state-level values after unit conversion. Small last-digit differences can arise from published rounding.
Absolute volume is not the same as energy dependence
These values are absolute fuel-energy quantities, not percentages of each state’s energy system. A state with 0.2 million MMBtu may still have only a small petroleum role if its CHP system relies mainly on natural gas, biomass, or another fuel. To evaluate dependence or fuel mix, the petroleum figure should be compared with total useful thermal output or parallel EIA fuel series using the same scope and year.
The concentration figures describe distribution, not causation. The fact that the top four jurisdictions supplied 63.7% of the total shows that petroleum-liquid use for useful heat was geographically concentrated, but it does not explain why. Plant configuration, industrial heat demand, operating schedules, and availability of substitute fuels would require additional facility or sector data.
Frequently Asked Questions
Which state had the highest petroleum-liquid consumption for useful thermal output in 2024?
Hawaii ranked first at 2.62767 million MMBtu, followed by Georgia, Maryland, and Virginia.
Is useful thermal output the same as petroleum used to generate electricity?
No. EIA defines useful thermal output as heat made available from CHP systems for processes, heating, cooling, or other end uses rather than electrical generation.
Do the eight zero values represent missing data?
No. All 51 jurisdictions have numeric 2024 observations; the eight zeros are reported values rather than missing observations filled with zero.
Related Articles
Green Map creates custom-edited map images using open geographic data sources such as geoBoundaries, Natural Earth, OpenStreetMap, and government open data. These maps are edited visual materials, not raw data files, and are provided for education, documents, presentations, and graphic reference.