UNESCO Institute for Statistics data for 2023 show a wide range of adjusted gender parity index values for outbound tertiary mobility to sub-Saharan Africa. The indicator does not count international students directly. It compares the female and male values of the mobile outbound gross enrolment ratio for tertiary students whose destination is sub-Saharan Africa. Among the 161 countries and territories with reported observations, 6 fell within the usual 0.97–1.03 parity band, 89 were below 0.97, and 66 were above 1.03.
The destination restriction is essential. A country can have one gender pattern for students going to sub-Saharan Africa and a different pattern for students going to Europe, North America, Asia, or all destinations combined. The GPIA in this dataset therefore should not be described as a country’s overall international-student gender ratio. It is a destination-specific comparison of outbound tertiary mobility rates.
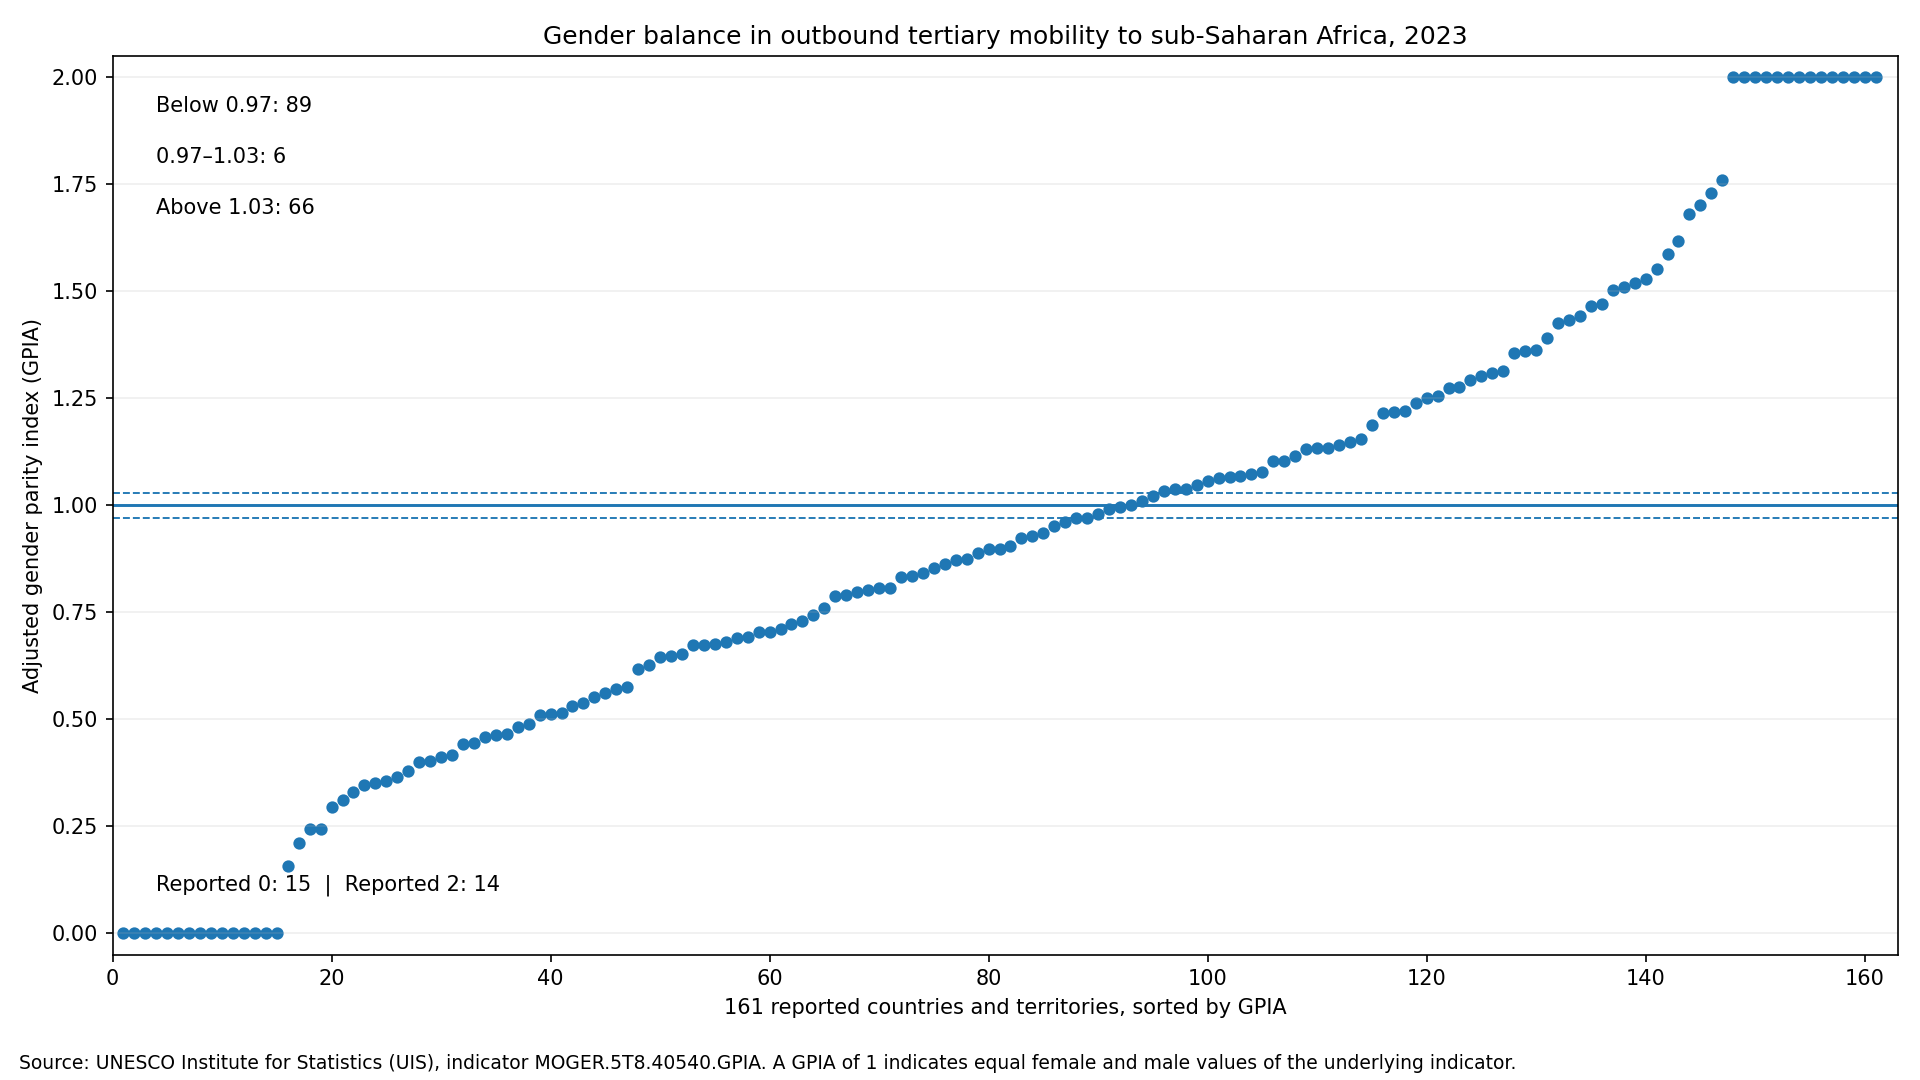
Table of Contents
How the adjusted gender parity index works
A conventional gender parity index divides the female value of an indicator by the male value. That ratio is easy to calculate but is not symmetrical around 1: a female value that is half the male value produces 0.5, while a female value twice the male value produces 2. The UIS adjusted gender parity index transforms ratios above 1 so that disparities on the two sides of the equality point can be compared on a symmetric 0-to-2 scale.
For this indicator, 1 means that female and male values of the underlying outbound mobility ratio are equal. A value below 1 means the female rate is lower than the male rate, while a value above 1 means the female rate is higher. UIS commonly treats 0.97 to 1.03 as a parity range that allows for small differences. The measure is descriptive: it does not establish that a higher outbound mobility rate is inherently better or worse.
Only six reported observations were inside the parity band
The median GPIA across the 161 observations was 0.89866, and the arithmetic mean was 0.92037. The first quartile was 0.51508 and the third quartile 1.25657. Those summary statistics show that much of the distribution sits away from 1, but the center of the distribution should not be mistaken for a global benchmark. The dataset represents one destination region and only the countries and territories with a reported value.
Ireland at 1.00032 and Egypt at 0.99608 were especially close to the equality point. Cambodia at 1.01059, the Cayman Islands at 0.97944, and Spain at 1.02155 were also inside the 0.97–1.03 band. Lebanon at 0.96959 sat just below the band, while Tunisia at 1.03356 sat just above it. These near-boundary cases are a reminder that the numerical distance from 1 matters more than treating a threshold as a sharp substantive divide.
| Country or territory | Code | GPIA | Reading |
|---|---|---|---|
| Ireland | IRL | 1.00032 | very close to 1 |
| Egypt | EGY | 0.99608 | within parity band |
| Cambodia | KHM | 1.01059 | within parity band |
| Cayman Islands | CYM | 0.97944 | within parity band |
| Spain | ESP | 1.02155 | within parity band |
| Lebanon | LBN | 0.96959 | just below parity band |
| Tunisia | TUN | 1.03356 | just above parity band |
| Serbia | SRB | 1.76069 | female-side rate higher |
| Nepal | NPL | 0.15839 | male-side rate higher |
Values of 0 and 2 are the endpoints of the adjusted scale
The source reported exactly 0 for 15 observations and exactly 2 for 14 observations. These are official numeric values in the dataset, not missing entries that were filled with endpoint values. Because GPIA is bounded between 0 and 2, those numbers represent the two ends of the adjusted scale. They signal a very large difference in the underlying female and male indicator values, but the published GPIA alone does not provide the original sex-specific rates.
Examples at 0 include Andorra, Antigua and Barbuda, Brunei Darussalam, Bolivia, and the Dominican Republic. Examples at 2 include Albania, Armenia, Azerbaijan, Bahrain, and Georgia. These should not be labeled the worst and best performers. The index is about balance, so the central reference is 1. An endpoint shows a strong directional disparity, not a ranking of educational quality or an assessment of whether international mobility is desirable.
Destination-specific mobility can look very different from total mobility
Outbound tertiary mobility reflects a network of destinations rather than one universal route. Historical ties, language, regional proximity, scholarship programs, institutional partnerships, tuition, visa rules, and program availability may all be associated with where students go. This dataset does not measure those mechanisms, however, so it cannot establish why a particular country’s gender pattern points above or below 1.
The same caution applies to country size. GPIA is a ratio-based measure, not a count. A small flow can produce a large gender difference if the female and male rates are far apart, while a much larger flow can produce a value near 1 if the two rates are similar. Any question about how many students actually study in sub-Saharan Africa requires a student-count series or the underlying sex-specific mobility rates.
Distance from 1 is more informative than a conventional ranking
The mean of 0.92037 and median of 0.89866 summarize the sample, but the adjusted index was designed to be interpreted around the parity point. A value of 0.8 and a value of 1.2 are positioned on opposite sides of 1 at the same adjusted distance. That makes absolute distance from 1 a more useful comparison than simply ordering countries from the smallest value to the largest.
A wider 0.9–1.1 interval contained 24 observations. That broader interval is not the UIS parity definition, but it helps distinguish cases that are relatively near the center from the endpoint-heavy parts of the distribution. The formal 0.97–1.03 band remains the appropriate reference when describing parity according to the UIS convention.
Reported coverage is not the same as universal coverage
All 161 rows in the working 2023 dataset have numeric values, so there are no missing values inside the reported set. That does not mean every country or territory in the UIS catalogue reported this indicator. The source metadata identifies additional national units without a reported observation. An unreported unit must therefore remain no data; assigning it a zero would create a gender disparity that the source did not report.
Using one common year also does not eliminate every comparability issue. National statistical systems can differ in reporting coverage and in the availability of the sex-disaggregated information needed to construct the index. GPIA standardizes the mathematical comparison between the two groups, but it does not erase differences in the underlying data systems.
What this indicator can and cannot tell us
The index can show whether the female and male outbound mobility rates to sub-Saharan Africa were similar, which direction the difference took, and how far each observation was from the parity point. It can also show whether disparities are broadly clustered near 1 or concentrated toward the endpoints. Those are useful descriptive questions for comparing destination-specific international education patterns.
It cannot tell us whether students completed their programs, found employment, received scholarships, or had similar academic outcomes. It also cannot tell us whether access to international education was high in absolute terms. Female and male rates can both be very low and still generate a GPIA close to 1. Gender parity and the overall level of opportunity are separate dimensions that require separate indicators.
Source and calculation notes
The source is the UNESCO Institute for Statistics 2023 indicator MOGER.5T8.40540.GPIA. The comparison uses all 161 reported national observations in the source extract. The mean, median, quartiles, and parity-band counts were calculated from those published values without imputing missing national units. The UNESCO UIS data endpoint provides the indicator series.
UIS defines the adjusted parity index as a symmetric transformation around 1 with a 0-to-2 range. The analysis therefore treats 1 as the equality reference, values below 1 as a lower female underlying rate, and values above 1 as a higher female underlying rate. It avoids converting those directional differences into claims about educational quality or personal outcomes.
Frequently Asked Questions
What does a GPIA value of 1 mean?
It means the female and male values of the underlying outbound tertiary mobility indicator are equal. UIS commonly uses 0.97–1.03 as the parity band.
Does a GPIA above 1 mean there are more female international students?
Not necessarily. This index compares female and male outbound mobility rates to sub-Saharan Africa; it is not a direct count of students.
Are reported zero values the same as missing data?
No. Zero is an official numeric observation in this dataset. National units without a reported observation must remain no data rather than being replaced with zero.
Related Articles
Green Map creates custom-edited map images using open geographic data sources such as geoBoundaries, Natural Earth, OpenStreetMap, and government open data. These maps are edited visual materials, not raw data files, and are provided for education, documents, presentations, and graphic reference.