Ramsey County is a compact, heavily urbanized county in eastern Minnesota, stretching from St. Paul and the Mississippi River in the south to Shoreview, North Oaks, and White Bear Lake in the north. St. Paul occupies the broad southern center of the county, while Roseville and Little Canada sit immediately to the north and Maplewood extends along the eastern side. Farther north, the map becomes more lake-filled around Arden Hills, Shoreview, Vadnais Heights, and White Bear Lake. That contrast between a dense southern city core and a northern lake district gives Ramsey County a distinctive shape.
This page combines a county overview, a ranked six-city distribution map, a terrain-and-water map, and an elevation map. The original high-resolution JPG files for all four views are available in the download package, so you can use a simple city reference, a water-focused view, or a relief map depending on what you need to show. The maps are designed for geographic orientation rather than parcel research, engineering measurements, or live navigation.
Table of Contents
St. Paul forms the southern anchor while suburbs extend toward White Bear Lake
On the county overview, St. Paul is the largest labeled urban area and occupies much of the southern part of Ramsey County. Falcon Heights and Roseville lie directly to its north, while Little Canada sits farther northeast. Continuing north brings Arden Hills and Shoreview into view, with New Brighton and Mounds View near the western edge. The arrangement makes the county look less like a single rectangular block and more like a narrow urban corridor that changes character as it moves away from St. Paul.
The eastern side is dominated by Maplewood, which stretches along a large section of the county boundary. North St. Paul appears within the eastern urban belt, and Vadnais Heights and White Bear Lake continue the pattern toward the northeast. Thick orange road corridors cross the county from several directions and connect these municipalities, but the map is not intended to provide turn-by-turn routing or current traffic conditions. Its strength is showing how the major communities, county edge, roads, and selected water features relate to one another.
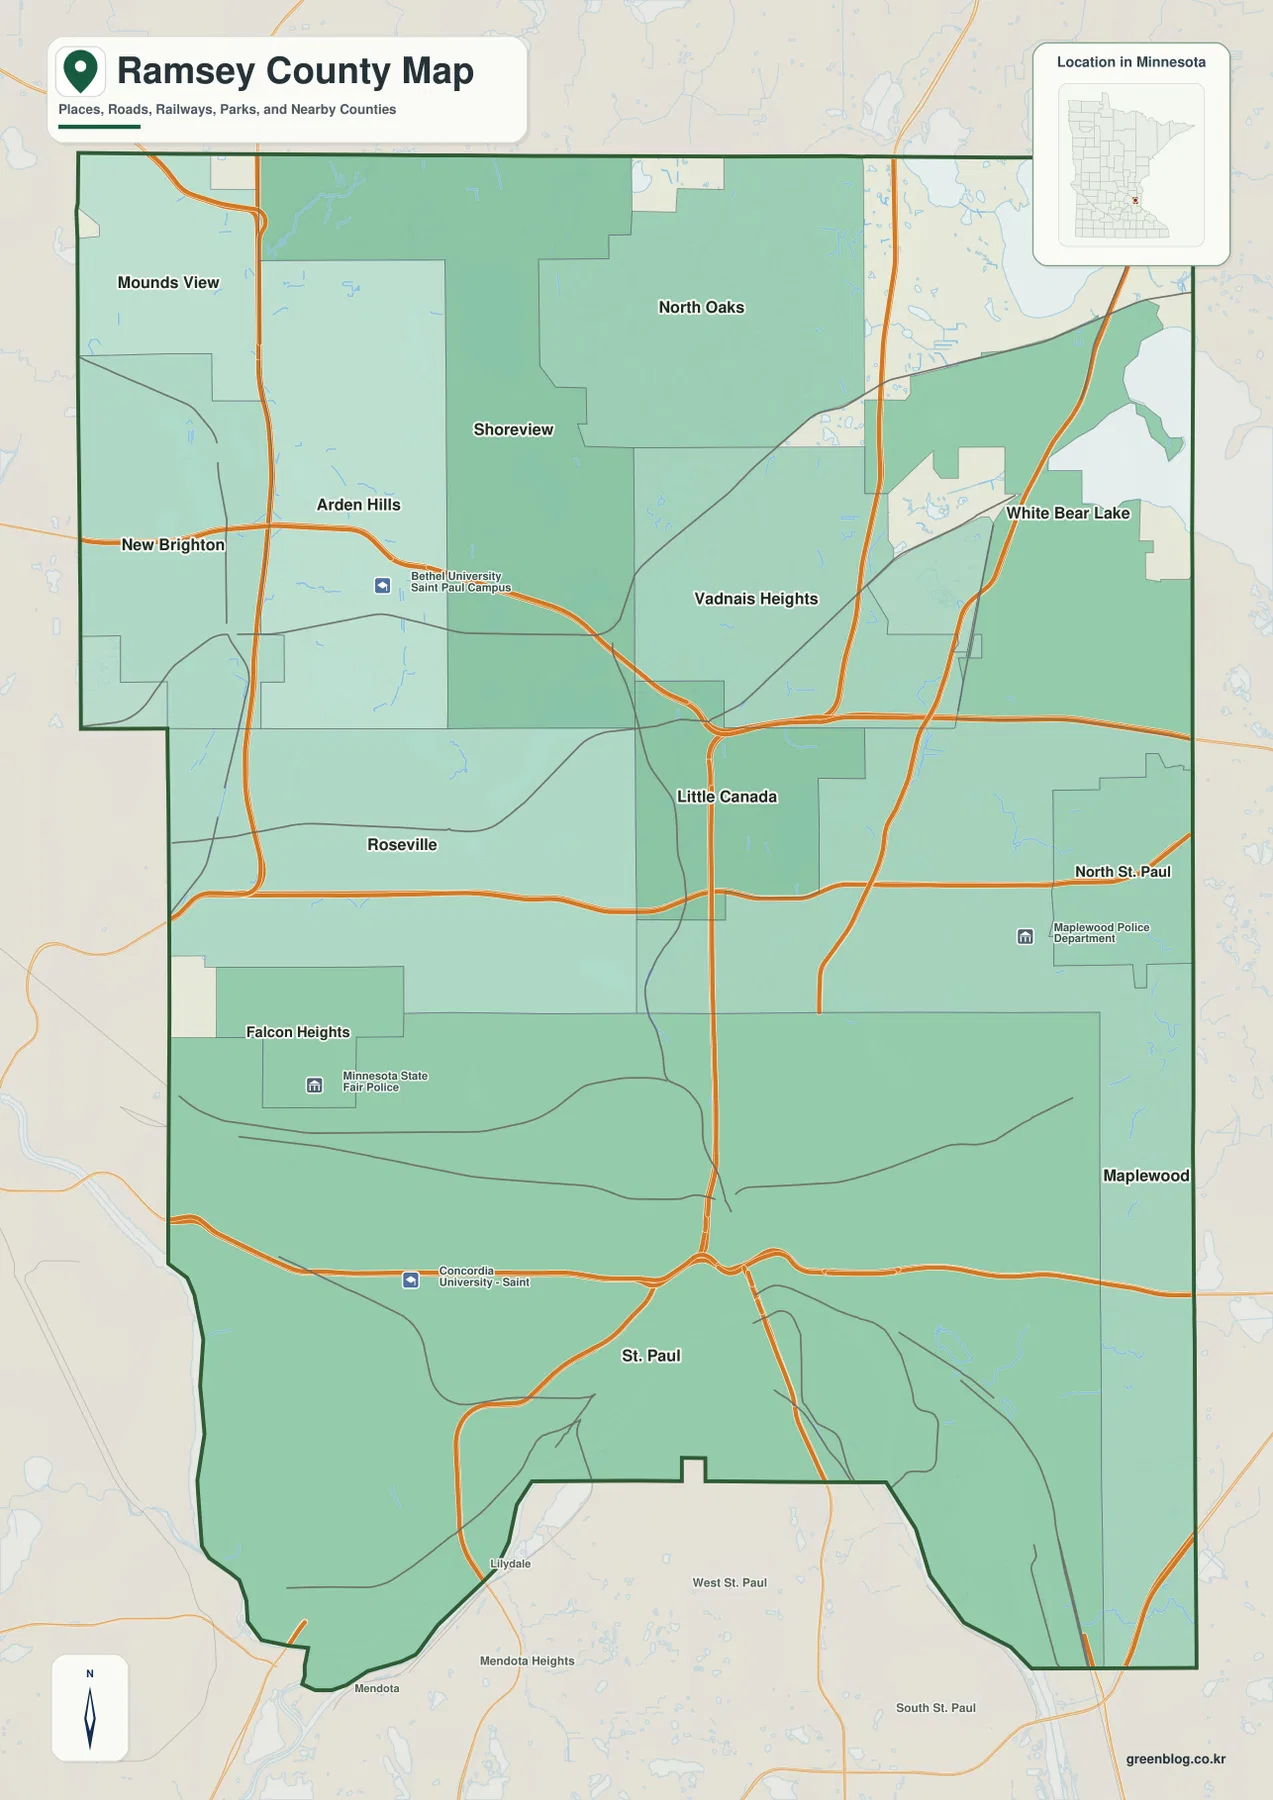
A second pattern appears as you move north. Lakes and open areas become more frequent around Shoreview, North Oaks, Vadnais Heights, and White Bear Lake, while the southern St. Paul–Maplewood area reads as a more continuous urban fabric. That difference is visible even before switching to the water map. The county overview therefore works well for understanding not only where the municipalities are, but also how the southern urban core transitions into a more lake-oriented northern landscape.
The overview is also useful for relative location. Roseville is immediately north of St. Paul, Shoreview is farther north near a dense group of lakes, and Maplewood occupies a broad eastern position. New Brighton and Mounds View sit closer to the western boundary, while White Bear Lake is pushed toward the northeast. Seeing those relationships on one page is more useful for orientation than memorizing a list of city names without context.
The six-city index separates the St. Paul core from the northern suburban group
The ranked city distribution map simplifies Ramsey County to six selected cities. The displayed values are St. Paul 307,284, Maplewood 40,695, Roseville 35,802, Shoreview 26,714, White Bear Lake 23,908, and New Brighton 22,710. These should be treated as the values printed by the map’s city index rather than as measurements between places. The layer contains no straight-line or driving-distance connectors, so its purpose is to compare the location and relative prominence of the selected cities.
St. Paul is positioned in the southern center and clearly dominates the ranking. Maplewood appears on the east side, Roseville just north of St. Paul, Shoreview in the northern interior, White Bear Lake near the northeast, and New Brighton toward the northwest. The six markers spread across most of the county, yet the largest index value is concentrated at the southern end. This produces a simple visual summary of Ramsey County: one major southern center with a ring of substantial suburban communities to the north and east.
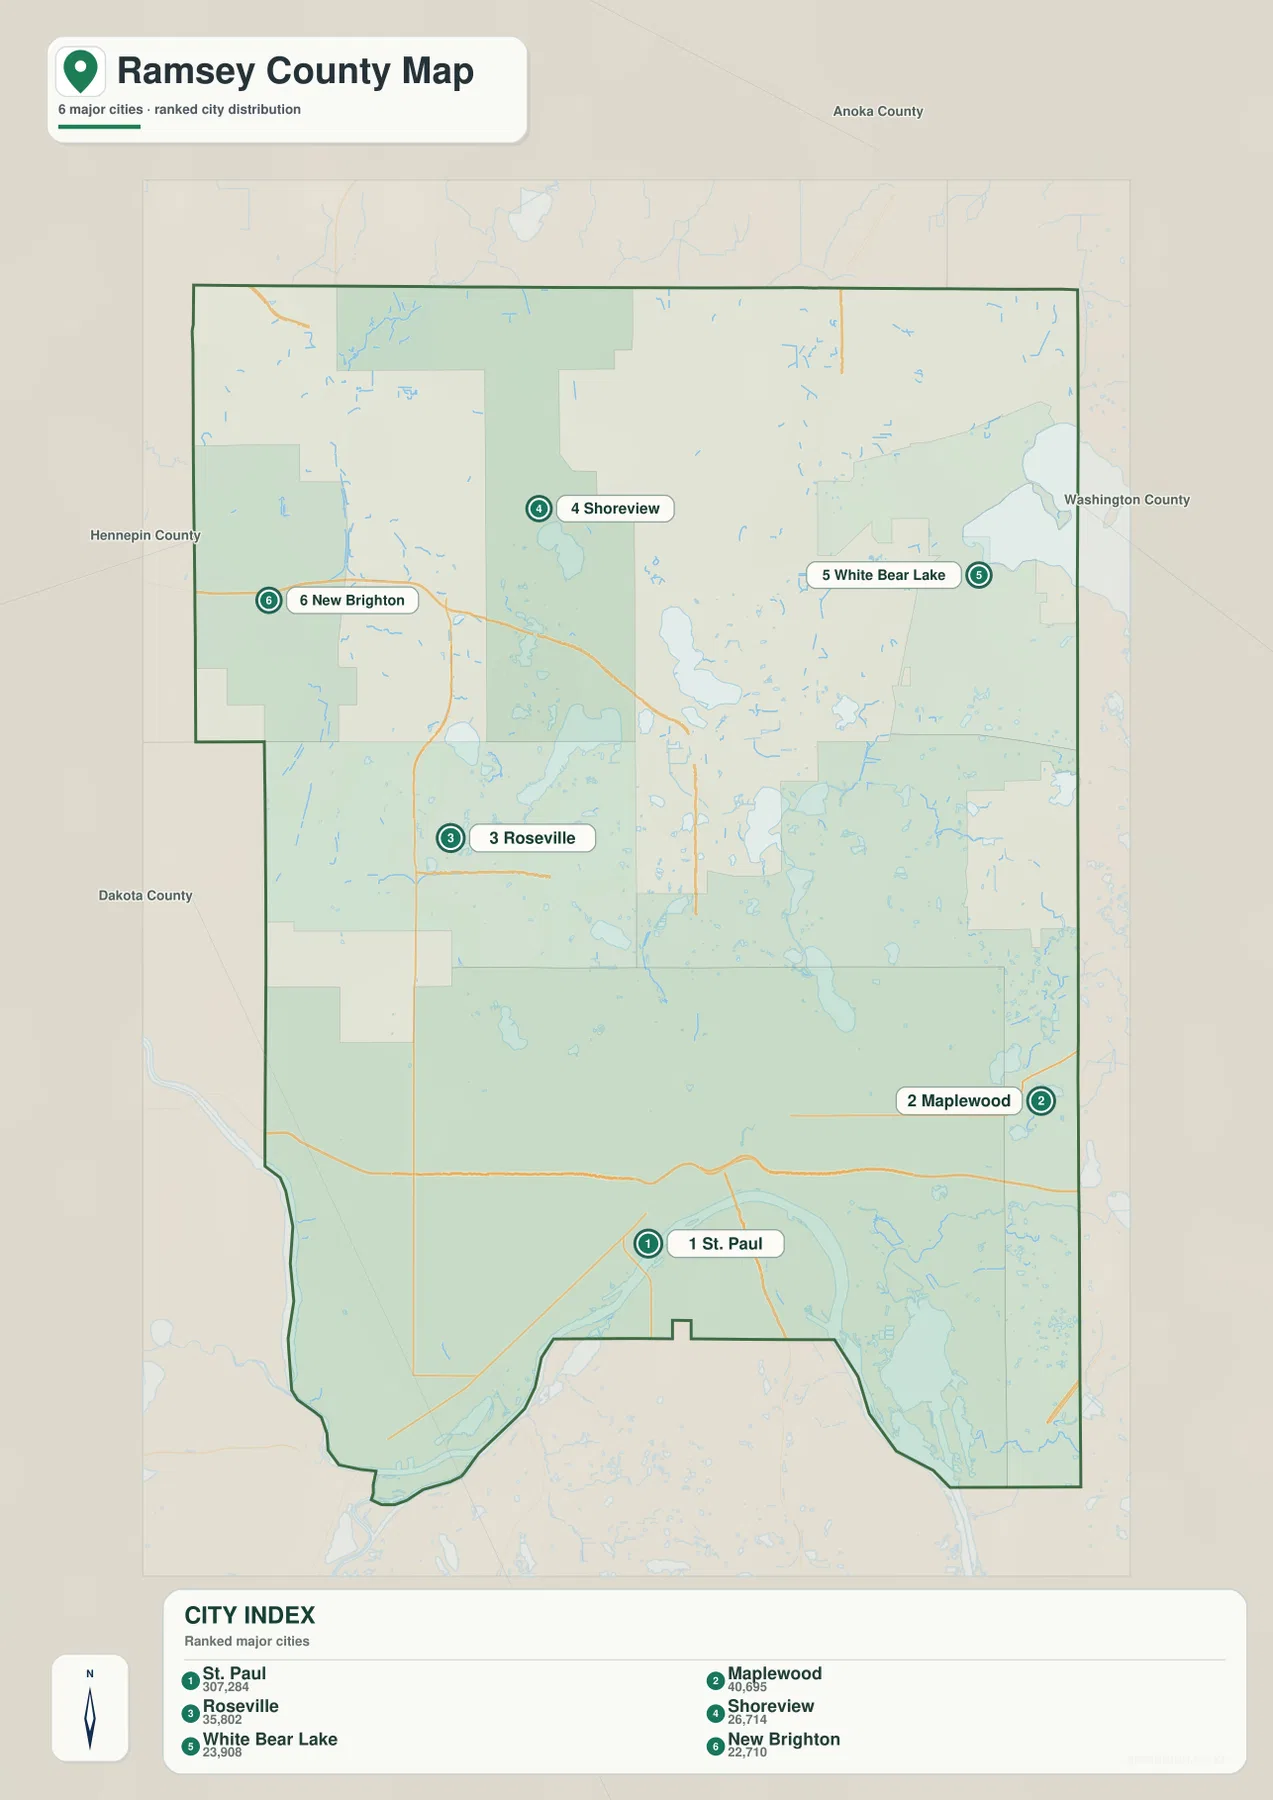
Comparing the city layer with the overview also shows what has been intentionally left out. Arden Hills, Vadnais Heights, Little Canada, Falcon Heights, North St. Paul, and other places appear on the general map but are not among the six highlighted cities. The ranked layer is therefore not a complete municipal inventory. It is a cleaner comparison tool, while the overview remains better when you need more place names and road context.
Because there are no distance lines on the city map, it should not be used to estimate travel from St. Paul to White Bear Lake or between any other pair of communities. Road distance, straight-line distance, and travel time are different measures and can change depending on the route. For this page, the city map is best read as a location-and-ranking graphic, with current navigation and demographic details left to dedicated official sources.
The Mississippi River lowland contrasts with a chain of northern lakes
The terrain-and-water map changes the emphasis completely. The Mississippi River is the dominant southern feature, bending along the lower edge of Ramsey County and forming a broad low corridor beside St. Paul. Pigs Eye Lake and Battle Creek appear in the southeast near the river system. This large river setting is easy to miss on a road-focused city map, but it becomes a defining geographic feature when water and terrain are given priority.
Northern Ramsey County is organized around a very different water pattern. White Bear Lake and Bald Eagle Lake stand out in the northeast, with Otter Lake nearby. Turtle Lake and Pleasant Lake occupy the north-central area, while Vadnais Lake and Lake Owasso sit farther south. Lake Johanna is visible in the west-central section and Gervais Lake lies closer to the middle-east. Rather than one continuous river corridor, the north contains many separate lake basins woven between suburban communities.
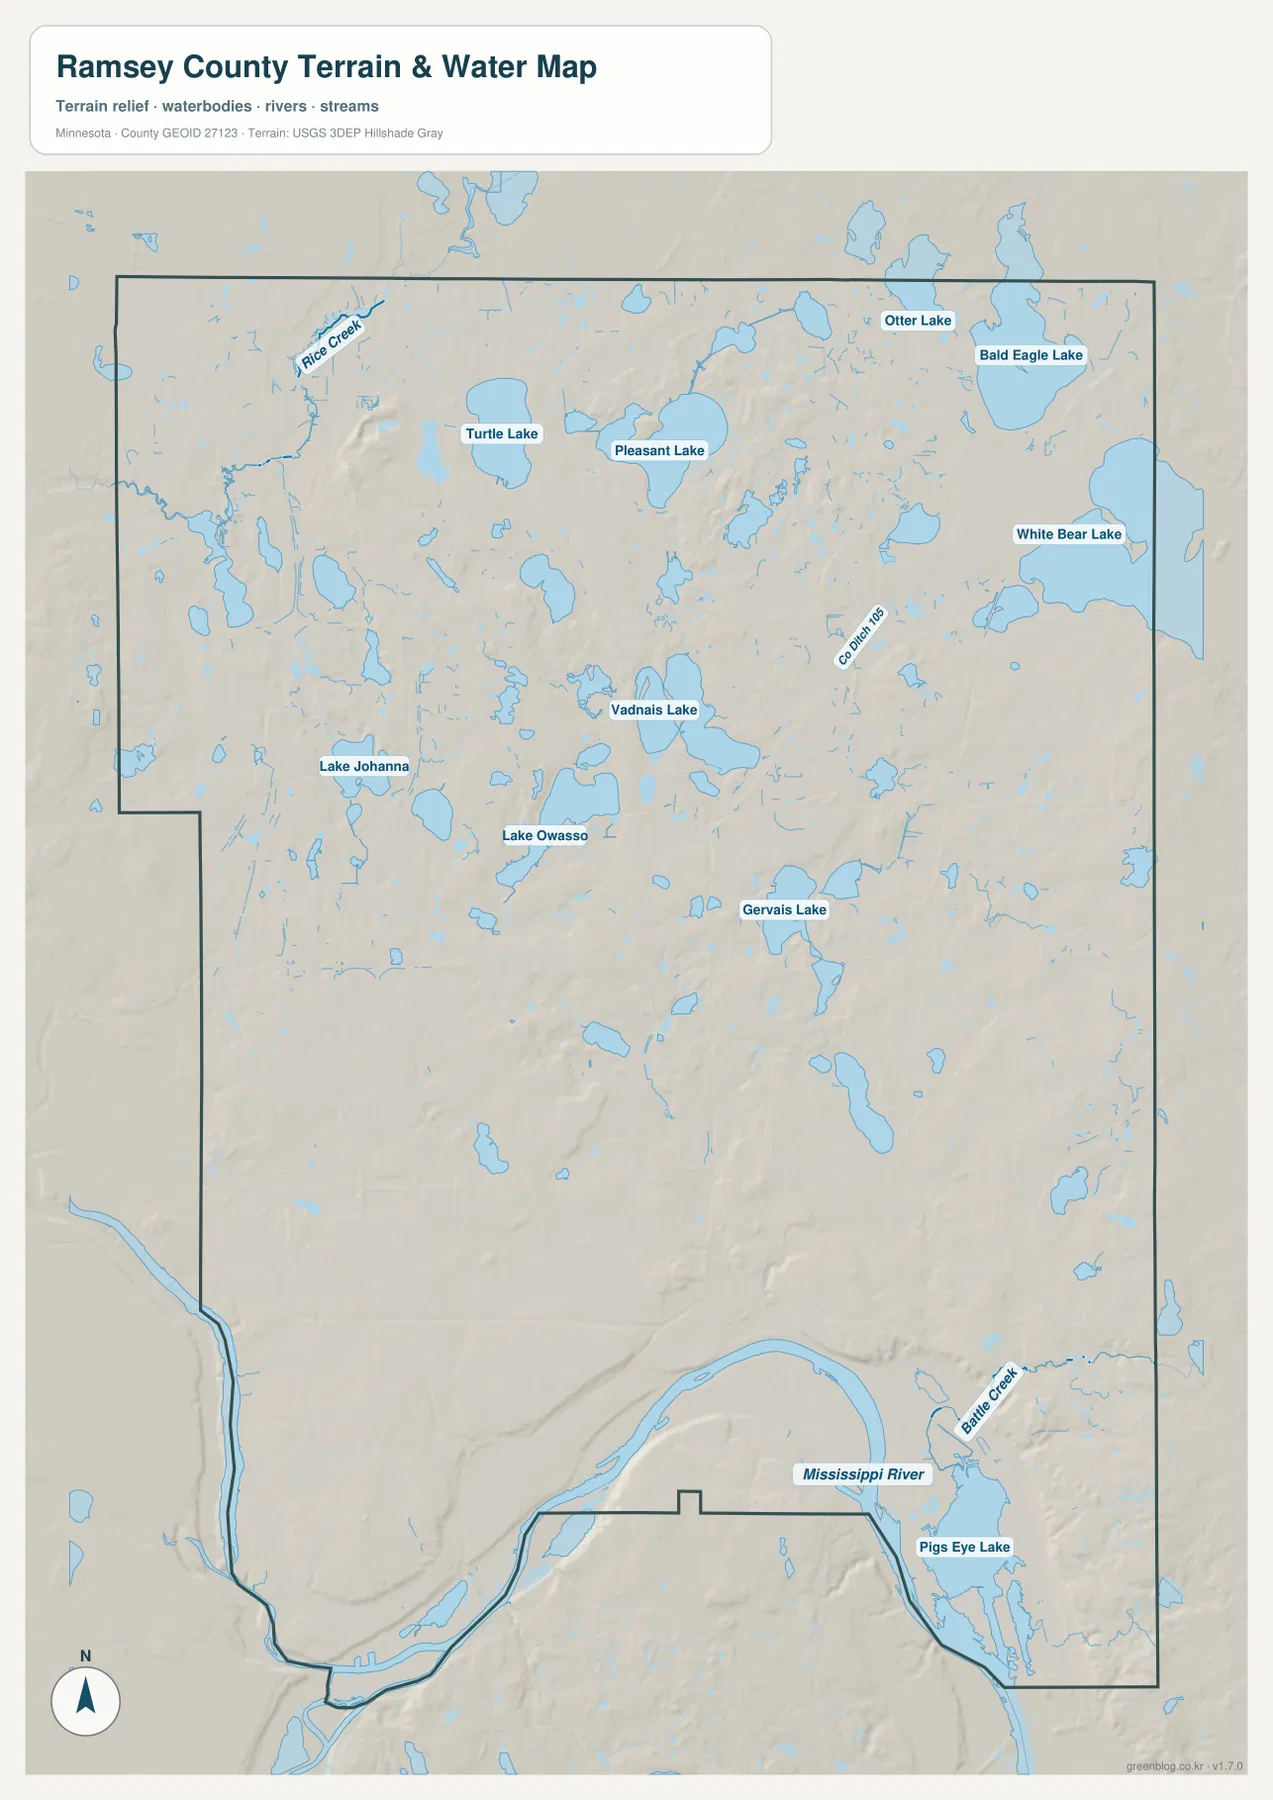
Smaller drainage features add another level of detail. Rice Creek appears in the northwest and runs through the northern landscape, while Battle Creek reaches the Mississippi system in the southeast. A feature labeled Co Ditch 105 is also visible in the central-eastern area. These lines help show where water moves across the county, but they should not be interpreted as flood boundaries, depth information, legal access routes, or navigation guidance.
The south-to-north contrast is one of the most useful ideas in the whole map set. The southern edge is shaped by a large river valley, whereas the northern half contains many individual lakes nested among rolling ground. That difference also helps explain why the northern suburbs look more broken up by water and open space on the general map. The terrain-and-water layer turns that visual impression into a clearer geographic pattern.
Low ground follows the Mississippi while higher ridges rise east and northwest
The elevation map shows a local range of about 211 to 332 meters, with a mean near 275 meters. The lowest green terrain is concentrated along the Mississippi River across the southern edge of the county. Low corridors also extend inland along drainage paths, especially where streams and lakes occupy shallow depressions. This river lowland creates the strongest elevation contrast on the map and provides a useful reference for reading the rest of Ramsey County.
Higher tan and brown terrain is more prominent on the eastern and northeastern side, with another strong upland area in the northwest. The north-central lake district contains a mix of basins and short ridges rather than one uniform surface. Ramsey County therefore does not simply climb steadily from south to north. Instead, the Mississippi lowland is bordered by a more irregular landscape of rolling uplands, lake basins, and drainage corridors.
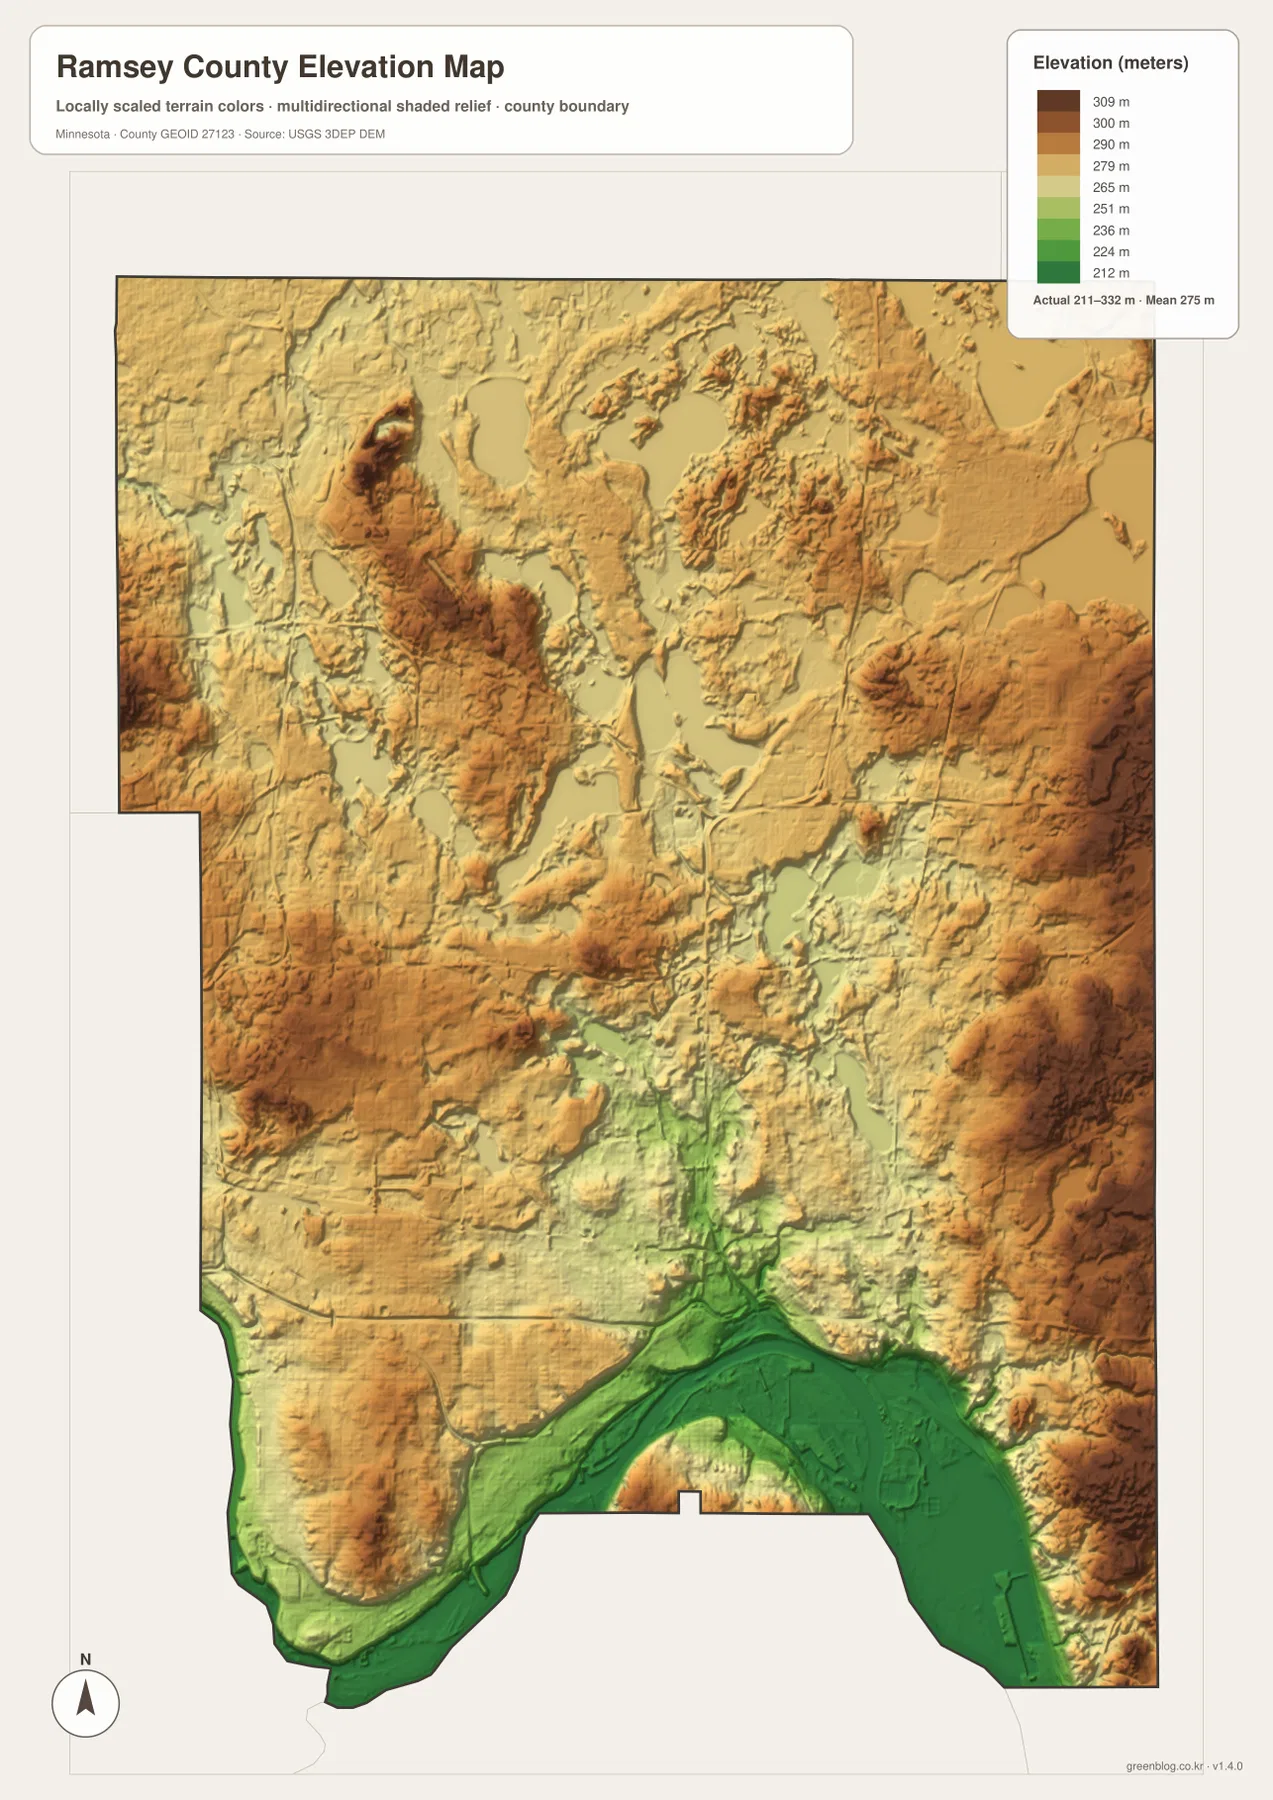
When the water and elevation maps are read together, many features make more sense. Battle Creek and the Mississippi occupy lower ground in the south and southeast. Vadnais Lake, Lake Owasso, and Gervais Lake sit within depressions between higher terrain, while White Bear Lake and Bald Eagle Lake are surrounded by a more varied northeastern surface. The relationship is broad rather than survey-precise, but it gives the lakes and streams a clear topographic setting.
The elevation colors should not be used as engineering or survey measurements. A generalized surface cannot establish the exact elevation of a road, building site, levee, or property corner. It is much better suited to questions such as where the river valley is lowest, which parts of the county rise higher, and how the northern lake basins fit into the surrounding relief.
Following the same place across all four maps reveals more than one layer alone
St. Paul is the clearest example. The overview presents it as the county’s large southern city and shows Roseville, Falcon Heights, and Maplewood nearby. The ranked city map gives it the highest displayed index value by a wide margin. On the water map, the Mississippi River defines the city’s southern geographic setting, and the elevation layer shows that river corridor as the lowest broad terrain in the county. The four views add location, urban scale, water, and relief to the same reference point.
White Bear Lake works differently. The general map places the city near the northeastern edge, the ranked city view includes it among the six highlighted communities, and the water layer makes the lake itself part of a larger northern cluster with Bald Eagle Lake and Otter Lake. The elevation map then shows that these basins sit within rolling higher terrain rather than within the broad southern river lowland. The same name therefore connects an urban place with a water body and a distinct topographic setting.
Roseville and Shoreview offer another useful comparison. Roseville lies immediately north of St. Paul within a largely continuous urban area. Shoreview is farther north, where lakes and open spaces interrupt the built-up pattern more frequently. The county map establishes that relationship, and the water and relief layers explain why the northern setting appears more fragmented. Looking at one place across several maps is often more informative than reading each map as an isolated graphic.
Which Ramsey County map is most useful for your task?
Start with the county overview when you need boundaries, major communities, and the broad road network on one page. It is the easiest choice for explaining where St. Paul, Roseville, Maplewood, Shoreview, New Brighton, or White Bear Lake sits within Ramsey County. The ranked city map is better for a clean comparison of the six highlighted cities when the full set of roads and smaller places would add unnecessary visual detail.
Choose the terrain-and-water map when rivers, creeks, and lakes are the subject. It gives the Mississippi River, Rice Creek, Battle Creek, White Bear Lake, Bald Eagle Lake, Vadnais Lake, Lake Owasso, and other water bodies much more emphasis. Use the elevation map when the question is about landform, because the low southern river corridor and the higher eastern and northwestern terrain stand out immediately through color and shaded relief.
The downloadable JPGs preserve more detail than the smaller WebP previews used in the article. Each original map is 3638 by 2572 pixels, making the files more suitable for print or large presentation slides. They remain general-reference maps, however. Parcel boundaries, legal determinations, flood risk, survey elevations, and live travel conditions should be checked against the appropriate current official source rather than inferred from these simplified graphics.
Frequently Asked Questions
How does St. Paul relate to the Mississippi River on these maps?
St. Paul occupies the southern center of Ramsey County, while the Mississippi River bends along the county’s southern edge. The terrain-and-water map also places Pigs Eye Lake and Battle Creek near this river setting. On the elevation map, the same corridor is shown in the lowest green terrain, so the city can be understood in relation to both the river and the broader lowland.
Which map is best for the White Bear Lake area?
Use the county overview when you want the city, nearby roads, and neighboring municipalities together. Use the terrain-and-water layer when the lake itself is the main subject, because White Bear Lake appears with Bald Eagle Lake, Otter Lake, and the rest of the northern lake system. The elevation layer adds context by showing the surrounding rolling terrain and lake basins.
Do the city index numbers show distance between the six cities?
No. The numbers are the values displayed for the selected cities in the ranked city layer. The map does not draw straight-line distance connectors or provide driving distance and travel time. Use a current navigation or transportation source when you need actual distance between St. Paul, Maplewood, Roseville, Shoreview, White Bear Lake, or New Brighton.
Map File Information
The ZIP contains the four original high-resolution JPG maps described on this page. They are larger than the on-page previews and are useful for print, classroom material, presentations, or other work that needs a clearer image.
- Included Files: Use only the versions confirmed in the article and supplied images
- File Type: Use the confirmed download contents
- Intended Use: Printing, education, presentations, and map-based projects
Related Maps
Sources and reference links
The county-specific discussion above is based on the supplied map set and the official references below. These sources are appropriate starting points when you need more detailed county administration, boundary, hydrography, or elevation information.
- Ramsey County official website — official county government and local service information
- U.S. Census Bureau TIGER/Line Shapefiles — official geographic boundary data
- USGS National Hydrography — national rivers, streams, and waterbody data
- USGS 3D Elevation Program — national elevation data and 3DEP documentation
Green Map creates custom-edited map images using open geographic data sources such as geoBoundaries, Natural Earth, OpenStreetMap, and government open data. These maps are edited visual materials, not raw data files, and are provided for education, documents, presentations, and graphic reference.