The World Bank’s ‘Other manufacturing’ share of manufacturing value added varies widely across economies, but the data need to be read with unusual care. Indicator NV.MNF.OTHR.ZS.UN supplies one latest non-empty observation for each of 164 countries and territories. The median across those latest observations is 38.83%, the simple mean is 38.85%, the highest value is Ireland at 98.37% in 2023, and the lowest is the Syrian Arab Republic at -6.24% in 2005. These are not all observations from 2024, so the dataset is not a synchronized 2024 world ranking.
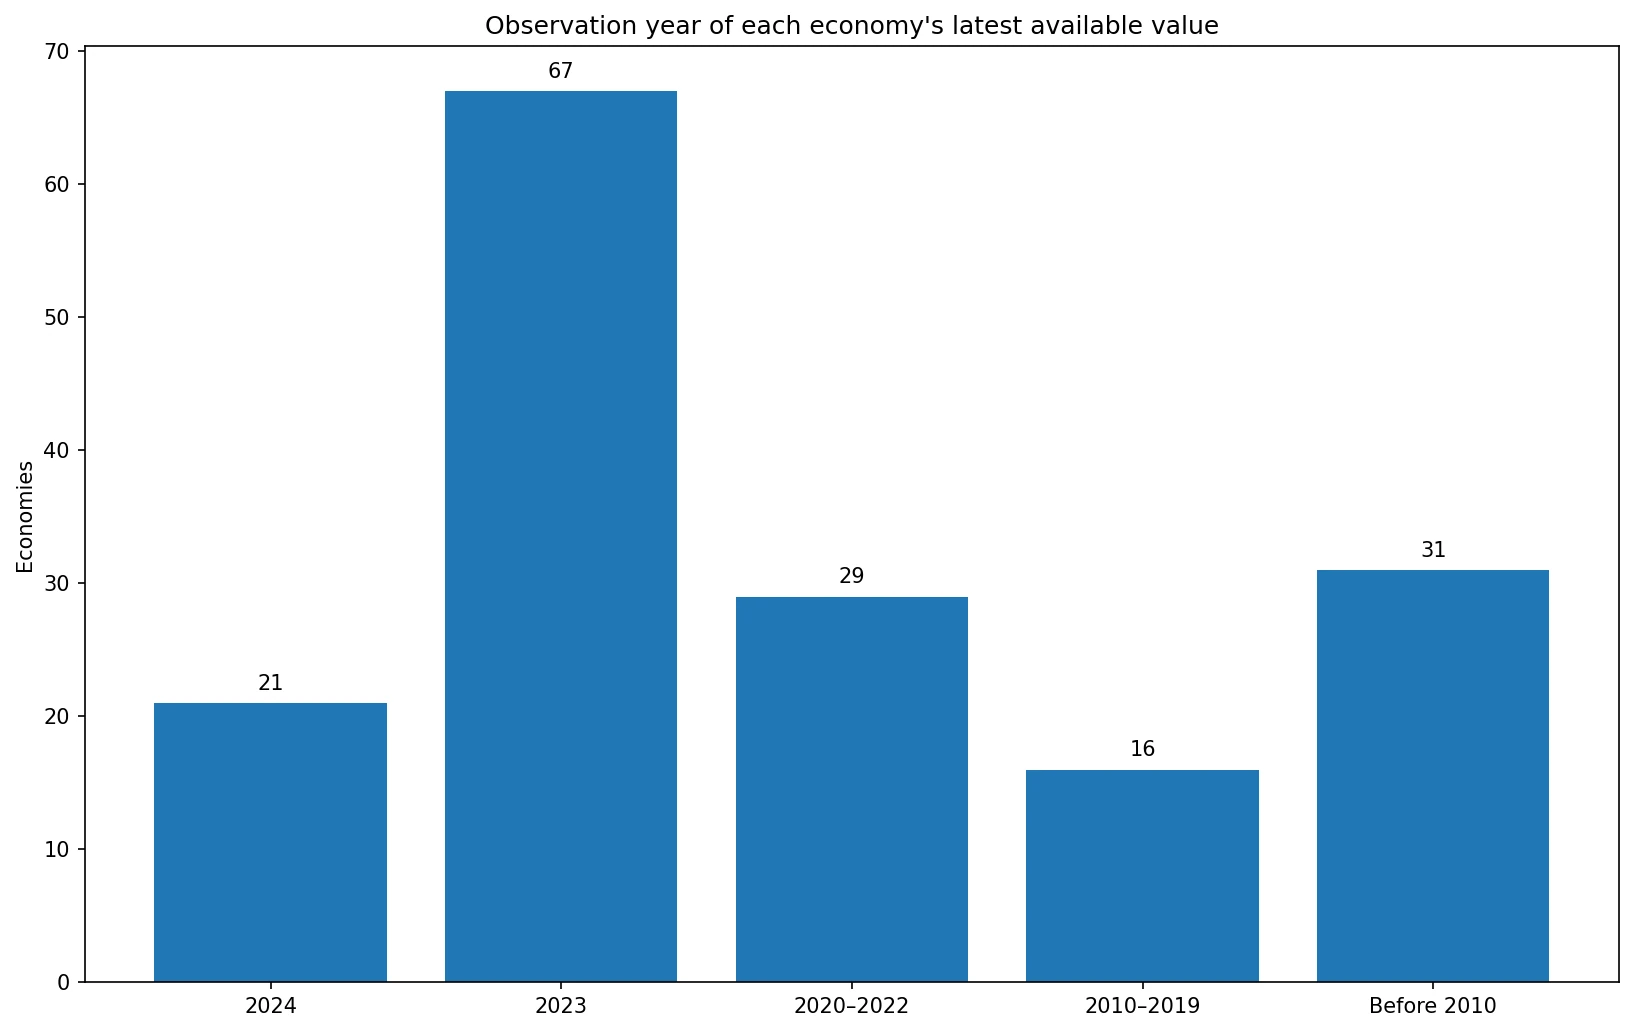
Observation year is the first limitation to understand. Only 21 of the 164 values are from 2024 and 67 are from 2023. Another 29 are from 2020–2022, 16 from 2010–2019, and 31 are from before 2010. In total, 117 observations are from 2020 or later, while a substantial minority are much older. The map therefore shows the most recent available value for each economy, not values measured at one common point in time.
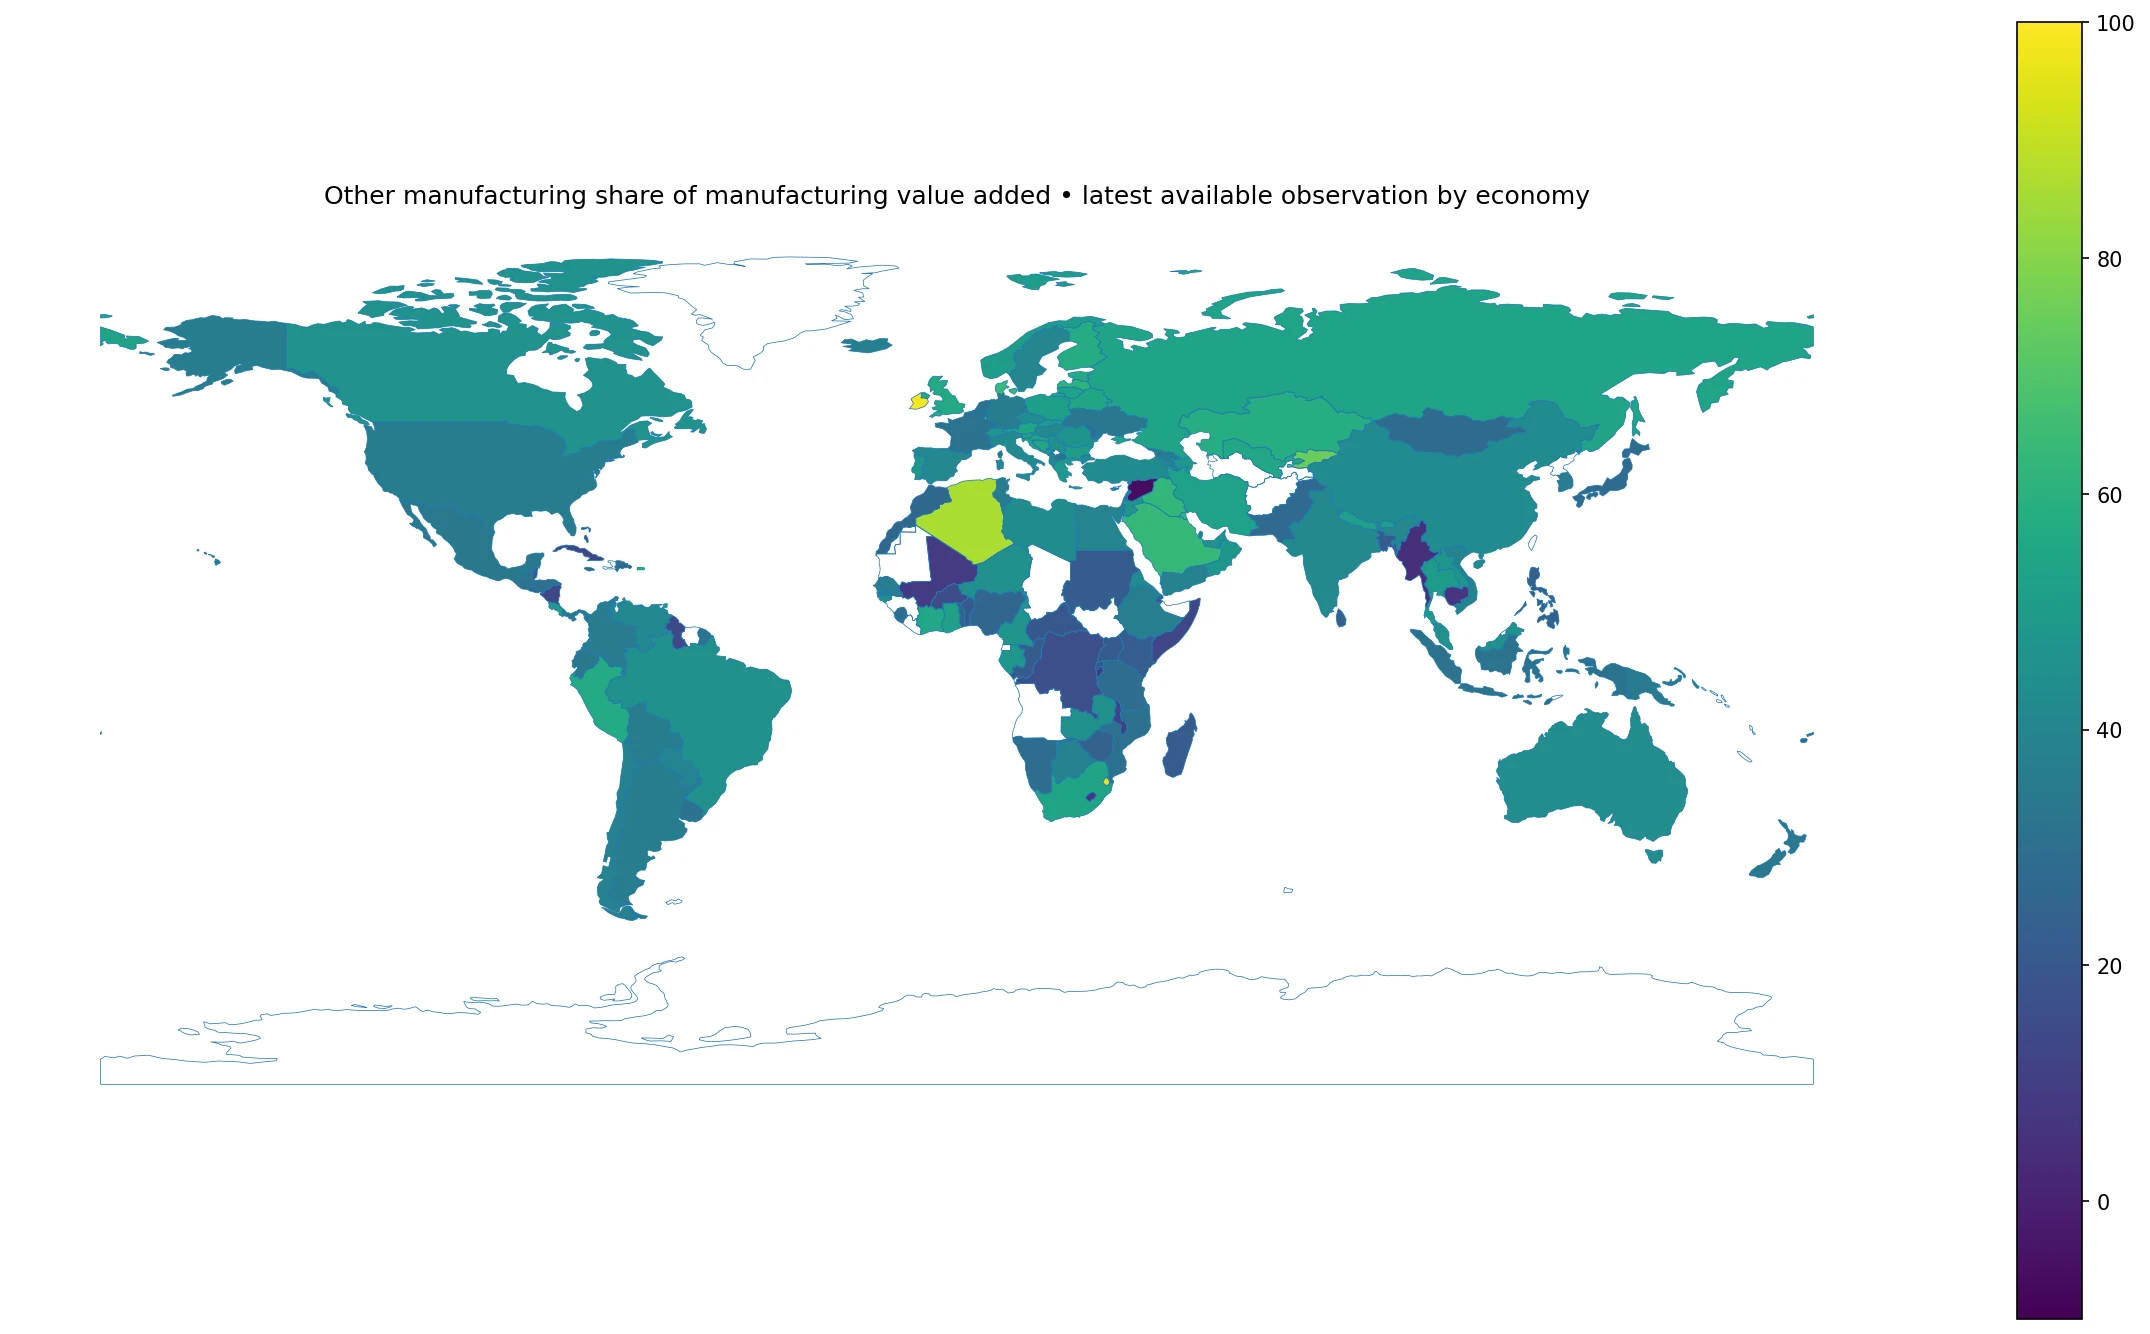
Table of Contents
Other manufacturing is a residual category, not one single industry
The World Bank definition groups several manufacturing activities into ‘Other manufacturing,’ including wood and related products, paper and publishing-related activities, petroleum-related products, basic metals and mineral-related products, fabricated metal products, professional goods, and several other industries. The category can also contain unallocated data.
A particularly important definition note is that textiles, machinery, or chemicals may be included in Other manufacturing when separate data for those categories are not available. This means a very high percentage does not automatically imply that a country’s manufacturing sector is dominated by miscellaneous industries in an economic sense. It can also reflect how detailed manufacturing data were reported and allocated.
The median of the 164 latest observations is 38.83%
The first quartile is 27.66% and the third quartile is 49.39%, so the middle half of observations lies between roughly 27.7% and 49.4%. The mean of 38.85% is almost identical to the median. Those summary statistics describe the collection of latest country observations, but they are not a World Bank estimate of the world manufacturing structure in any single year.
Values above 50% occur in many economies, but they should not be treated as a score of industrial diversity, sophistication, or competitiveness. A large residual share can arise because the industries inside the residual category are genuinely large, because other named manufacturing categories are smaller, or because more activities have been absorbed into the residual due to reporting availability.
The highest latest available observations
| Country or territory | Observation year | Other manufacturing share |
|---|---|---|
| Ireland | 2023 | 98.37% |
| Eswatini | 2014 | 95.55% |
| Algeria | 2017 | 86.10% |
| Kyrgyz Republic | 2023 | 74.67% |
| Maldives | 2015 | 74.46% |
| Bahrain | 2018 | 71.61% |
| Luxembourg | 2023 | 67.41% |
| Denmark | 2023 | 63.85% |
| Saudi Arabia | 2022 | 63.47% |
| Iraq | 2022 | 62.30% |
Ireland has the highest latest observation at 98.37% in 2023. Eswatini follows at 95.55%, but its latest observation is from 2014. Algeria is at 86.10% from 2017. The Kyrgyz Republic records 74.67% in 2023, Maldives 74.46% in 2015, and Bahrain 71.61% in 2018. Luxembourg and Denmark are among the recent high observations, both from 2023.
Showing the year beside every value is essential. A 2014 observation for Eswatini and a 2023 observation for Ireland do not describe the same economic moment. The table is best used to identify notable latest available values and then check whether the countries being compared have sufficiently similar reference years.
The lowest observations include one official negative value
| Country or territory | Observation year | Other manufacturing share |
|---|---|---|
| Syrian Arab Republic | 2005 | -6.24% |
| Marshall Islands | 2021 | 1.89% |
| Myanmar | 2023 | 4.60% |
| Lesotho | 2024 | 6.37% |
| Cambodia | 2000 | 6.65% |
| Mali | 2022 | 8.81% |
| Burundi | 2015 | 8.98% |
| Malawi | 2021 | 11.82% |
| Cuba | 1989 | 13.13% |
| Somalia, Fed. Rep. | 1986 | 13.31% |
The Syrian Arab Republic has the only negative value in the dataset, -6.24% in 2005. Marshall Islands records 1.89% in 2021, Myanmar 4.60% in 2023, and Lesotho 6.37% in 2024. Cambodia’s latest value is 6.65% from 2000, while Mali is 8.81% in 2022 and Burundi 8.98% in 2015.
The negative value is preserved because it is a direct official observation; it is not replaced with zero. The indicator alone is not sufficient to determine why that historical residual share was negative. Unusual values should be checked against the underlying manufacturing components and country metadata before they are used for economic interpretation.
Only 21 economies have a 2024 observation
| Country or territory | 2024 other manufacturing share |
|---|---|
| Peru | 56.86% |
| Cote d'Ivoire | 55.64% |
| Cameroon | 47.39% |
| Canada | 46.05% |
| Zambia | 45.16% |
| Guinea-Bissau | 45.12% |
| Australia | 43.44% |
| Turkiye | 42.63% |
| Macao SAR, China | 40.08% |
| Paraguay | 39.59% |
Within the 2024-only subset, Peru is highest at 56.86%, followed by Côte d’Ivoire at 55.64%, Cameroon at 47.39%, Canada at 46.05%, and Zambia at 45.16%. The median of the 21 same-year observations is 38.33%. These observations are directly comparable in time, but the group is far too small and selective to stand in for all 164 economies.
This creates a trade-off between coverage and temporal consistency. A latest-available map maximizes the number of economies but mixes years. A strict 2024 comparison keeps the reference year consistent but leaves most economies out. For contemporary cross-country analysis, it is often safer to start with the broad map, then restrict any important comparison to economies with reasonably aligned observation years.
Latest available does not mean same period
The World Bank API request used here selects the most recent non-empty value for each economy. That allows a broad map even when countries report at different frequencies, but it also means a 2024 value can sit next to a 1998 or 1983 value. Economic structure, industrial policy, technology, and reporting systems can change substantially over such long intervals.
The 31 observations from before 2010 deserve especially careful treatment. Their latest available status tells us that the World Bank series does not contain a more recent non-empty value in this extraction; it does not make the old figure a reliable description of today’s manufacturing structure. A current-focused analysis could instead restrict the sample to the 117 economies with observations from 2020 onward, or the 88 with observations from 2023–2024.
A high residual share reflects both structure and classification
The denominator is total manufacturing value added and the numerator is value added assigned to the Other manufacturing category. The ratio can increase because the residual industries themselves expand, because separately identified manufacturing categories shrink, or because some categories are not separately available and are folded into the residual.
This makes the indicator useful for understanding composition but unsuitable as a simple industrial-performance ranking. Competitiveness, productivity, technological intensity, export complexity, and manufacturing scale require other measures such as total manufacturing value added, manufacturing’s share of GDP, medium- and high-technology manufacturing, manufacturing employment, and export structure.
Value added is different from gross output or sales
Value added measures the contribution made by a producer or industry after subtracting intermediate goods and services from the value of output. An industry with large sales can have a lower value-added contribution if it uses large amounts of purchased inputs. That is why a share of manufacturing value added is not the same as a share of manufacturing shipments or revenue.
The current indicator divides the residual manufacturing category’s value added by total manufacturing value added. Two economies can both record a 40% share while having manufacturing sectors that differ enormously in absolute size. The indicator describes composition, not scale.
The percentage does not reveal the size of manufacturing
An economy with a small manufacturing base can have a very high Other manufacturing share, while a major industrial economy can have a lower percentage but a much larger absolute amount of value added in the same category. Market-size, investment, and employment questions therefore need absolute manufacturing value-added data alongside this percentage.
The same distinction applies to growth. A high share does not mean the category is growing quickly, and a low share does not imply contraction. A share can change because the numerator changes, the denominator changes, or both. The one-observation-per-economy file does not support growth-rate calculations.
Mixed observation years prevent a global trend claim
Because the file contains only one latest value per economy, it cannot show how the share changed over time within each country. Comparing an economy’s 2024 value with another economy’s 2005 value is not a trend analysis. A proper trend study would retrieve multiple years for the same indicator code and country.
The residual nature of the category makes metadata even more important in a time series. If reporting detail improves and textiles, machinery, or chemicals begin to be reported separately, the Other manufacturing share may change partly because classification became more detailed rather than because factories suddenly changed what they produce.
The map is best treated as a discovery tool
The choropleth makes broad spatial patterns and extreme values easy to find, but it cannot display the observation-year difference in the same color scale. Fourteen small states and territories—including Bahrain, Bermuda, Barbados, Hong Kong, Macao, Maldives, Malta, Mauritius, Singapore, and others—do not have separate matching polygons in the low-resolution boundary layer, although they remain in the calculations.
The map directly matches 150 of the 164 observations. None of the unmatched small geographies is dropped from the statistical summaries or ranking tables. For small jurisdictions, the tables are more reliable than the map for reading exact values.
The 2024 subset should be kept separate from the broad latest map
The 21 economies with 2024 observations have a simple mean of 36.27% and a median of 38.33%, with values ranging from 6.37% in Lesotho to 56.86% in Peru. These figures are useful for a same-year snapshot, but the coverage is shaped by data availability rather than by a representative sampling design.
The similarity between the 2024 subset median and the full latest-observation median should therefore not be overinterpreted. The underlying economy mix is different, and the broad map includes many observations from other decades. Coverage and vintage matter as much as the headline percentage.
Data source and calculation method
The source is World Bank indicator NV.MNF.OTHR.ZS.UN, ‘Other manufacturing (% of value added in manufacturing).’ The extracted dataset contains the most recent non-empty official observation for each of 164 countries and territories. The unit is percent of manufacturing value added, and observation years range from 1973 to 2024.
The median, quartiles, rankings, year-distribution counts, and 2024 subset statistics are calculated directly from the 164 verified observations. Missing economies are not filled with zero, and the official negative observation is preserved. ISO3 codes are joined to a low-resolution global boundary layer, producing 150 direct polygon matches.
Frequently Asked Questions
Does a high Other manufacturing share mean stronger manufacturing competitiveness?
No. Other manufacturing is a residual category containing several industries and potentially unallocated or unavailable subcategory data. Competitiveness requires separate measures.
Are all values in this map from 2024?
No. The dataset uses the latest non-empty observation for each of 164 economies, with reference years ranging from 1973 to 2024. Only 21 observations are from 2024.
Is the negative Syrian Arab Republic value a data error?
It is preserved as an official source observation. The indicator alone does not explain the negative value, so detailed manufacturing components and metadata should be checked before interpreting it.
Related Articles
Green Map creates custom-edited map images using open geographic data sources such as geoBoundaries, Natural Earth, OpenStreetMap, and government open data. These maps are edited visual materials, not raw data files, and are provided for education, documents, presentations, and graphic reference.