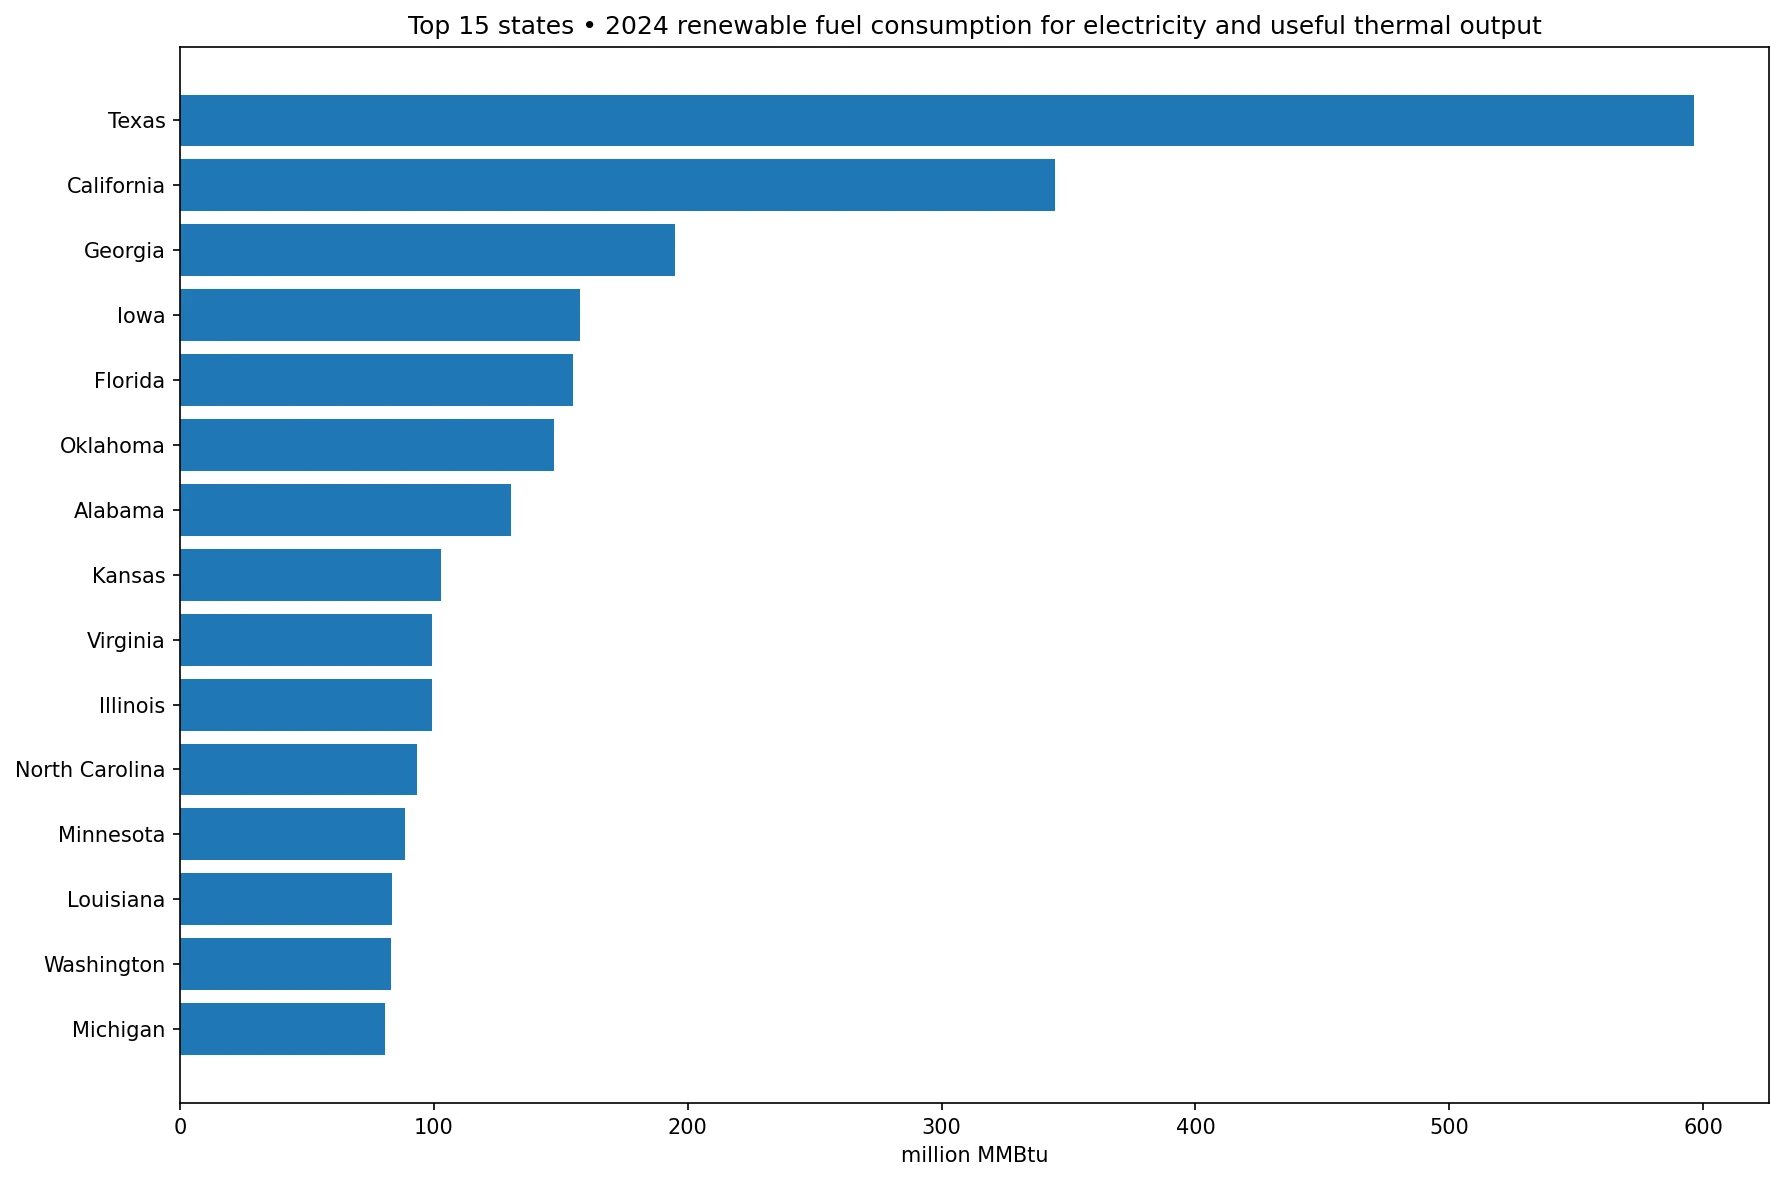
Renewable energy consumed for electricity generation and useful thermal output varies sharply across U.S. states. In the U.S. Energy Information Administration’s 2024 Electric Power Operations data, the 50 states and the District of Columbia total 3,651.78 million MMBtu for the ‘all renewables’ category. Texas is the largest observation at 596.26 million MMBtu, equal to 16.33% of the 51-jurisdiction total. California follows at 344.78 million MMBtu, or 9.44%. Together, those two states account for 25.77% of the observed total.
The metric is an energy-consumption measure expressed in million MMBtu. It is not electricity generation in megawatthours, generating capacity in megawatts, or the renewable percentage of a state’s electricity mix. A high value means that the amount recorded under this EIA renewable-consumption measure is large in absolute thermal-energy terms. It does not by itself show that renewables supply a larger share of electricity in that state.
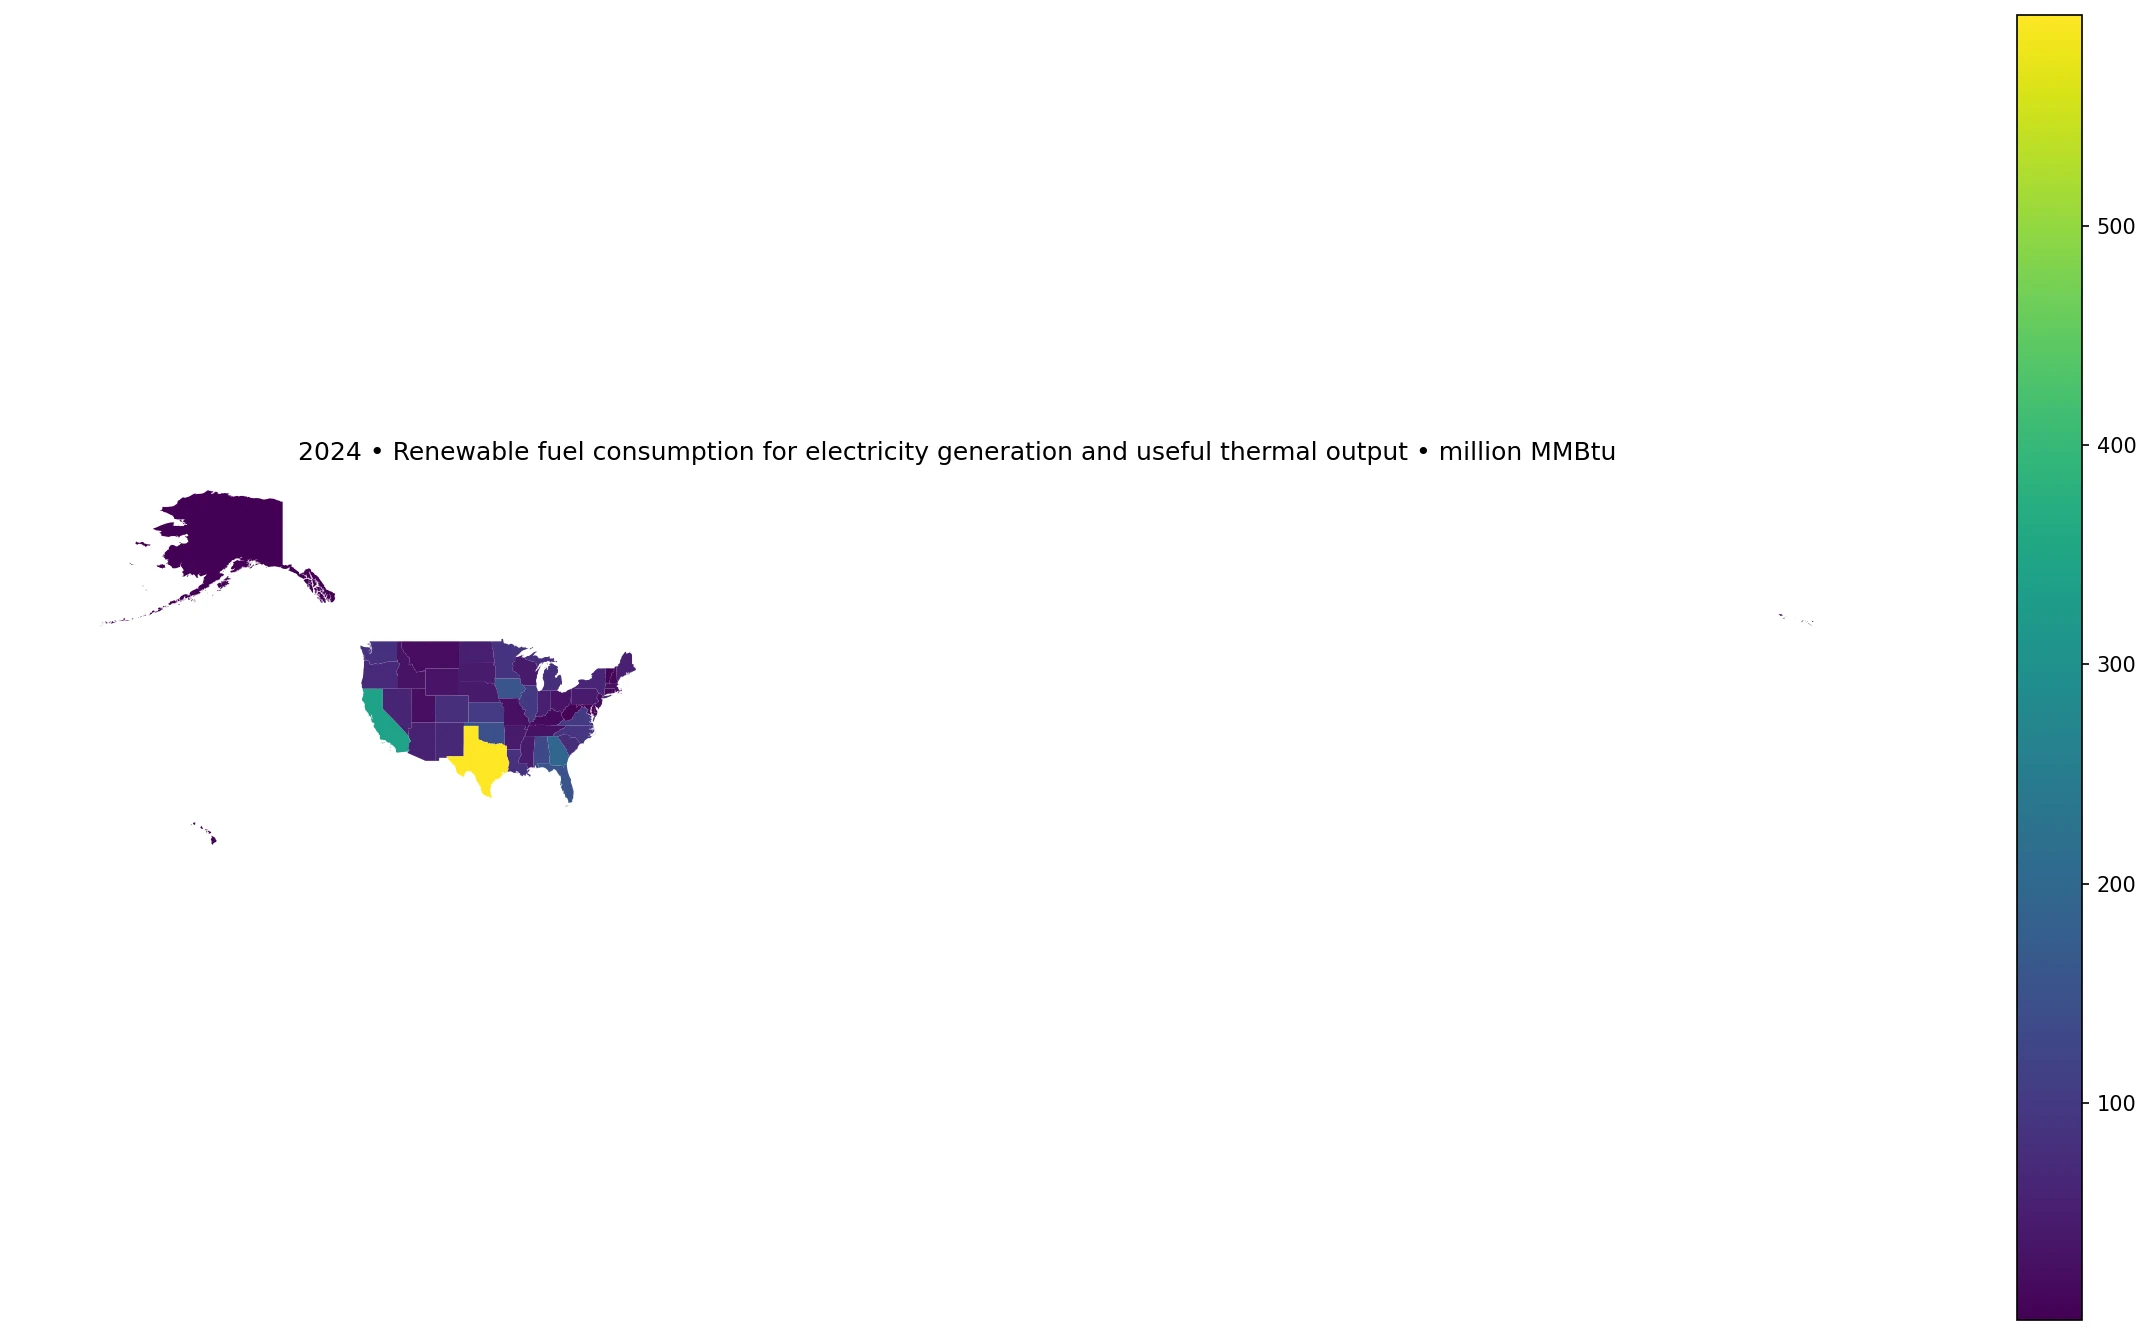
Table of Contents
The national distribution is much more concentrated than the average suggests
The mean across the 51 jurisdictions is 71.60 million MMBtu, while the median is only 46.56 million MMBtu. That gap shows how strongly the largest states pull the arithmetic average upward. The first quartile is 22.41 and the third quartile is 83.37 million MMBtu, so the middle half of observations lies in a much narrower band than the full range from 0.89 to 596.26 million MMBtu.
Eight states record at least 100 million MMBtu, and 25 reach at least 50 million MMBtu. The concentration becomes even clearer when the largest observations are summed. Texas alone represents 16.33% of the total; Texas and California together reach 25.77%. The top five account for 39.66%, while the top ten account for 55.51%. More than half of the measured renewable energy consumption in this series is therefore concentrated in just ten states.
The ten largest state observations
| State | million MMBtu | Share of 51-jurisdiction total |
|---|---|---|
| Texas | 596.26 | 16.33% |
| California | 344.78 | 9.44% |
| Georgia | 195.04 | 5.34% |
| Iowa | 157.71 | 4.32% |
| Florida | 154.65 | 4.23% |
| Oklahoma | 147.13 | 4.03% |
| Alabama | 130.18 | 3.56% |
| Kansas | 102.72 | 2.81% |
| Virginia | 99.32 | 2.72% |
| Illinois | 99.28 | 2.72% |
Texas leads by a wide margin. Its 596.26 million MMBtu observation is about 251.49 million MMBtu above California. Georgia ranks third at 195.04 million MMBtu, followed by Iowa at 157.71 and Florida at 154.65. Oklahoma is close behind at 147.13, while Alabama records 130.18 and Kansas 102.72 million MMBtu. Virginia and Illinois are nearly tied just below 100 million MMBtu.
The geography of the leading states is diverse. The list includes large Sun Belt electricity markets, Midwestern states, and California. That pattern cautions against assuming that a single renewable resource or a single regional characteristic explains the ranking. The supplied series is an aggregate for ‘all renewables’; it does not break each state’s total into wind, solar, hydro, biomass, or other component sources.
The lower end falls below 10 million MMBtu
| State or jurisdiction | million MMBtu | Share of 51-jurisdiction total |
|---|---|---|
| Alaska | 0.89 | 0.02% |
| District of Columbia | 1.01 | 0.03% |
| Delaware | 1.01 | 0.03% |
| Rhode Island | 4.72 | 0.13% |
| West Virginia | 7.50 | 0.21% |
| Vermont | 8.04 | 0.22% |
| Hawaii | 9.28 | 0.25% |
| Connecticut | 10.59 | 0.29% |
| New Hampshire | 11.59 | 0.32% |
| Maryland | 11.82 | 0.32% |
Alaska has the smallest observation at 0.89 million MMBtu. The District of Columbia and Delaware are each close to 1.01 million MMBtu. Rhode Island records 4.72, West Virginia 7.50, Vermont 8.04, and Hawaii 9.28 million MMBtu. Fifteen of the 51 jurisdictions are below 25 million MMBtu, and seven are below 10 million MMBtu.
A small number in this series should not be translated into ‘almost no renewable energy.’ The measure is specific to the EIA Electric Power Operations definition and to consumption for electricity generation and useful thermal output. Other renewable statistics—such as total renewable energy consumption in a state, distributed solar, renewable shares of retail electricity, or renewable net generation—answer different questions and may produce a very different ranking.
Texas and California exceed one quarter of the total
Texas and California together sum to 941.04 million MMBtu, more than one quarter of the 51-jurisdiction total. Adding Georgia raises the cumulative share to 31.11%. With Iowa and Florida included, the top five reach 39.66%. This level of concentration means that a simple mean is not a good description of a typical state. The median of 46.56 million MMBtu is more informative for the center of the distribution.
Pennsylvania sits at the median value of 46.56 million MMBtu. States above the third quartile of 83.37 million MMBtu form roughly the top quarter of the distribution, while those below the first quartile of 22.41 million MMBtu form the bottom quarter. Those thresholds make it easier to interpret the map without treating every visual difference as equally large.
Consumption in Btu is not the same as renewable generation
EIA’s Electric Power Operations dataset includes multiple measures of plant operations. This article uses the total-consumption-btu field for the renewable aggregate. The unit is therefore a thermal-energy unit, not an electricity-output unit. Net generation is normally expressed in megawatthours, while generating capacity is expressed in megawatts. A state can rank differently depending on which of those measures is used.
Absolute consumption also reflects the scale of the state’s electricity industry. A large system can record a high total even when renewables account for a moderate share of its generation. A smaller state can have a high renewable percentage but a relatively small absolute total. Evaluating the progress of a state’s energy transition therefore requires relative measures such as renewable generation share, per-capita values, or renewable capacity share in addition to this absolute-consumption measure.
Useful thermal output is part of the metric
The metric name explicitly includes both electricity generation and useful thermal output. EIA’s plant operating data, based on Form EIA-923, cover fuel consumption, electricity generation, and useful thermal output from combined heat and power operations. Useful thermal output refers to heat that is productively used rather than electricity alone, so the measure should not be shortened to ‘fuel used for electricity generation’ without qualification.
The current state-level series is an aggregate. It does not tell us how much of each state’s total is attributable to electricity generation versus useful thermal output. Nor does it identify which renewable source creates the total. Answering those questions requires more detailed EIA fields or energy-source facets. The interpretation here stays within what the provided data directly support.
Three cautions for state comparisons
First, this is a single-year snapshot for 2024. It cannot show whether a state’s renewable consumption is rising, falling, or unusually high relative to its own history. A trend analysis needs multiple annual observations. Second, the values are not normalized by population, gross state product, electricity sales, or total generation. The ranking is therefore a ranking of absolute energy consumption within this measure.
Third, the ‘all renewables’ category is an aggregate. Two states with similar totals can reach them through very different resource mixes and plant structures. One may depend more on one renewable source while another uses a broader combination. Resource-level data are required before attributing the differences to wind, solar, hydro, biomass, or another technology.
How to use the map without over-reading it
The map is most useful for identifying broad spatial concentration and locating unusually large or small state observations. It is less suitable for judging policy quality or renewable performance. Large values may reflect a large electricity sector, resource availability, existing generating fleets, combined heat and power activity, or several of those factors at once. The map shows where the measured total is large; it does not isolate the cause.
The ranking table provides the exact values that a choropleth cannot show clearly, especially for small jurisdictions. The bar chart highlights the scale gap among the top states. Reading the map, table, and distribution statistics together is more informative than relying on a single visual.
Data source and calculation method
The source is the U.S. Energy Information Administration’s Electric Power Operations (Annual and Monthly) data, an official EIA dataset based on power-sector operating information. The supplied API slice fixes the year at 2024, the fuel category at ‘all renewables,’ the sector at all sectors, and the measure at total-consumption-btu. The unit is million MMBtu, with 51 numeric observations covering the 50 states and the District of Columbia.
All totals, averages, quartiles, shares, and rankings in this article are calculated directly from those 51 observations. There are no source-missing values and none were filled with zero. For the map, state abbreviations were joined to state polygons derived from U.S. county boundaries; all 51 observations matched, producing a 100% geographic join rate.
Frequently Asked Questions
Is this the same as renewable electricity generation?
No. This article uses EIA's total-consumption-btu measure in million MMBtu. Net electricity generation is a separate measure normally reported in megawatthours.
Does Texas ranking first mean it has the highest renewable share?
No. The ranking is based on absolute consumption in this measure. Renewable share of total generation and per-capita measures can produce different rankings.
What does useful thermal output mean in this context?
It refers to useful heat produced in operations such as combined heat and power. The EIA metric combines renewable energy consumption associated with electricity generation and useful thermal output.
Related Articles
Green Map creates custom-edited map images using open geographic data sources such as geoBoundaries, Natural Earth, OpenStreetMap, and government open data. These maps are edited visual materials, not raw data files, and are provided for education, documents, presentations, and graphic reference.