World Bank data for 2022 show wide variation in the applied weighted-mean tariff rate for all products. Across 143 reporting countries and economies with values, the simple mean is 5.64% and the median is 3.66%. Bermuda records the highest value at 29.52%, followed by Solomon Islands at 20.66%, Equatorial Guinea and the Republic of the Congo at 18.18%, Cameroon at 18.08% and Belize at 18.05%. Of 217 source rows, 74 have no 2022 value and remain missing.
The first quartile is 1.33% and the third quartile is 8.79%, placing the middle half of observations roughly between those two points. 27 observations are at 10% or more, 10 at 15% or more and 2 at 20% or more. At the low end, 10 reported values are below 1%, and Hong Kong SAR, Macao SAR and Singapore are officially reported at 0%. Missing data are not converted to zero.
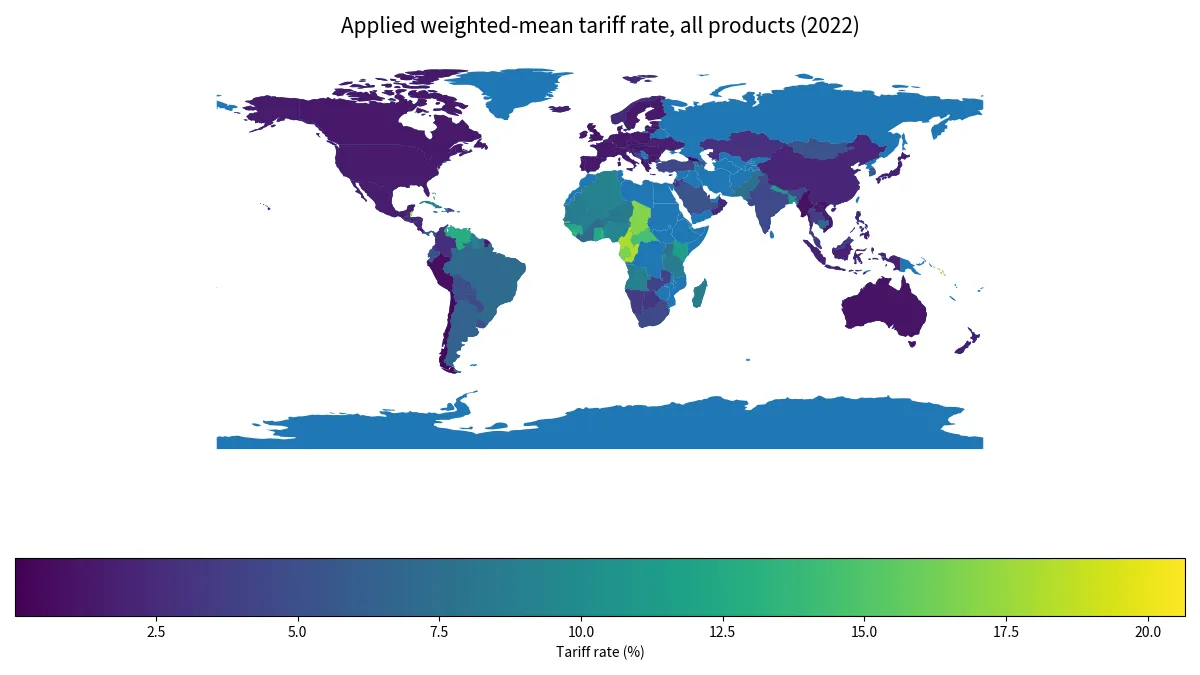
Table of Contents
This is an import-weighted applied tariff, not a simple tariff average
The key feature of this indicator is weighting. Product-level effectively applied tariff rates are weighted by the import shares of the corresponding products and partner countries. A tariff on a heavily imported product has more influence on the final rate than a tariff on a product that is rarely imported. Two economies with similar tariff schedules can therefore have different weighted means because their import baskets differ.
The World Bank definition states that product-level effectively applied rates are used and, when an effectively applied rate is unavailable, the most-favored-nation rate is used instead. Tariff-line information is classified at detailed Harmonized System levels and linked to SITC Revision 3 commodity groups, while import weights are derived from UN Comtrade. Specific duties are converted to ad valorem equivalents where possible.
It is different from an MFN tariff on manufactured products
This indicator should not be treated as interchangeable with an MFN tariff series for manufactured goods. MFN measures focus on most-favored-nation rates and can cover a narrower product category, while TM.TAX.MRCH.WM.AR.ZS covers all products and uses effectively applied rates weighted by actual import shares. Preferential trade relationships and differences in import composition can therefore create large gaps between the two measures without either being wrong.
A careful comparison needs to hold the tariff concept, product coverage and weighting method constant. Looking only at the word tariff can lead to false comparisons between simple averages, MFN rates and import-weighted applied rates.
Bermuda and several African and Pacific economies have high values
Bermuda is at 29.52% and Solomon Islands 20.66%. Equatorial Guinea and the Republic of the Congo are both at 18.18%, Cameroon at 18.08% and Belize at 18.05%. Chad reaches 16.80%, Gabon 16.57%, The Gambia 16.44% and The Bahamas 16.34%. The top ten observations average 18.88%.
A high weighted rate means that tariff-bearing imports with relatively high applied rates have a substantial role in the observed import basket. It is not, by itself, a complete score of protectionism or market openness. Non-tariff barriers, exemptions, domestic taxes, services trade and regulatory measures are outside this single indicator.
Europe is clustered at low rates while Africa has a higher median
Among map-matched observations, the median is 1.33% across 34 European economies, compared with 8.96% across 35 African economies. Asia has a median of 3.42% and South America 5.13%. These are unweighted country medians, not regional tariff rates weighted by trade value.
Many European observations cluster near 1.33%. Shared trade-policy structures may help explain part of that pattern, but the dataset itself does not isolate institutional causes. Africa and island economies show much wider variation, so one regional average cannot substitute for country-level values.
The 5.64% mean is well above the 3.66% median
The mean of 5.64% is about 1.98 percentage points above the median of 3.66%. The top ten observations average 18.88%, while the bottom ten average only 0.36%. A relatively small group of high-tariff observations pulls the arithmetic mean upward.
Of the 143 reported observations, 59 are at 5% or above and 27 are at 10% or above. More than half are below 5%, yet the upper tail extends close to 30%. Reporting both the median and mean therefore gives a more faithful picture than either statistic alone.
Large economies also show different weighted applied rates
The United States records 1.49%, China 2.18%, India 4.59%, Germany and France 1.33%, Japan 1.64%, Brazil 7.26%, Mexico 1.62% and the United Kingdom 1.00%. These differences reflect both applied tariff structures and the composition of imports used as weights.
A lower weighted mean does not necessarily mean every imported product faces a low tariff. A country can have high tariffs on selected goods that carry small import weights, while heavily imported goods face low rates. The opposite can also occur. Product-level data are needed to understand which categories drive the national average.
Official zeroes and missing values are different
Singapore, Hong Kong SAR and Macao SAR are officially reported at 0.00%. Australia is at 0.99%, Chile 0.46% and Albania 0.26%. These low but observed values must remain distinct from the 74 economies with no 2022 observation.
Treating missing values as zero would artificially lower the mean, distort the map and create false low-tariff observations. The comparison therefore uses only published numeric values for its statistics and ranking.
All 143 reported observations for 2022
The table lists all 143 economies with a published 2022 value from highest to lowest. The 74 source-missing rows are excluded from the ordering rather than assigned zero. The rank is a descriptive ordering of this one tariff indicator, not an overall ranking of trade openness.
| Rank | Country or economy | Applied weighted-mean tariff |
|---|---|---|
| 1 | Bermuda | 29.52% |
| 2 | Solomon Islands | 20.66% |
| 3 | Equatorial Guinea | 18.18% |
| 4 | Congo – Brazzaville | 18.18% |
| 5 | Cameroon | 18.08% |
| 6 | Belize | 18.05% |
| 7 | Chad | 16.80% |
| 8 | Gabon | 16.57% |
| 9 | Gambia | 16.44% |
| 10 | Bahamas | 16.34% |
| 11 | Barbados | 14.58% |
| 12 | Central African Republic | 14.48% |
| 13 | Sierra Leone | 13.65% |
| 14 | Togo | 13.56% |
| 15 | Grenada | 12.98% |
| 16 | Venezuela | 12.84% |
| 17 | Guinea | 12.60% |
| 18 | Cape Verde | 12.56% |
| 19 | Ghana | 12.51% |
| 20 | Kenya | 11.70% |
| 21 | Guinea-Bissau | 11.70% |
| 22 | Vanuatu | 11.48% |
| 23 | Nepal | 11.20% |
| 24 | Maldives | 11.12% |
| 25 | Rwanda | 11.11% |
| 26 | Bangladesh | 10.56% |
| 27 | Benin | 10.16% |
| 28 | Nigeria | 9.34% |
| 29 | Guyana | 9.27% |
| 30 | Algeria | 9.25% |
| 31 | Jamaica | 9.24% |
| 32 | St. Vincent & Grenadines | 9.17% |
| 33 | Cuba | 9.16% |
| 34 | Burundi | 8.96% |
| 35 | Mali | 8.90% |
| 36 | Angola | 8.85% |
| 37 | Madagascar | 8.74% |
| 38 | Mauritania | 8.68% |
| 39 | Tanzania | 8.64% |
| 40 | Senegal | 8.40% |
| 41 | Niger | 8.36% |
| 42 | Uganda | 7.86% |
| 43 | Suriname | 7.80% |
| 44 | Pakistan | 7.61% |
| 45 | Trinidad & Tobago | 7.51% |
| 46 | Brazil | 7.26% |
| 47 | Burkina Faso | 7.25% |
| 48 | Côte d’Ivoire | 7.25% |
| 49 | Cambodia | 7.20% |
| 50 | Argentina | 6.45% |
| 51 | Tonga | 6.44% |
| 52 | Liberia | 6.22% |
| 53 | Panama | 5.93% |
| 54 | South Korea | 5.66% |
| 55 | Azerbaijan | 5.45% |
| 56 | Saudi Arabia | 5.40% |
| 57 | Mongolia | 5.35% |
| 58 | Ecuador | 5.19% |
| 59 | Bolivia | 5.08% |
| 60 | Uruguay | 4.85% |
| 61 | Bhutan | 4.79% |
| 62 | South Africa | 4.66% |
| 63 | Paraguay | 4.63% |
| 64 | India | 4.59% |
| 65 | Türkiye | 4.31% |
| 66 | Zambia | 4.08% |
| 67 | Bosnia & Herzegovina | 4.04% |
| 68 | Kuwait | 4.01% |
| 69 | Dominican Republic | 3.97% |
| 70 | Qatar | 3.69% |
| 71 | Thailand | 3.67% |
| 72 | Bahrain | 3.66% |
| 73 | Namibia | 3.58% |
| 74 | Malaysia | 3.42% |
| 75 | Lesotho | 3.36% |
| 76 | Botswana | 3.23% |
| 77 | Jordan | 3.20% |
| 78 | Eswatini | 2.98% |
| 79 | Kazakhstan | 2.90% |
| 80 | Montenegro | 2.90% |
| 81 | Colombia | 2.83% |
| 82 | Israel | 2.62% |
| 83 | Guatemala | 2.39% |
| 84 | North Macedonia | 2.34% |
| 85 | Norway | 2.31% |
| 86 | China | 2.18% |
| 87 | El Salvador | 2.16% |
| 88 | Oman | 2.14% |
| 89 | Honduras | 2.11% |
| 90 | Nicaragua | 2.04% |
| 91 | Ukraine | 1.86% |
| 92 | Indonesia | 1.83% |
| 93 | Philippines | 1.76% |
| 94 | New Zealand | 1.70% |
| 95 | Japan | 1.64% |
| 96 | Iceland | 1.63% |
| 97 | Mexico | 1.62% |
| 98 | United States | 1.49% |
| 99 | Laos | 1.41% |
| 100 | Canada | 1.37% |
| 101 | Austria | 1.33% |
| 102 | Bulgaria | 1.33% |
| 103 | Belgium | 1.33% |
| 104 | Lithuania | 1.33% |
| 105 | Slovenia | 1.33% |
| 106 | Czechia | 1.33% |
| 107 | Cyprus | 1.33% |
| 108 | Spain | 1.33% |
| 109 | Denmark | 1.33% |
| 110 | Greece | 1.33% |
| 111 | Croatia | 1.33% |
| 112 | Netherlands | 1.33% |
| 113 | Estonia | 1.33% |
| 114 | Romania | 1.33% |
| 115 | Sweden | 1.33% |
| 116 | Slovakia | 1.33% |
| 117 | Portugal | 1.33% |
| 118 | Poland | 1.33% |
| 119 | Ireland | 1.33% |
| 120 | Finland | 1.33% |
| 121 | Italy | 1.33% |
| 122 | France | 1.33% |
| 123 | Germany | 1.33% |
| 124 | Hungary | 1.33% |
| 125 | Malta | 1.33% |
| 126 | Latvia | 1.33% |
| 127 | Switzerland | 1.30% |
| 128 | Costa Rica | 1.30% |
| 129 | Seychelles | 1.27% |
| 130 | Mauritius | 1.20% |
| 131 | Moldova | 1.16% |
| 132 | Vietnam | 1.07% |
| 133 | United Kingdom | 1.00% |
| 134 | Australia | 0.99% |
| 135 | Myanmar (Burma) | 0.82% |
| 136 | Peru | 0.66% |
| 137 | Chile | 0.46% |
| 138 | Georgia | 0.42% |
| 139 | Albania | 0.26% |
| 140 | Brunei | 0.01% |
| 141 | Hong Kong SAR China | 0.00% |
| 142 | Macao SAR China | 0.00% |
| 143 | Singapore | 0.00% |
How to read the map and year-to-year changes
The low-resolution map matches 129 of the 143 reported observations. The other 14 values, mostly small islands and territories, remain in the complete table and statistics. A blank map area should not be interpreted as a zero tariff.
Because the measure is import-weighted, it can change even when statutory tariff schedules remain stable. A shift toward imports of low-tariff products can reduce the weighted mean, while greater imports of higher-tariff products can raise it. Time-series interpretation therefore needs to consider both policy changes and changes in the import basket.
Source and indicator definition
The source is World Bank indicator TM.TAX.MRCH.WM.AR.ZS, “Tariff rate, applied, weighted mean, all products (%)”, for 2022. The comparison uses the 143 reported country and economy values and preserves the 74 source-missing rows as missing. The mean, median, quartiles and ranking are calculated from reported observations only.
Frequently Asked Questions
How is a weighted-mean tariff different from a simple tariff average?
Product-level applied tariff rates are weighted by their import shares, so heavily imported products have more influence on the national average.
What are the 2022 median and mean?
Across the 143 reported observations, the median is 3.66% and the simple mean is 5.64%.
Is this the same as an MFN tariff on manufactured products?
No. This indicator covers all products and uses effectively applied rates weighted by imports, so its product coverage, tariff concept and weighting differ from an MFN manufacturing tariff series.
Are missing values treated as zero?
No. The 74 source-missing rows remain missing and are excluded from the mean and ranking.
Related Articles
Green Map creates custom-edited map images using open geographic data sources such as geoBoundaries, Natural Earth, OpenStreetMap, and government open data. These maps are edited visual materials, not raw data files, and are provided for education, documents, presentations, and graphic reference.