International student mobility is often described with inbound and outbound counts, but UNESCO Institute for Statistics indicator MENF.5T8.GPIA combines a different pair of ideas. Its base concept is the net flow of internationally mobile students, defined as inbound minus outbound, and the published measure is an adjusted gender parity index (GPIA) for that net-flow indicator. The 2023 national dataset used here contains 84 country and area observations. The figures therefore are not student counts, not an outbound mobility rate, and not the female share of all internationally mobile students.
Across the 84 observations, the simple mean is 1.1008 and the median is 1.0213. Seven values fall inside the commonly used 0.97–1.03 parity band, 38 are below 0.97, and 39 are above 1.03. The overall range is unusually wide: Romania has the lowest published value at 0.0600, while Chile has the highest at 3.5821. Six official observations exceed 2. That feature matters because UIS usually explains adjusted gender parity indices as symmetric around 1 and bounded between 0 and 2 in conventional applications. This specific net-flow series does not fit that generic range, so the source values should not be clipped or converted into percentages.
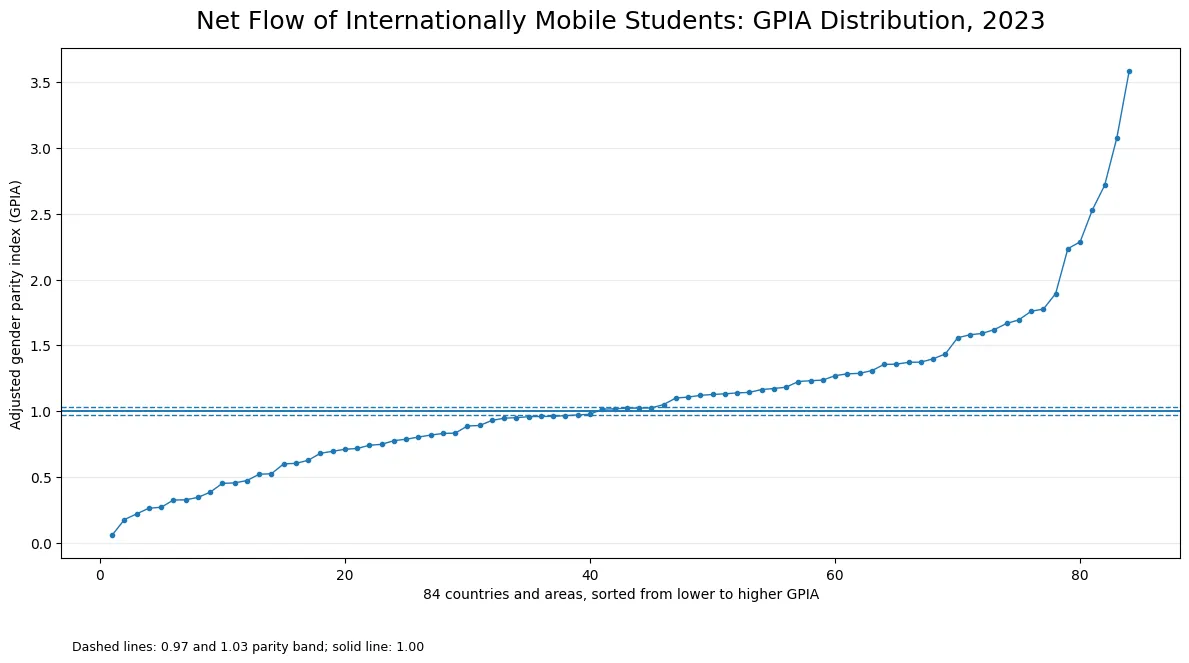
Table of Contents
Net flow and gender parity have to be read together
Net flow is different from a participation rate or an enrolment share. It represents the difference between students entering a country and students leaving it for study abroad. A net-flow measure can in principle be positive or negative, depending on whether inbound mobility exceeds outbound mobility. MENF.5T8.GPIA is a gender-parity derivative of that underlying net-flow concept. Treating the result as a simple female-to-male share of student numbers would therefore remove an essential part of the indicator’s identity.
UIS commonly describes GPIA with 1 as the parity point and 0.97–1.03 as a practical parity interval that allows small statistical differences. That framework is useful for identifying values close to 1 in this dataset. However, the supplied data do not include the female and male net-flow components from which each published index value was produced. Because a net-flow quantity can behave differently from standard non-negative rates, especially around zero, the article does not reverse-engineer the extreme values or claim that a value above 1 always represents a straightforward female advantage in absolute student numbers.
The median of the 84 observations is 1.0213
The center of the distribution is close to 1 even though the full range is broad. The median of 1.0213 means that the middle observation after sorting the 84 values lies near the parity reference. The mean of 1.1008 is higher than the median because several large observations pull the arithmetic average upward. The first quartile is 0.7362 and the third quartile is 1.3205, so the middle half of the reported values falls roughly between 0.74 and 1.32.
| Measure | 2023 value |
|---|---|
| Country/area observations | 84 |
| Simple mean | 1.1008 |
| Median | 1.0213 |
| First quartile | 0.7362 |
| Third quartile | 1.3205 |
| Below 0.97 | 38 |
| 0.97–1.03 | 7 |
| Above 1.03 | 39 |
| Above 2 | 6 |
| Minimum | Romania 0.0600 |
| Maximum | Chile 3.5821 |
There are 40 observations below 1 and 44 above 1, with none exactly equal to 1. That near balance in country counts should not be interpreted as a population-weighted or student-weighted global balance. A small higher-education system and a very large one each contribute one observation to this summary. The average and the category counts describe the cross-country distribution only; they do not measure the gender composition of all internationally mobile students worldwide.
Seven observations fall inside the usual parity band
The values between 0.97 and 1.03 are Sweden at 0.9723, France at 0.9775, Czechia at 1.0160, South Africa at 1.0191, Algeria at 1.0235, Portugal at 1.0248, and Malta at 1.0260. These observations are close to the parity reference for the published net-flow indicator. They do not imply that the countries have similar numbers of mobile students, similar net inflows, or similar higher-education systems.
Values just outside the interval also deserve continuous rather than categorical interpretation. Bermuda is at 0.9672, El Salvador at 0.9618, Hungary at 0.9608, and Oman at 0.9594. The 0.97 and 1.03 thresholds are practical guideposts, not natural discontinuities. A value of 0.969 is not fundamentally different from 0.971 simply because one falls outside and one falls inside the conventional band. For comparison work, retaining the numerical values alongside the categories is more informative than assigning rigid labels alone.
This official series contains values above 2
The most important technical feature of the dataset appears at the upper end. Generic UIS documentation explains GPIA as a transformation intended to make gender disparity symmetric around 1, with a conventional range from 0 to 2. Yet MENF.5T8.GPIA for 2023 includes six published observations above 2: Chile 3.5821, Serbia 3.0774, Slovakia 2.7154, Croatia 2.5295, Jordan 2.2865, and Bahrain 2.2343. These are direct values from the official series, not values generated by the calculations in this article.
For that reason, none of the six observations was capped at 2, rescaled, or turned into a percentage. Explaining precisely why they exceed the generic GPIA range would require the sex-specific net-flow components and series-level methodological details that are not present in the supplied national table. Rather than invent a mechanism, the safer approach is to preserve the official values and flag the difference between the generic GPIA definition and this particular net-flow series. Readers using the data for modeling should make the same distinction.
Low and high values are not a policy-performance ranking
At the lower end are Romania at 0.0600, Guatemala at 0.1780, Rwanda at 0.2212, Cuba at 0.2642, and Burundi at 0.2713. At the upper end are Chile and Serbia, followed by Slovakia, Croatia, Jordan, and Bahrain. These positions describe the published parity index for a net-flow measure. They do not establish that one education system performs better than another. International student flows can be related to domestic capacity, language, scholarship programs, visa rules, regional mobility networks, tuition, migration pathways, and many other factors, but this dataset contains none of those explanatory variables.
| Country or area | GPIA | Position in distribution |
|---|---|---|
| Romania | 0.0600 | Lower end of distribution |
| Guatemala | 0.1780 | Low value |
| Rwanda | 0.2212 | Low value |
| Sweden | 0.9723 | Parity band |
| France | 0.9775 | Parity band |
| Czechia | 1.0160 | Parity band |
| South Africa | 1.0191 | Parity band |
| Algeria | 1.0235 | Parity band |
| Portugal | 1.0248 | Parity band |
| Malta | 1.0260 | Parity band |
| Bahrain | 2.2343 | Official observation above 2 |
| Jordan | 2.2865 | Official observation above 2 |
| Croatia | 2.5295 | Official observation above 2 |
| Slovakia | 2.7154 | Official observation above 2 |
| Serbia | 3.0774 | Official observation above 2 |
| Chile | 3.5821 | Upper end of distribution |
Parity and level are also separate concepts. A value close to 1 says that the gender-related values behind the index are close on the relevant scale; it does not say that student mobility is high. A value far from 1 indicates a large relative difference in the published index, but without the underlying female and male net-flow values it does not reveal the absolute number of students or the size of inbound and outbound flows. Interpreting the index as an outcome ranking would therefore go beyond the evidence.
Median and quartiles describe the distribution better than the mean alone
The mean of 1.1008 is sensitive to the six observations above 2, especially Chile at 3.5821 and Serbia at 3.0774. The median of 1.0213 is much less affected by those upper-tail values and is a better description of a typical position in the ordered dataset. The interquartile range, from 0.7362 to 1.3205, gives another useful view: half of the reported country and area values lie within that interval, while the low and high tails extend much farther.
Grouping the observations around the parity band provides a compact descriptive summary: 38 are below 0.97, 7 are inside 0.97–1.03, and 39 are above 1.03. Those three groups are useful for navigation and visualization, but the underlying numerical values should remain visible. In particular, extreme net-flow GPIA values should not automatically receive the same directional interpretation used for ordinary non-negative education rates without checking the underlying sex-specific data.
Countries missing from the 84-row table are not zero
The 2023 file does not contain a numerical observation for every country and territory in the UIS catalogue. Only the 84 reported rows are used in the calculations and chart. Absence from the table is not evidence of a zero net flow or a zero parity index. Filling missing countries with zero would create artificial values below Romania’s actual minimum of 0.0600 and would distort the mean, median, quartiles, and any map or chart.
The same caution applies to time comparisons. This analysis is a 2023 cross-section. It does not assume that the same set of countries reported the indicator in 2022 or 2024, and it does not substitute values from another year. A trend analysis would first need to verify year-by-year coverage, the stability of the indicator definition, and ideally the female and male components that generate the published GPIA.
What this indicator can and cannot tell us
The 2023 series directly supports several observations: the distribution is centered near 1, only seven of 84 observations fall in the conventional 0.97–1.03 band, the lower and upper tails are wide, and six official values exceed 2. It also allows country-level comparisons of the published MENF.5T8.GPIA values without inventing missing data. The presence of observations above the generic GPIA bound is itself an important methodological signal that this net-flow series should be handled separately from simpler parity indices.
The indicator does not directly provide inbound student counts, outbound student counts, total internationally mobile students, the female share of mobile students, or the sex-specific net-flow components. It also cannot by itself measure university quality, internationalization success, access to scholarships, or the causal effect of any policy. Answering those questions requires additional UIS indicators and country-specific evidence. This article therefore stays focused on the published 2023 parity-index distribution.
Data source and calculation
The values come from the UNESCO UIS Data API series MENF.5T8.GPIA. All summary statistics were calculated directly from the 84 numerical country and area observations for 2023. No absent geography was filled with zero, and no value from another year was substituted.
The general interpretation of adjusted gender parity indices and the practical 0.97–1.03 parity interval follows the UIS explanation of the Adjusted Gender Parity Index. The specific MENF.5T8.GPIA values were nevertheless kept exactly as published, including the six observations above 2, rather than being forced into the generic range described for conventional GPIA applications.
Frequently Asked Questions
Is MENF.5T8.GPIA a count of international students?
No. It is an adjusted gender parity index associated with the net flow of internationally mobile students, not an absolute student count or a female share.
How many 2023 observations are inside the 0.97–1.03 parity band?
Seven of the 84 reported country and area observations fall inside the conventional 0.97–1.03 band.
Why are some official values above 2?
The MENF.5T8.GPIA source data contain six values above 2. The sex-specific net-flow components needed to explain the mechanism are not included, so the analysis preserves the official values rather than capping or reverse-engineering them.
Does the mean of 1.1008 describe the gender balance of all mobile students worldwide?
No. It is an unweighted mean of 84 country and area index values, not a student-weighted global aggregate.
Related Articles
Green Map creates custom-edited map images using open geographic data sources such as geoBoundaries, Natural Earth, OpenStreetMap, and government open data. These maps are edited visual materials, not raw data files, and are provided for education, documents, presentations, and graphic reference.