Eurostat’s 2025 enterprise digitalisation data show a wide spread in the share of enterprises using artificial intelligence to automate workflows or assist decision making. Among 32 reporting countries with observations on the same basis, Denmark records the highest share at 15.19%, narrowly ahead of Finland at 15.03%. Belgium is third at 10.84%. Norway follows at 9.51%, Sweden at 8.79%, Lithuania at 8.69%, and the Netherlands at 8.45%. At the other end, Albania records 1.13%, with Montenegro at 2.07%, Serbia at 2.13%, and Romania at 2.18%.
The simple mean across the 32 observations is 5.51%, while the median is 4.025%. The mean is therefore 1.485 percentage points above the median because a small group of high observations stretches the upper tail. The first quartile is 2.90% and the third quartile is 7.12%, placing the middle half of countries roughly between those two levels. The gap between the highest and lowest values is 14.06 percentage points, a substantial spread for observations defined by the same indicator, year, enterprise-size class, and unit.
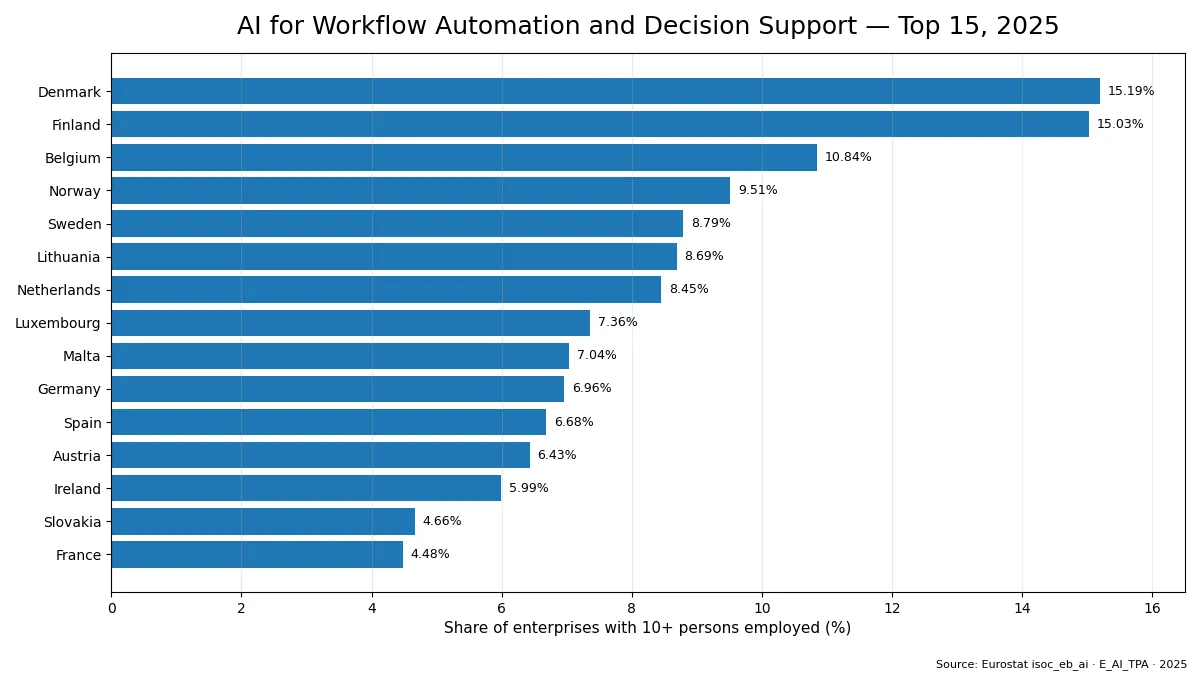
Table of Contents
This is not an overall measure of every kind of enterprise AI use
The indicator should not be read as the percentage of enterprises using any artificial-intelligence technology for any purpose. E_AI_TPA is narrower: it concerns AI used to automate workflows or to assist decision making. Other Eurostat indicators can describe functions such as speech recognition, image recognition, text processing, or other AI uses, and those percentages are not automatically added to this one. Denmark’s 15.19%, for example, does not mean that 15.19% of enterprises use every category of AI. It means that this share falls within the specific workflow-automation or decision-support definition used by the survey.
The denominator matters as well. The measure covers enterprises with at least 10 persons employed and reports the share of enterprises, not the share of workers exposed to AI. A large company deploying an AI system to thousands of employees still counts as one enterprise, while businesses below the size threshold are outside this particular statistic. The indicator also says nothing directly about spending, frequency of use, the number of processes automated, the importance of decisions supported by AI, or the productivity effect of adoption. It is therefore a technology-use rate, not a comprehensive digital-performance score.
High values cluster in northern Europe, but the pattern is not exclusively regional
Denmark and Finland both exceed 15%, and Belgium reaches 10.84%, so 3 countries are at or above 10%. Norway and Sweden are just below that threshold. The simple average for Denmark, Finland, Norway and Sweden is 12.13%, clearly above the overall mean. Yet Belgium, Lithuania and the Netherlands also appear near the top, showing that the upper end is not confined to one geographic group.
The Benelux trio of Belgium, the Netherlands and Luxembourg averages 8.88%. The Baltic states illustrate why regional shorthand needs care: Lithuania is high at 8.69%, while Latvia is 3.86% and Estonia 3.33%, giving the three-country group a simple average of 5.29%. Adjacent countries can occupy quite different positions. These patterns can motivate further research, but the indicator alone cannot identify whether sector mix, software availability, skills, cloud adoption, regulation, wages, or another factor is responsible.
The median gives a better sense of the centre than the mean alone
A mean of 5.51% can make the centre of the distribution appear to sit in the mid-5% range. In fact, the 16th and 17th ordered observations are France at 4.48% and Czechia at 4.07%, producing a median of 4.025%. The two observations above 15% and the additional value above 10% pull the mean upward. Looking at the median and quartiles alongside the mean avoids describing the higher average as if it were a typical country value.
Grouping the values makes the shape clearer. There are 3 countries at 10% or more, 10 between 5% and less than 10%, 9 between 3% and less than 5%, and 10 below 3%. The 5–10% interval and the below-3% interval each contain ten countries. The top eight observations average 10.48%, compared with 2.28% for the bottom eight, a ratio of about 4.6 to one. That difference is more informative than treating every adjacent rank as equally important.
Small numerical gaps can correspond to several ranking places
Spain records 6.68%, Austria 6.43%, and Ireland 5.99%. Slovakia is at 4.66%, France 4.48%, Czechia 4.07%, Portugal 3.98%, Hungary 3.91%, and Latvia 3.86%. Within this middle zone, moving several places in the ranking may reflect a difference of less than one percentage point. Portugal and Latvia, for example, differ by only 0.12 percentage points. A chart or map should therefore be read together with the exact values rather than turning minor rank changes into large substantive differences.
Lithuania stands out within the Baltic group at 8.69%. Malta is 7.04%, close to the upper quartile boundary, while Germany at 6.96%, Spain at 6.68%, and Austria at 6.43% are all above the overall mean. None of these values tells us what specific workflow was automated or whether AI made a final decision. The wording “assist decision making” explicitly includes support functions, so the measure should not be relabelled as the share of enterprises using fully autonomous decision systems.
The lower end also contains distinct subgroups rather than one uniform block
Ten observations are below 3%: Türkiye at 2.99%, Croatia 2.91%, Cyprus 2.87%, Italy 2.86%, Poland 2.60%, Bosnia and Herzegovina 2.43%, Romania 2.18%, Serbia 2.13%, Montenegro 2.07%, and Albania 1.13%. Some of these values are almost identical. Italy and Cyprus differ by just 0.01 percentage points, while Serbia and Montenegro differ by 0.06. Describing them all as “low-adoption countries” is ordinally true in this dataset but can hide important differences in magnitude and context.
Coverage is another limitation. Enterprises with fewer than ten persons employed are not represented by this size class, so the statistic is not a direct estimate for every business in each economy. Differences in the composition of industries and the number of firms by size may matter, yet they are not separated in the headline percentage. The safest interpretation stays close to the evidence: among enterprises covered by Eurostat’s definition, the reported use rate for this AI purpose varied substantially across the 32 countries in 2025.
All 32 comparable observations for 2025
The table below sorts all observations from highest to lowest while keeping the year, indicator, enterprise-size threshold and unit constant. Rank is included only for navigation. It is not a composite assessment of AI maturity, competitiveness, innovation quality, or economic performance.
| Rank | Country | Share of enterprises |
|---|---|---|
| 1 | Denmark | 15.19% |
| 2 | Finland | 15.03% |
| 3 | Belgium | 10.84% |
| 4 | Norway | 9.51% |
| 5 | Sweden | 8.79% |
| 6 | Lithuania | 8.69% |
| 7 | Netherlands | 8.45% |
| 8 | Luxembourg | 7.36% |
| 9 | Malta | 7.04% |
| 10 | Germany | 6.96% |
| 11 | Spain | 6.68% |
| 12 | Austria | 6.43% |
| 13 | Ireland | 5.99% |
| 14 | Slovakia | 4.66% |
| 15 | France | 4.48% |
| 16 | Czechia | 4.07% |
| 17 | Portugal | 3.98% |
| 18 | Hungary | 3.91% |
| 19 | Latvia | 3.86% |
| 20 | Bulgaria | 3.76% |
| 21 | Estonia | 3.33% |
| 22 | Slovenia | 3.14% |
| 23 | Türkiye | 2.99% |
| 24 | Croatia | 2.91% |
| 25 | Cyprus | 2.87% |
| 26 | Italy | 2.86% |
| 27 | Poland | 2.60% |
| 28 | Bosnia and Herzegovina | 2.43% |
| 29 | Romania | 2.18% |
| 30 | Serbia | 2.13% |
| 31 | Montenegro | 2.07% |
| 32 | Albania | 1.13% |
What the data can and cannot support
The comparison supports descriptive conclusions about the level and distribution of enterprise use of AI for workflow automation or decision support in 2025. It identifies the highest and lowest reported shares, shows where the midpoint lies, and quantifies the spread between groups. It does not establish which country is adopting AI faster because a growth claim requires comparable observations across time. It also does not measure the intensity, effectiveness, or economic return of AI use inside enterprises.
Explaining cross-country differences would require additional evidence on sector structure, firm size, digital infrastructure, software investment, data availability, workforce skills, regulation, and other conditions. Those factors may be relevant, but they are not contained in E_AI_TPA itself. The strongest conclusion is therefore descriptive: Denmark and Finland are above 15%, ten countries are below 3%, and the mean is noticeably above the median because the distribution has a pronounced upper tail.
Source and indicator definition
The primary source is Eurostat isoc_eb_ai for annual 2025 observations. The indicator is E_AI_TPA, enterprise size is GE10, and the unit is PC_ENT. It measures the percentage of enterprises with at least 10 persons employed that use artificial-intelligence technologies to automate workflows or assist decision making. Sector coverage follows Eurostat’s C10-S951_X_K aggregate. Rankings and summary statistics here are calculated only from the 32 observations that share the same year, indicator, enterprise-size class, and unit.
Frequently Asked Questions
Which country has the highest reported enterprise use of AI for workflow automation or decision support in 2025?
Denmark is highest at 15.19%, followed by Finland at 15.03% and Belgium at 10.84% among the 32 reporting countries.
Is this the overall percentage of enterprises using any type of AI?
No. The indicator covers enterprises with at least 10 persons employed using AI to automate workflows or assist decision making.
Why is the 5.51% mean higher than the 4.03% median?
A small number of high observations, especially Denmark and Finland above 15%, stretch the upper tail and pull the simple mean above the midpoint.
Do the 32 observations represent every enterprise in Europe?
No. They compare reporting countries with validated 2025 observations under this Eurostat definition and exclude enterprises below the GE10 size threshold.
Related Articles
Green Map creates custom-edited map images using open geographic data sources such as geoBoundaries, Natural Earth, OpenStreetMap, and government open data. These maps are edited visual materials, not raw data files, and are provided for education, documents, presentations, and graphic reference.