The 2025 World Bank series reports a youth labor force participation rate for 182 countries and economies, while 35 entries remain source-missing. Among the reported observations, the median is 38.87% and the mean is 41.42%. The Netherlands records the highest value at 83.30%, followed by Iceland at 82.14% and the Democratic People’s Republic of Korea at 78.49%. Djibouti has the lowest reported value, 13.42%. The distance between the two ends of the distribution is therefore nearly 70 percentage points.
The indicator is World Development Indicators series SL.TLF.ACTI.1524.ZS, sourced from the ILO Modelled Estimates database. It measures the share of people ages 15–24 who are in the labor force. The labor force includes people who are employed and people who are unemployed but are participating in the labor market under the relevant statistical definition. It does not measure the share of young people who have a job, and it should not be read as a direct measure of job quality or earnings.
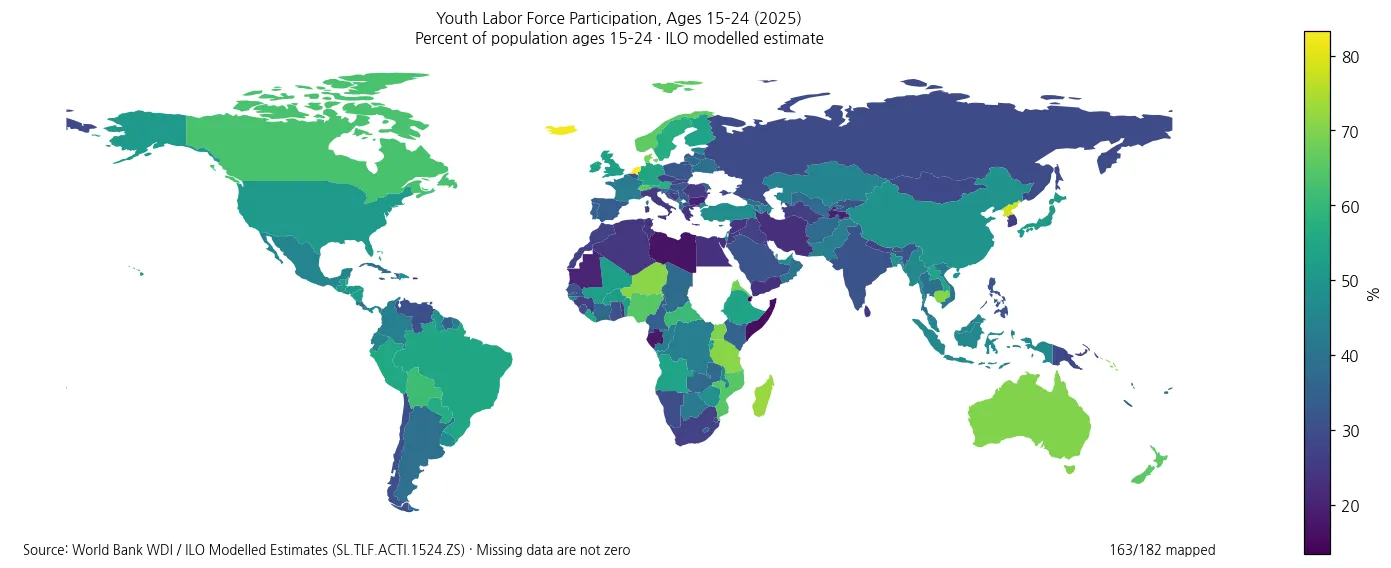
Table of Contents
Most reported values fall between roughly 31% and 51%
The middle half of the reported distribution runs from 30.71% at the first quartile to 51.49% at the third quartile. The median is 38.87%, while the 90th percentile reaches 61.19%. The mean is somewhat higher than the median because a smaller set of observations extends into the 60% to 80% range. This shape makes the median a useful reference point when comparing a single economy with the wider distribution.
The counts by broad band are also informative: 6 observations are below 20%, 35 are from 20% to below 30%, 55 are in the 30s, 37 are in the 40s, 28 are in the 50s, 12 are in the 60s, and 9 are at least 70%. The 30–39.9% band contains the largest number of economies, but 49 observations are still at or above 50%.
The highest participation rates are spread across several regions
The top of the list is geographically diverse. The Netherlands is at 83.30% and Iceland at 82.15%. The Democratic People’s Republic of Korea is at 78.49%, followed by Madagascar at 72.41%, Solomon Islands at 70.83%, Niger at 70.77%, Tanzania at 70.74%, Cambodia at 70.55%, Australia at 70.17%, and Uganda at 69.77%. Europe, Africa, Asia and Oceania are all represented near the top.
A high participation rate means that a large share of people ages 15–24 are either working or participating in the labor market as unemployed persons. It does not establish that those young people have secure jobs, high wages or favorable working conditions. Nor does it reveal how many are studying full time. A labor-market assessment therefore needs employment, unemployment, education and NEET indicators alongside participation.
| Country or economy | 2025 participation rate |
|---|---|
| Netherlands | 83.30% |
| Iceland | 82.14% |
| Korea, Dem. People’s Rep. | 78.49% |
| Madagascar | 72.41% |
| Solomon Islands | 70.83% |
| Niger | 70.77% |
| Tanzania | 70.74% |
| Cambodia | 70.55% |
| Australia | 70.17% |
| Uganda | 69.77% |
The bottom of the distribution reaches the mid-teens
Djibouti reports 13.42%, Somalia 15.84%, Libya 16.73% and Gabon 17.80%. Tajikistan at 19.33% and Bulgaria at 19.55% are also below 20%. Mauritania is just above that threshold at 20.05%, followed by São Tomé and Príncipe at 21.24%, Puerto Rico at 21.68% and Iran at 22.55%. These are reported values, not missing entries.
Low participation is not identical to high unemployment. A young person who is outside employment and not actively in the labor force is outside the numerator of the participation rate. The same is true for many students who are not working or looking for work. By contrast, a jobseeker who meets the unemployment definition remains part of the labor force. This is why participation, employment and unemployment rates can move differently.
| Country or economy | 2025 participation rate |
|---|---|
| Djibouti | 13.42% |
| Somalia, Fed. Rep. | 15.84% |
| Libya | 16.73% |
| Gabon | 17.80% |
| Tajikistan | 19.33% |
| Bulgaria | 19.55% |
| Mauritania | 20.05% |
| Sao Tome and Principe | 21.24% |
| Puerto Rico (US) | 21.68% |
| Iran, Islamic Rep. | 22.55% |
Europe combines very high rates in the northwest with much lower rates elsewhere
The Netherlands (83.30%), Iceland (82.14%), Denmark (69.07%), Norway (66.07%) and Switzerland (65.65%) all sit well above the global median. Yet Bulgaria is at 19.55%, Italy at 24.63% and Spain at 33.76%. Germany (54.62%), the United Kingdom (52.45%) and France (42.51%) occupy intermediate-to-high positions.
The map therefore does not support a single “European” level of youth participation. Neighboring and nearby labor markets can differ markedly. Possible explanations may involve schooling patterns, apprenticeship systems, demographic composition or labor-market institutions, but this dataset does not identify causes. Those questions require additional indicators and country-specific evidence.
Africa shows some of the widest contrasts on the map
Madagascar is at 72.41%, Niger 70.77%, Tanzania 70.74%, Uganda 69.77%, Eritrea 68.50% and Nigeria 64.78%. At the other end, Djibouti is at 13.42%, Somalia 15.84%, Libya 16.73% and Gabon 17.80%. The spread within the continent is therefore larger than 50 percentage points.
These differences should not be turned into a ranking of labor-market quality. Participation can be high in an economy where young people enter work early, including work that is informal or low paid, and it can be lower where more young people remain in education. The indicator records whether people are in the labor force, not the quality or productivity of the work they perform.
Asia and the Pacific span participation rates from around 30% to above 70%
Cambodia (70.55%) and Australia (70.17%) are near 70%. Japan is at 51.16%, China 49.28%, Indonesia 46.00%, Viet Nam 41.05% and Thailand 39.59%. India is at 31.20% and the Philippines at 31.70%. The region contains both very high and relatively low participation within the same broad age group.
Because ages 15–24 cover the transition from secondary education into higher education and work, institutional differences matter to interpretation. A lower participation rate can coincide with extended schooling, while a higher rate can reflect earlier entry into the labor market. The series alone cannot determine which mechanism is dominant in any country, so causal claims should be avoided without education and employment evidence.
The Americas also show sizable differences within neighboring groups
Canada records 63.05%, the United States 50.83% and Mexico 45.01%. In South America, Peru is at 55.23% and Brazil at 54.63%, while Colombia is 43.23%, Argentina 38.75% and Chile 30.08%. These values show that even within connected regional labor markets the share of youth participating can differ substantially.
Again, the differences are not a count of jobs. A country can have a high participation rate and still have a high youth unemployment rate because unemployed jobseekers are in the labor force. Conversely, a country can show a lower participation rate when many young people are outside the labor force. Employment-to-population ratios and NEET rates answer complementary questions.
Modeled ILO estimates improve comparability but are not identical to every national series
The “modeled ILO estimate” label matters when comparing results. ILOEST is designed to place labor-market indicators on a more comparable international basis using consistent concepts and statistical modeling. A value in this series may therefore differ from a headline number published by a national statistical office for a specific survey period or under a national methodology. The modelled series is useful for cross-country comparison, while national labor-force surveys may be more appropriate for detailed domestic analysis.
The 2025 values in this article form a cross-section. They do not show whether participation is rising or falling in each economy, and the ranking should not be interpreted as a long-run trajectory. A trend analysis would require several years from the same series, ideally examined together with changes in enrollment, employment and unemployment.
Missing observations are kept separate from genuinely low participation
Of the 217 country and economy rows in the source file, 35 do not have a reported 2025 value. There are no genuine 0% observations among the 182 reported values. Replacing missing entries with zero would therefore create artificial low values and distort the mean, percentiles and ranking. Every summary statistic in this article is calculated from reported observations only.
For the map, 163 reported observations join directly to the simplified Natural Earth polygons after standard ISO matching plus the France and Norway boundary-name fixes. Nineteen reported small or special economies lack a suitable independent polygon in this low-resolution boundary layer. Their values are still included in the tables and distribution statistics. Blank or uncolored map areas should therefore be interpreted cautiously: some are source-missing, while a small set have data but no separate polygon at this scale.
Read the rate as labor-market participation, not as an employment score
The numerator is the labor force ages 15–24 and the denominator is the population of the same age group. In practical terms, a 50% rate means about half of young people are either employed or counted as unemployed within the labor force definition. It does not mean that half have jobs. This distinction is essential when comparing countries with different education systems and different patterns of school-to-work transition.
The source is the World Bank World Development Indicators series SL.TLF.ACTI.1524.ZS, drawing on the International Labour Organization’s ILO Modelled Estimates database. The package contains 217 non-aggregate country and economy rows for 2025; 182 have values and 35 are preserved as missing. The comparison here uses only those reported values and does not impute missing observations.
Frequently Asked Questions
Is youth labor force participation the same as the youth employment rate?
No. Labor force participation includes young people who are employed and those who are unemployed but in the labor force. The employment rate counts employed people only.
Should the 35 missing 2025 observations be treated as 0%?
No. They are source-missing observations, not reported zero values. The dataset contains no genuine 0% observation for 2025, so missing rows are excluded from the statistics.
Does a higher participation rate mean a better youth labor market?
Not by itself. A higher rate means more young people are working or participating as unemployed jobseekers. It does not directly measure wages, job quality, unemployment, education participation or employment security.
Related Articles
Green Map creates custom-edited map images using open geographic data sources such as geoBoundaries, Natural Earth, OpenStreetMap, and government open data. These maps are edited visual materials, not raw data files, and are provided for education, documents, presentations, and graphic reference.