Most-favored-nation (MFN) tariffs on manufactured products varied widely across reporting countries and economies in 2022. In the World Bank series TM.TAX.MANF.SM.FN.ZS, The Bahamas had the highest reported simple mean at 33.23%, followed by Bermuda at 21.42% and Algeria at 18.31%. At the other end, Hong Kong SAR, China, Singapore, Macao SAR, China, and Iceland each reported 0.00%. The World Bank country-and-economy frame contains 217 non-aggregate entries for this comparison; 143 have a 2022 value and 74 have no reported value. Missing observations are kept separate from genuine zeros on the map.
The indicator is a simple, unweighted average of MFN tariff rates across manufactured-product tariff lines. That means every tariff line receives the same weight in the average. It is not a trade-weighted tariff, and it does not tell us the average duty actually paid on each dollar of imports. The World Bank description uses Harmonized System tariff-line information and maps products to SITC Revision 3 groups; manufactured products are defined as sections 5 through 8 excluding division 68. MFN rates also differ from preferential tariff rates that may apply under free-trade agreements or other arrangements. The percentage is therefore best read as a standardized view of the general MFN tariff schedule for manufactured goods.
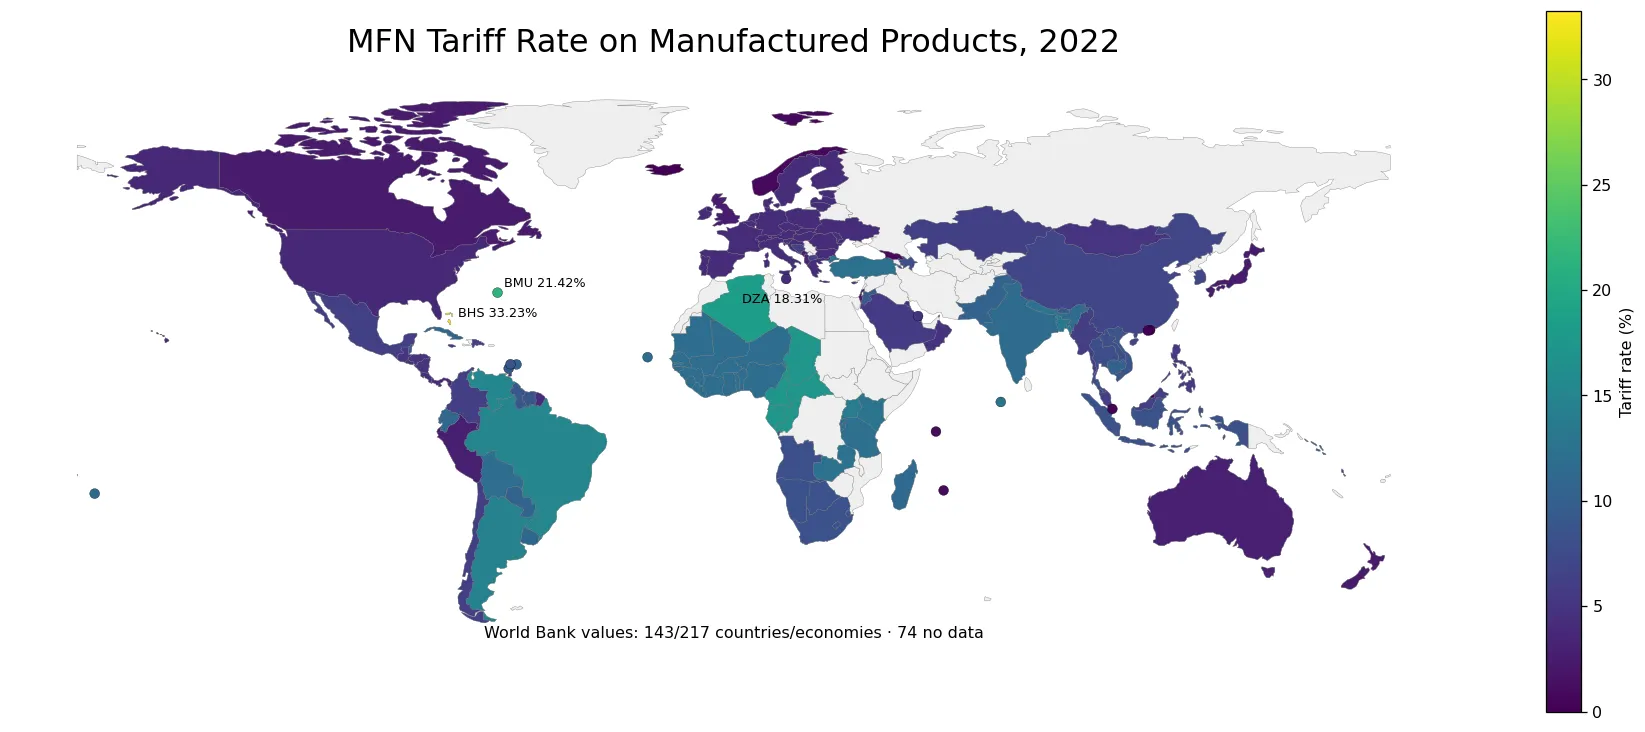
Table of Contents
The Bahamas and Bermuda stand well above the middle of the distribution
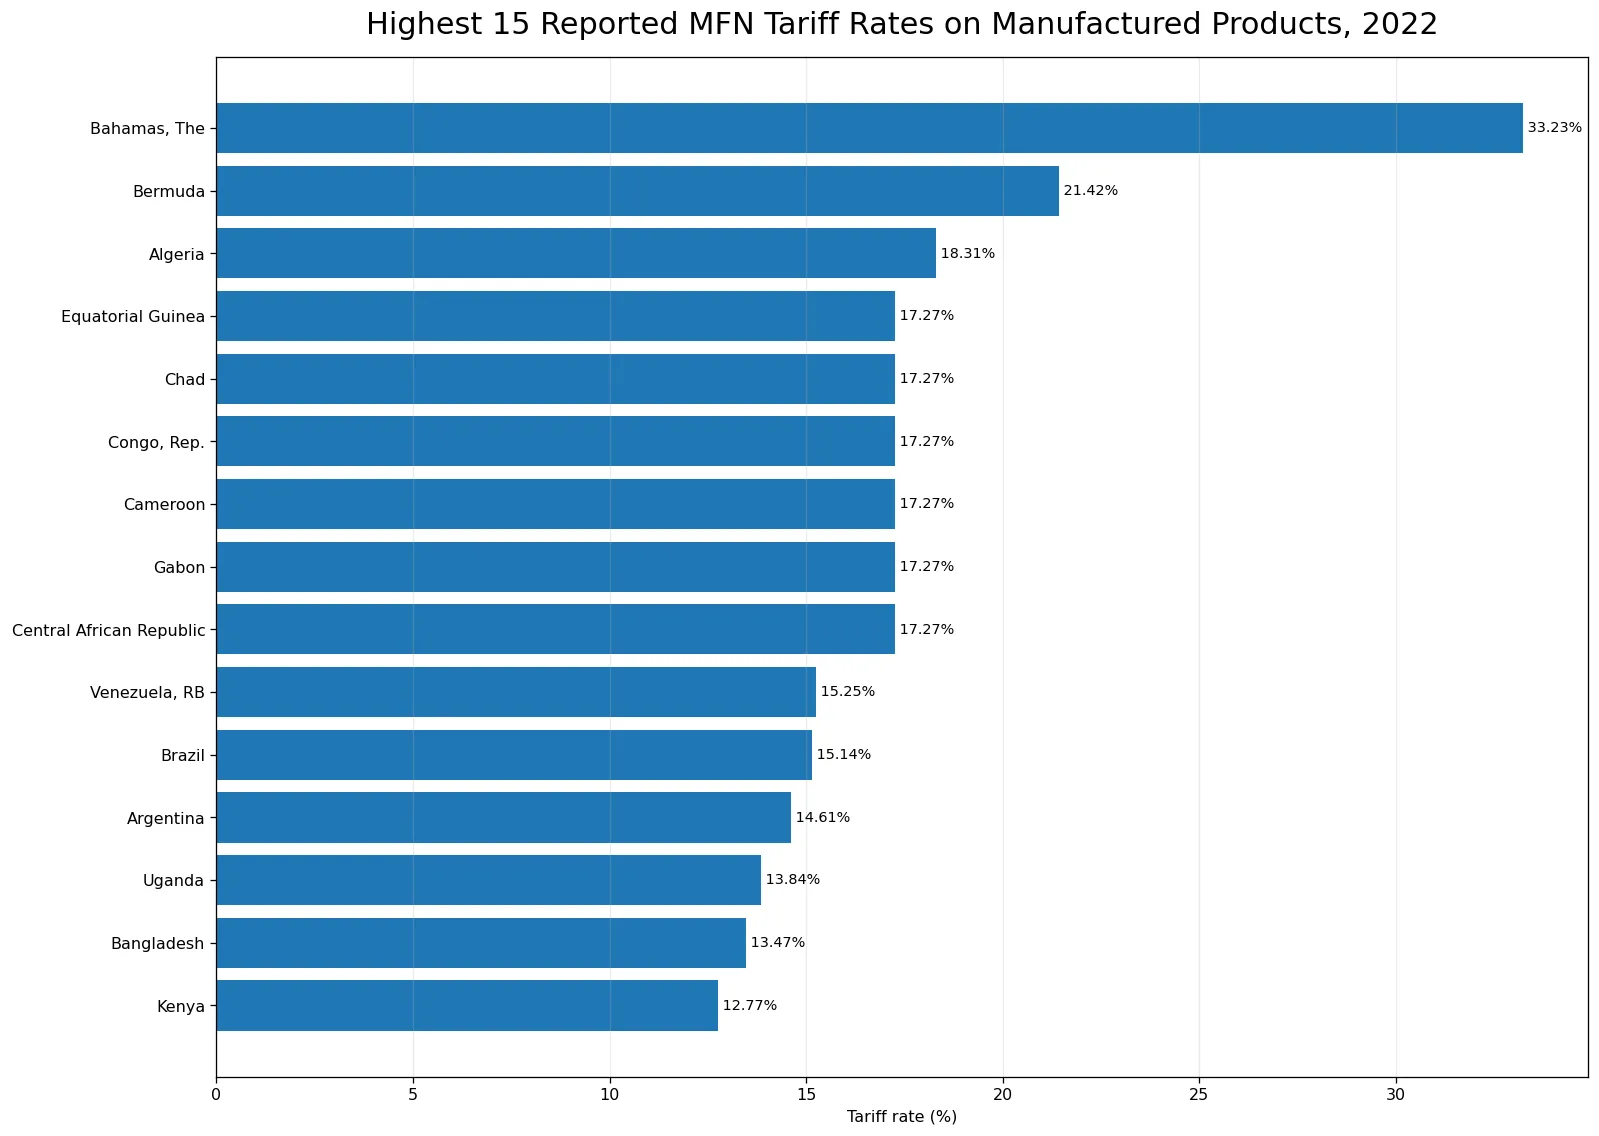
The Bahamas at 33.23% is more than five times the reported median of 6.37%. Bermuda is the only other observation above 20%, at 21.42%, while Algeria is third at 18.31%. Cameroon, the Republic of the Congo, the Central African Republic, Gabon, Equatorial Guinea, and Chad all report 17.27%. Venezuela is at 15.25%, Brazil at 15.14%, and Argentina at 14.61%. The upper group spans the Caribbean, Africa, and South America, so the highest values are not confined to one continent. The repeated values in neighboring countries are a visible geographic pattern, but this single series does not by itself establish which policy or institutional arrangements produced those similarities.
The median is 6.37%, while the mean is higher at 7.81%
Across the 143 reported observations, the mean is 7.81% and the median is 6.37%. The first quartile is 4.03% and the third quartile is 11.72%, so half of the reporting countries and economies lie roughly within that interval. 49 observations are at least 10%, and 11 are at least 15%, while 17 fall below 3%. The mean sits above the median because a relatively small upper tail—including The Bahamas and Bermuda—pulls the average upward. For that reason, the median and quartiles provide a better picture of the center of the distribution than the mean alone.
| Country/economy | Simple mean MFN tariff on manufactured products |
|---|---|
| Bahamas, The | 33.23% |
| Bermuda | 21.42% |
| Algeria | 18.31% |
| Central African Republic | 17.27% |
| Cameroon | 17.27% |
| Congo, Rep. | 17.27% |
| Gabon | 17.27% |
| Equatorial Guinea | 17.27% |
| Chad | 17.27% |
| Venezuela, RB | 15.25% |
A 17.27% cluster is visible across several Central African economies
Cameroon, the Central African Republic, Chad, the Republic of the Congo, Equatorial Guinea, and Gabon all report the same 17.27% value. Nearby African economies also include a number of double-digit observations: Uganda is at 13.84%, Kenya at 12.77%, Zambia at 12.54%, and Tanzania at 11.98%. Yet Africa is far from uniform. Mauritius is at 0.80% and Seychelles at 0.87%. The contrast shows why a continental label can hide more than it explains. The map is most useful when it is read at country level, where clusters of similar values and sharp differences between nearby economies can be seen at the same time.
A broad 4.03% band appears across many European countries
Twenty-six reporting European countries share the exact 4.03% value, including Austria, Belgium, Bulgaria, Czechia, Germany, Denmark, Spain, France, Italy, the Netherlands, Poland, Portugal, and Sweden. Other nearby economies differ: Norway reports 0.71%, the United Kingdom 2.69%, and Switzerland 3.72%. This pattern again shows both clustering and exceptions. The manufacturing MFN average is also only one part of a trade regime. A low value here does not imply that agricultural tariffs, services restrictions, product standards, or other non-tariff measures are equally low. The metric should remain tied to manufactured goods and the MFN tariff schedule it was designed to summarize.
Four reported 0.00% values are real observations, not missing data
Hong Kong SAR, China, Singapore, Macao SAR, China, and Iceland each have a published 2022 value of 0.00%. Those four observations are fundamentally different from the 74 country-and-economy entries without a value. Brunei Darussalam is next at 0.24%, followed by Norway at 0.71%, Georgia at 0.79%, Mauritius at 0.80%, and Seychelles at 0.87%. Treating missing entries as zeros would place countries with no reported observation in the same category as economies whose recorded MFN manufacturing average is genuinely zero. The map therefore keeps no-data areas distinct from the lowest measured values.
| Lowest reported country/economy | Simple mean MFN tariff |
|---|---|
| Hong Kong SAR, China | 0.00% |
| Iceland | 0.00% |
| Macao SAR, China | 0.00% |
| Singapore | 0.00% |
| Brunei Darussalam | 0.24% |
| Norway | 0.71% |
| Georgia | 0.79% |
| Mauritius | 0.80% |
| Seychelles | 0.87% |
| Israel | 2.21% |
A simple mean can differ sharply from the tariff experienced by actual trade flows
Because every tariff line has equal weight, a rarely imported product can influence the simple mean just as much as a product imported in very large volumes. A trade-weighted average answers a different question by giving more weight to products with larger import values. Preferential rates add another layer: an importer may face a lower rate because of a bilateral or regional trade agreement even when the MFN schedule is higher. This is why the indicator should not be described as the average tariff actually paid on manufactured imports. It is a standardized summary of the MFN schedule across manufactured-product lines.
Individual country comparisons belong inside the wider distribution
The Republic of Korea records 7.06% in 2022, a little above the reported median of 6.37%. The United States is at 3.70% and Japan at 2.49%. These comparisons are useful for locating familiar economies within the broader range, not for scoring the quality of their trade policies. A single MFN average cannot capture the sector mix of tariffs, the scale of imports, preferential agreements, exemptions, or non-tariff measures. Two economies with similar averages may have very different tariff structures at the product level, and two economies with different simple means may face closer effective rates on the goods they actually trade.
What the 2022 map can and cannot establish
The 2022 map can show where reported manufacturing MFN tariff averages are high or low, where neighboring economies share identical or similar values, and how wide the distribution is. It cannot determine the effect of tariffs on inflation, manufacturing competitiveness, growth, consumer prices, or trade balances. Those outcomes depend on many additional factors, including product composition, domestic production, exchange rates, supply chains, demand, preferential agreements, and firms’ ability to switch suppliers. The map is therefore a descriptive starting point for comparing tariff structures rather than a causal measure of the economic consequences of tariffs.
Source and calculation notes
The source is the World Bank indicator TM.TAX.MANF.SM.FN.ZS for 2022, reported in percent. Aggregate regional and income-group entries are excluded, leaving 217 countries and economies in the geographic frame. Of those, 143 have a value and 74 have no reported observation. The mean (7.81%), median (6.37%), first quartile (4.03%), third quartile (11.72%), rankings, and threshold counts are calculated from the 143 reported values only. Missing values are never replaced with zero, while the four published 0.00% observations remain genuine values. Historical observations can be revised by the source, so a later refresh of the same indicator may produce small differences.
Frequently Asked Questions
Which economy had the highest simple mean MFN tariff on manufactured products in 2022?
The Bahamas had the highest reported value at 33.23%, followed by Bermuda at 21.42% and Algeria at 18.31%.
Does the simple mean weight products by their import value?
No. Each tariff line receives equal weight. A trade-weighted tariff average is a different measure.
Is an MFN tariff the same as a preferential free-trade-agreement tariff?
Not necessarily. Preferential agreements can apply lower rates to eligible trading partners than the general MFN schedule.
Are countries without a value treated as 0%?
No. 74 entries have no 2022 observation and remain no data; the four published 0.00% values are kept as genuine observations.
Related Articles
Green Map creates custom-edited map images using open geographic data sources such as geoBoundaries, Natural Earth, OpenStreetMap, and government open data. These maps are edited visual materials, not raw data files, and are provided for education, documents, presentations, and graphic reference.