World Bank indicator TM.VAL.MRCH.R2.ZS measures the share of a reporting economy’s merchandise imports that comes from low- and middle-income economies in the World Bank Europe and Central Asia region. It is a partner-composition measure. It does not measure the absolute size of imports, imports as a share of GDP, or the trade balance.
The latest-available file contains 205 countries and areas. 199 observations are from 2023; six are older latest-available values and are marked with hollow dark rings on the map. Among the 199 observations dated 2023, the median share is 1.66% and the unweighted mean is 4.32%. The large gap between the mean and median reflects a small group of very high observations.
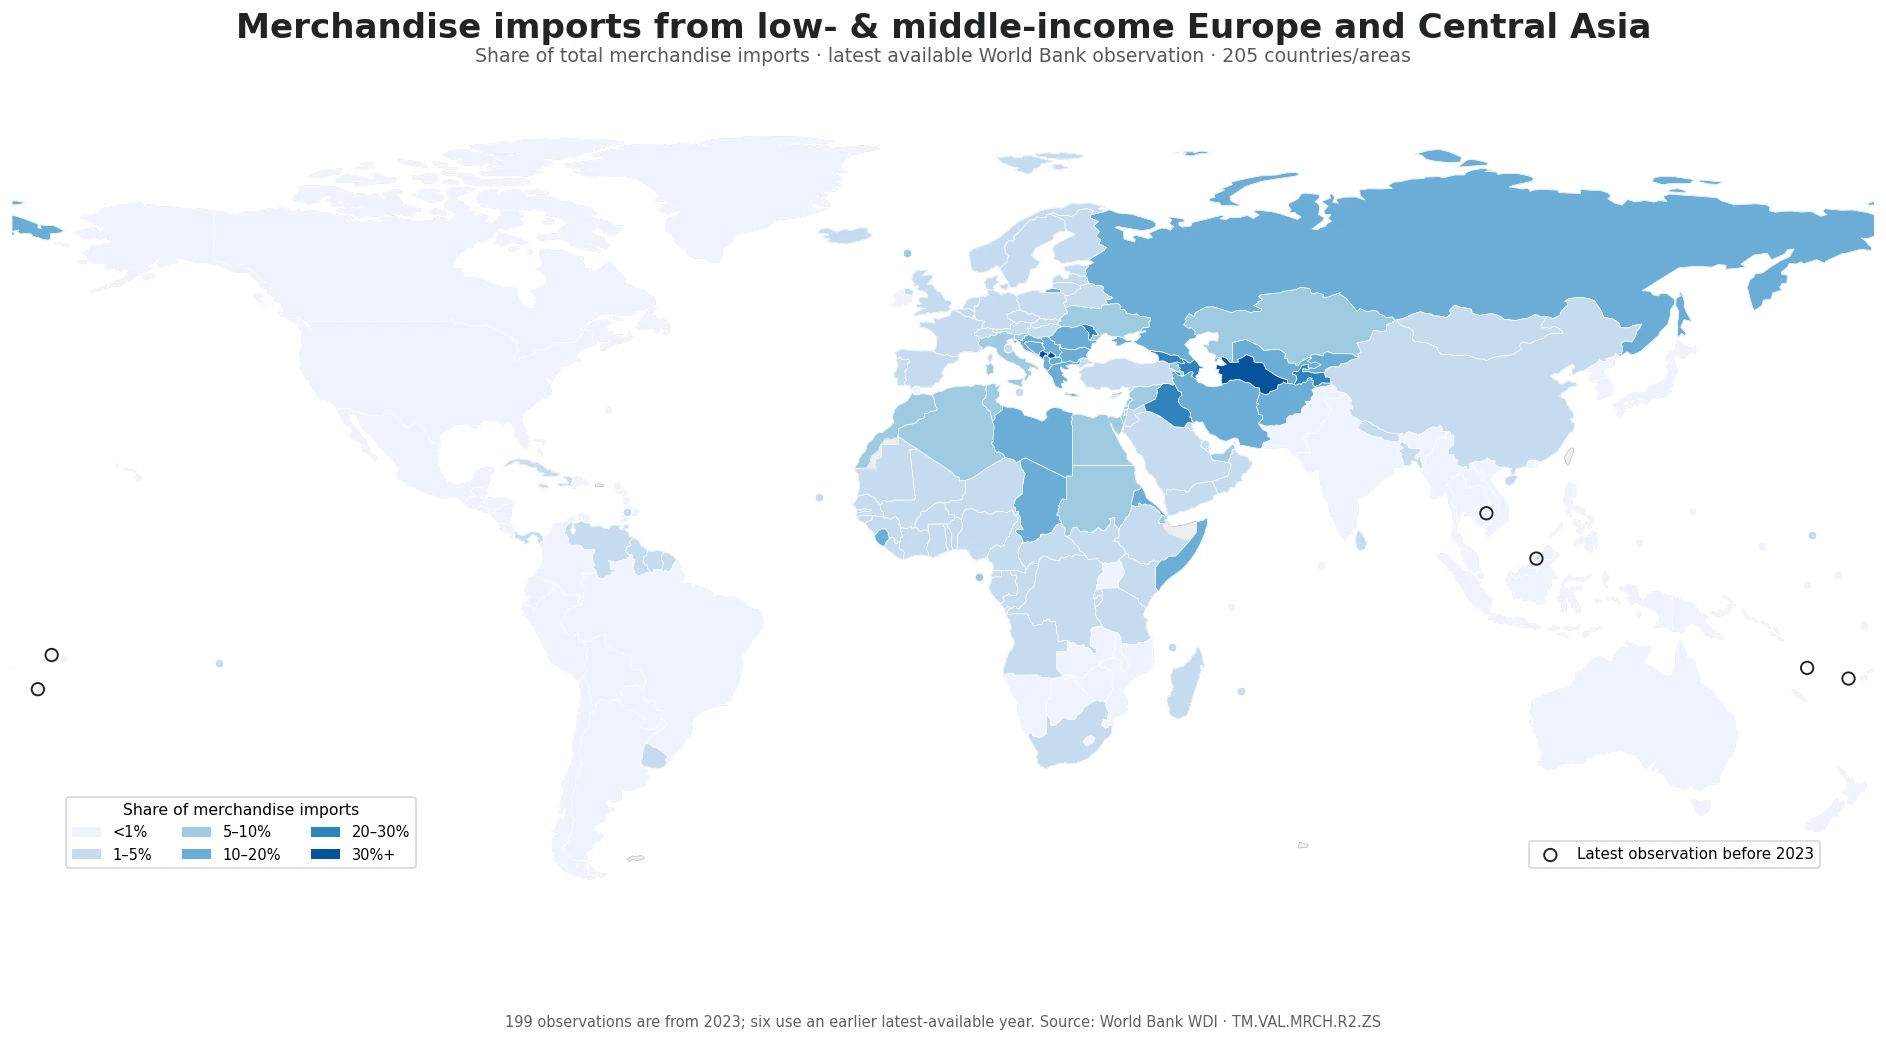
Table of Contents
What the indicator measures
The numerator is the value of merchandise imported by the reporting economy from low- and middle-income economies classified in Europe and Central Asia. The denominator is that reporting economy’s total merchandise imports. A value of 20% therefore means that roughly one-fifth of merchandise imports by value came from this specific partner group. It does not mean that imports equal 20% of GDP or that the economy is 20% dependent on foreign goods overall.
The group definition matters. The indicator is not the share imported from every economy in geographic Europe and Central Asia. It uses the World Bank income and regional classification embedded in the series. The World Bank also states that the measure is computed only when at least half of the economies in the partner group have non-missing data. The ratio is therefore best read as a standardized partner-group share rather than a full bilateral trade matrix.
Most 2023 observations are below 5%
The distribution is strongly right-skewed. Of 199 observations dated 2023, 73 are below 1% and 82 fall between 1% and 5%. Together, 155 countries and areas, about 78% of the 2023 sample, are below 5%. Only 26 are at or above 10%, eight are at or above 20%, and three are at or above 30%.
| 2023 share | Countries/areas |
|---|---|
| Below 1% | 73 |
| 1–5% | 82 |
| 5–10% | 18 |
| 10–20% | 18 |
| 20–30% | 5 |
| 30% or more | 3 |
That distribution explains why the mean is more than twice the median. A few countries with shares in the 20% to 45% range pull the average upward. For a typical-country comparison, the median and the band counts are more informative than the mean alone. The map then shows where the high-share exceptions are geographically concentrated.
The highest shares cluster in Central Asia, the Caucasus and the Balkans
Turkmenistan has the highest 2023 observation at 45.24%. Kosovo follows at 32.21%, Montenegro at 31.56%, Tajikistan at 28.65%, and Georgia at 26.61%. Iraq is also high at 25.71%, while Moldova records 24.19% and Azerbaijan 23.37%. The top of the distribution is therefore heavily concentrated in and around Europe and Central Asia rather than spread evenly across the world.
| Rank | Country/area | Share of merchandise imports |
|---|---|---|
| 1 | Turkmenistan | 45.24% |
| 2 | Kosovo | 32.21% |
| 3 | Montenegro | 31.56% |
| 4 | Tajikistan | 28.65% |
| 5 | Georgia | 26.61% |
| 6 | Iraq | 25.71% |
| 7 | Moldova | 24.19% |
| 8 | Azerbaijan | 23.37% |
| 9 | Uzbekistan | 19.58% |
| 10 | Russian Federation | 19.38% |
The pattern is descriptive, not causal. Geographic proximity may matter, but the series does not identify why trade is concentrated in this partner group. Transport links, border arrangements, product mix, energy trade, existing commercial networks, tariffs and other policies could all affect the result. Those mechanisms require separate bilateral or product-level evidence.
Neighboring economies can have very different shares
The map also shows sharp differences among nearby economies. Turkmenistan is at 45.24%, compared with 19.38% for the Russian Federation and 9.20% for Kazakhstan. In southeastern Europe, Montenegro is at 31.56%, Bosnia and Herzegovina 17.61%, North Macedonia 15.37%, Croatia 11.44%, and Serbia 11.11%. Ukraine is 9.91%.
Western European economies generally have much lower shares. Germany is 2.75%, the United Kingdom 2.27%, and France 2.12%. Italy is higher at 6.01%, but still far below the leading Central Asian, Caucasus and Balkan observations. The indicator therefore reveals substantial variation within Europe itself, not simply a Europe-versus-rest-of-world divide.
| Country/area | 2023 share |
|---|---|
| Turkmenistan | 45.24% |
| Kosovo | 32.21% |
| Montenegro | 31.56% |
| Georgia | 26.61% |
| Russian Federation | 19.38% |
| Ukraine | 9.91% |
| Kazakhstan | 9.20% |
| Turkiye | 4.23% |
| Germany | 2.75% |
| France | 2.12% |
| Italy | 6.01% |
| China | 1.74% |
| United States | 0.68% |
| Japan | 0.31% |
Large economies outside the region mostly record small shares
Among several major economies outside Europe and Central Asia, China records 1.74%, Brazil 0.86%, India 0.73%, the United States 0.68%, Canada 0.55%, Mexico 0.36%, and Japan 0.31%. These low shares do not imply small import markets. They mean that a relatively small portion of each economy’s merchandise imports comes from the specific low- and middle-income Europe-and-Central-Asia partner group.
Some economies near the region have much larger values. Iraq is at 25.71%, Libya 18.69%, and the Islamic Republic of Iran 13.00%. Even there, however, the values vary enough that a regional average would hide important country-level differences. The map is useful precisely because it keeps the reporting economy as the geographic unit.
A high share is not the same as high import dependence
The denominator is total merchandise imports, not GDP, domestic consumption or total trade. An economy can have a high partner-group share even if its overall import bill is modest, provided a large fraction of those imports comes from this group. Conversely, a very large importing economy can have a low percentage when its suppliers are concentrated in other regions or income groups.
The series also says nothing by itself about the trade balance because exports are not in the calculation. It is not an import-growth measure, and it does not identify product concentration. Assessing supply-chain dependence would require additional evidence such as bilateral partner shares, product-level imports, domestic production, substitution options and inventories. This indicator is most useful as a first map of where the partner group matters most in the import mix.
Six latest observations predate 2023
Six of the 205 latest-available observations are older than 2023: Brunei Darussalam is from 2022, Cambodia from 2020, Fiji from 2017, Tonga and Vanuatu from 2011, and Samoa from 2009. They remain on the map for coverage but are marked separately and are excluded from the 2023 distribution and ranking statements above. Treating them as if they were 2023 observations would erase an important time difference in trade patterns.
| Country/area | Latest year | Share |
|---|---|---|
| Samoa | 2009 | 0.01% |
| Tonga | 2011 | 0.20% |
| Vanuatu | 2011 | 0.27% |
| Fiji | 2017 | 0.12% |
| Cambodia | 2020 | 0.02% |
| Brunei Darussalam | 2022 | 4.41% |
Three checks before comparing countries
- Check the denominator. The percentage is a share of merchandise imports, not imports as a share of GDP or total trade.
- Check the partner definition. The numerator covers low- and middle-income economies in the World Bank Europe and Central Asia group, not every economy geographically located in the region.
- Check the observation year. 199 values are from 2023, while six are older latest observations and should not be mixed into a strict same-year ranking.
The source is the World Bank World Development Indicators series TM.VAL.MRCH.R2.ZS. The map and tables preserve the reported observation year for each country or area. No missing or older observation is converted to zero, and the 2023 summary statistics use only the 199 records actually dated 2023.
Frequently Asked Questions
Does a high percentage mean an economy has a large total import bill?
No. The indicator is a composition share of merchandise imports. It does not measure the absolute value of imports or imports relative to GDP.
Does the numerator include every economy in Europe and Central Asia?
No. It covers low- and middle-income economies in the World Bank Europe and Central Asia partner group, according to the indicator definition.
Why are some map values older than 2023?
The file uses each economy’s latest non-empty observation. 199 values are dated 2023 and six are older; the older observations are marked separately and excluded from strict 2023 rankings.
Related Articles
Green Map creates custom-edited map images using open geographic data sources such as geoBoundaries, Natural Earth, OpenStreetMap, and government open data.
These maps are edited visual materials, not raw data files, and are provided for education, documents, presentations, and graphic reference.