A country can be a major merchandise exporter without sending much of its trade to nearby low- and middle-income markets, while a smaller exporter can have a very high regional destination share. World Bank indicator TX.VAL.MRCH.WR.ZS focuses on that composition question. It measures the percentage of a reporting economy’s total merchandise exports that goes to low- and middle-income economies located within the same region. The dataset used here contains 202 economies, all observed in 2023, so the comparison does not mix different latest-observation years.
Across the 202 observations, the median is 13.04% and the simple mean is 21.22%. The gap between them is substantial because the distribution has a long upper tail. The first quartile is 4.69% and the third quartile is 31.39%, while the full range runs from 0.02% to 95.89%. In other words, a typical observation is much closer to the low teens than to the 20% global mean, but a small group of economies records very large within-region shares.
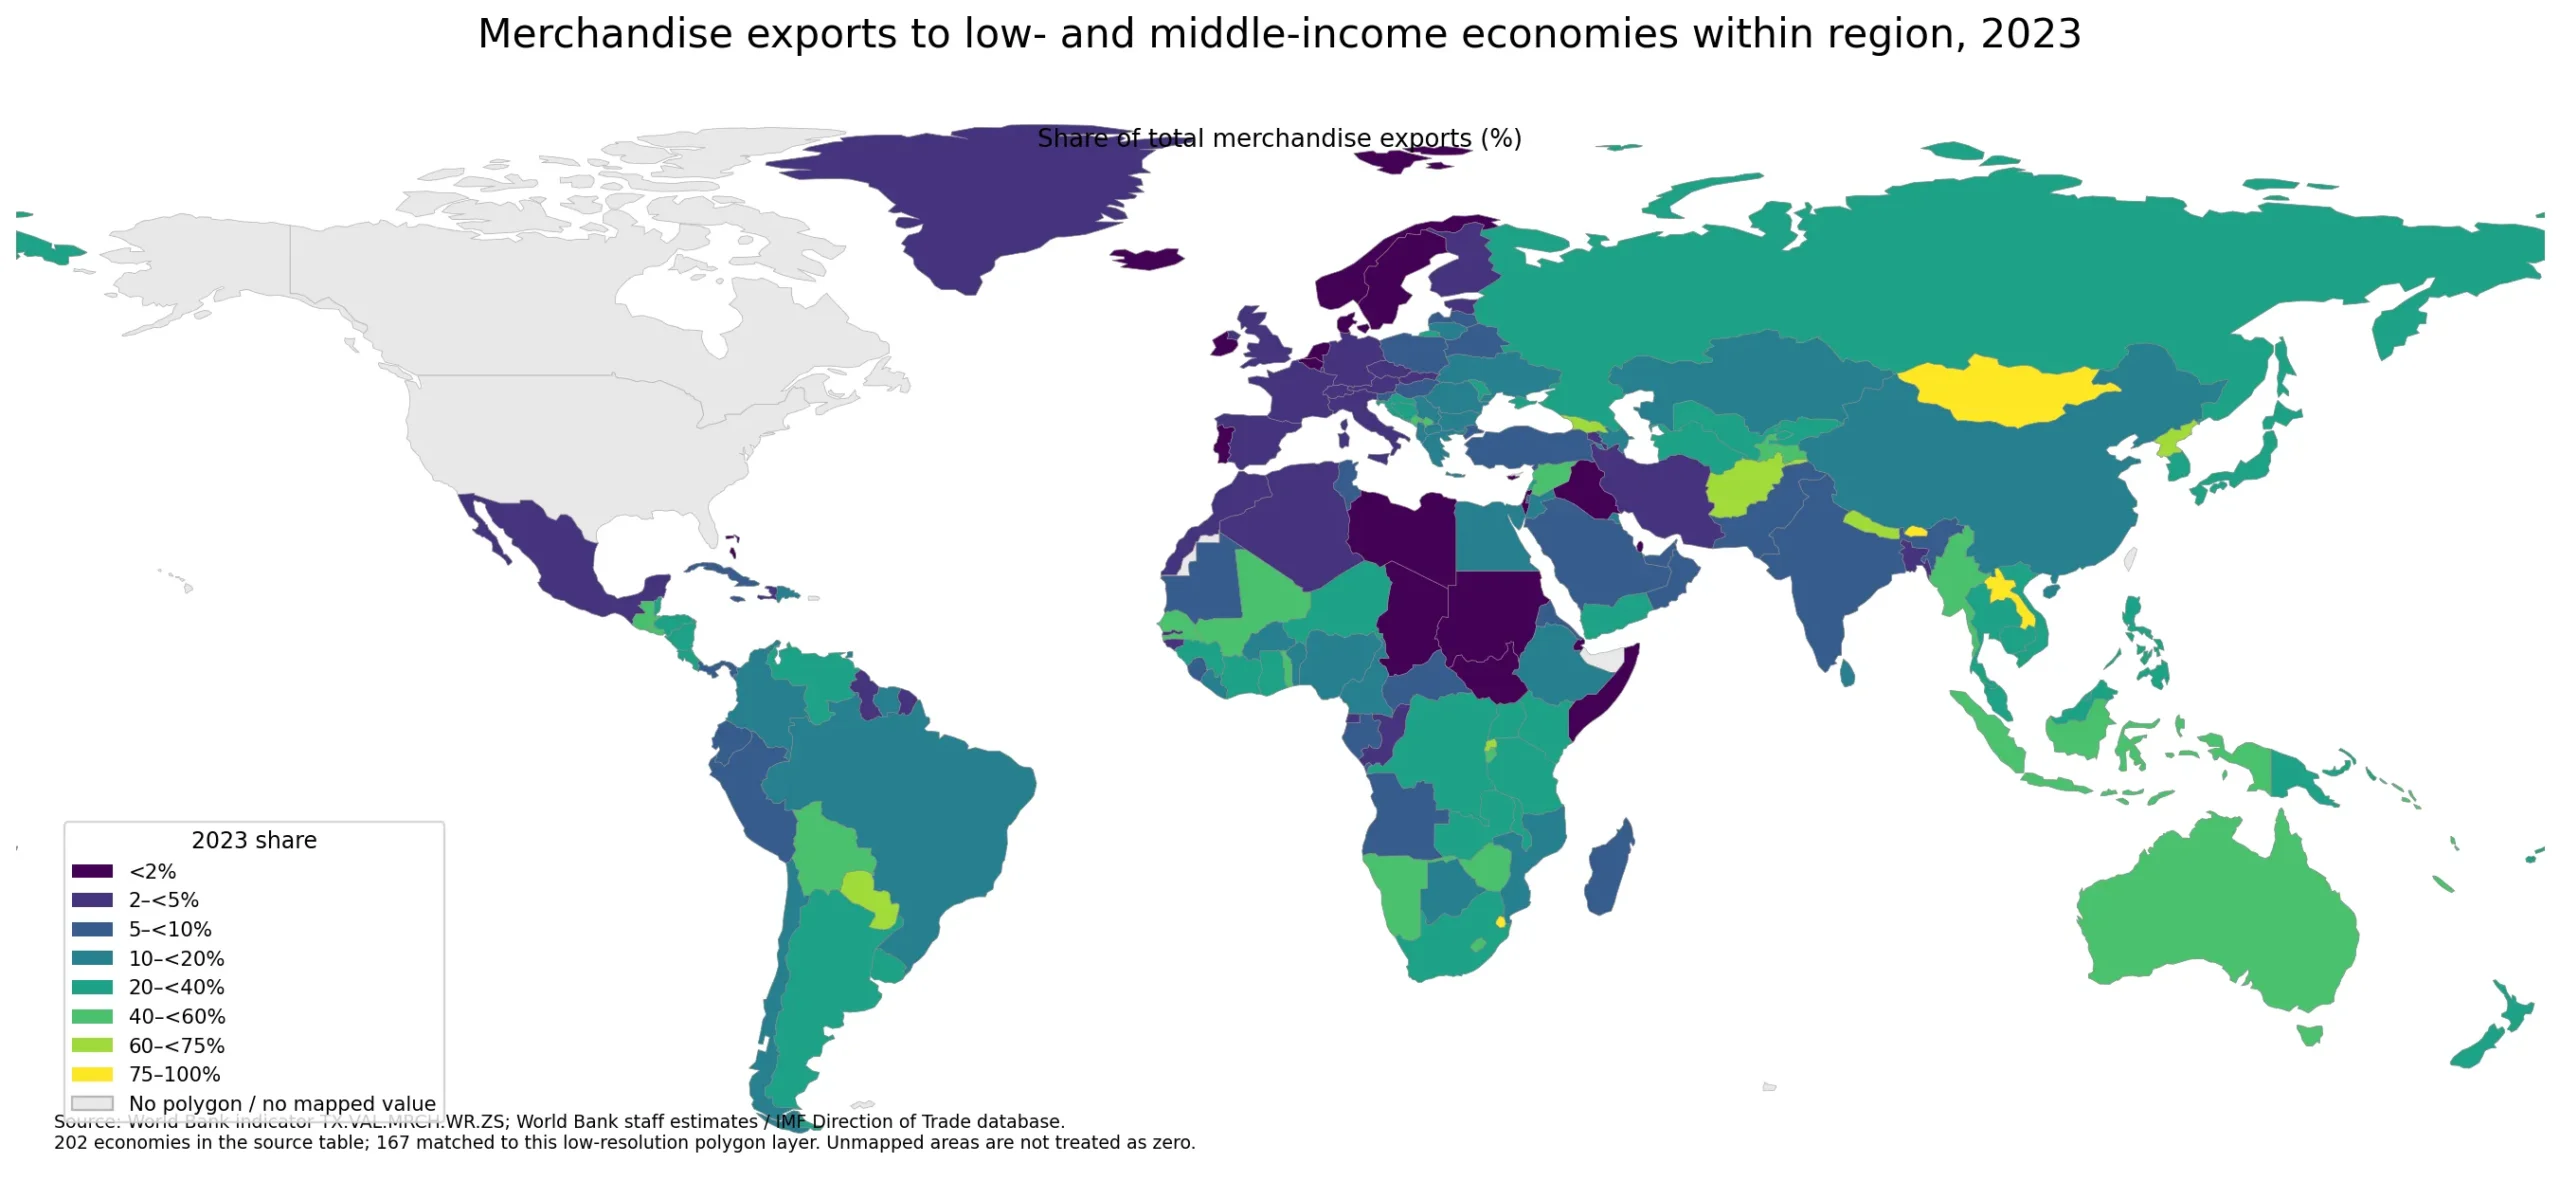
Table of Contents
What the indicator measures
The denominator is the reporting economy’s total merchandise exports. The numerator is merchandise exports sent to economies that are both low or middle income and located within the same World Bank region for this indicator. A value of 40% therefore means that roughly two-fifths of the reporter’s merchandise-export value went to that particular partner group. It is a destination-share measure, not an export-value ranking.
This distinction matters when comparing large and small exporters. Two economies can both report 30% while having merchandise exports that differ by tens or hundreds of billions of dollars. The percentage answers a portfolio question—how important this partner group is within total goods exports—rather than a scale question about how much was exported in absolute terms.
The World Bank data page attributes the series to World Bank staff estimates and the IMF Direction of Trade database. The indicator belongs to a family of trade-destination measures that separate partner economies by income group and region. It should not be substituted for total exports, exports as a share of GDP, services exports, product concentration, or the trade balance.
The global distribution is concentrated at low shares with a long upper tail
24 of 202 economies are below 2%, 55 are below 5%, and 87 are below 10%. At the other end, 37 are at or above 40%, 14 reach at least 60%, and only 7 are at or above 75%. The largest group in the fixed map bands is the 20% to under 40% range, but the combined number below 20% is much larger.
That shape explains why the mean should not be treated as a typical country value. A handful of readings in the 80% and 90% range pull the average upward, while half the observations are at or below 13.04%. A map is particularly useful here because it shows where the upper-tail observations occur, but the quartiles and counts are necessary to keep those visually striking high values in perspective.
Bhutan, Mongolia and Eswatini are at the top of the 2023 distribution
Bhutan records the highest share at 95.89%, followed by Mongolia at 91.71% and Eswatini at 90.44%. Guam is at 84.72% and Lao PDR at 83.98%. These percentages indicate that the specified within-region low- and middle-income partner group accounted for most merchandise exports from those reporting economies in 2023. They do not establish whether total export performance was strong or weak.
| Economy | 2023 share |
|---|---|
| Bhutan | 95.89% |
| Mongolia | 91.71% |
| Eswatini | 90.44% |
| Guam | 84.72% |
| Lao PDR | 83.98% |
The top observations are not confined to one continent, which is a useful warning against reading the map as a simple continental gradient. Very high values appear in South Asia, East and Southeast Asia, southern Africa, and a Pacific territory. The more informative spatial feature is often the contrast between neighboring economies rather than the average color of a broad region.
Neighboring economies can sit in very different bands
South Asia contains some of the sharpest contrasts. Bhutan is at 95.89% and Nepal at 70.54%, while India is 5.71%. Afghanistan is 69.93%, compared with Pakistan at 6.94%. In East Asia, Mongolia reaches 91.71% while China is 13.69%. In mainland Southeast Asia, Lao PDR is 83.98%, compared with 25.92% for Viet Nam and 32.13% for Thailand.
| Comparison | Higher share | Nearby comparison |
|---|---|---|
| South Asia | Bhutan 95.89% | India 5.71% |
| South Asia | Afghanistan 69.93% | Pakistan 6.94% |
| East Asia | Mongolia 91.71% | China 13.69% |
| Southeast Asia | Lao PDR 83.98% | Viet Nam 25.92% |
| Southern Africa | Eswatini 90.44% | South Africa 28.31% |
| South America | Paraguay 66.04% | Brazil 12.49% |
Southern Africa shows the same pattern. Eswatini is 90.44% and Namibia 55.35%, whereas South Africa is 28.31% and Botswana 15.53%. In South America, Paraguay is 66.04%, compared with 30.59% for Argentina and 12.49% for Brazil. These gaps demonstrate that physical proximity by itself is not enough to predict the destination mix. The indicator does not identify the mechanism behind the difference, so explanations involving products, logistics, trade agreements or dominant partners require separate evidence.
A very low share does not mean merchandise exports are small
At the bottom of the reported distribution are Gibraltar at 0.02%, Libya at 0.04%, The Bahamas at 0.10%, Chad at 0.27% and the Faroe Islands at 0.57%. Ireland is 0.62%, Qatar 0.72% and Iceland 0.73%. These readings only say that the specified partner group makes up a very small fraction of total merchandise exports. They say nothing about the total dollar value of those exports.
| Economy | 2023 share |
|---|---|
| Gibraltar | 0.02% |
| Libya | 0.04% |
| The Bahamas | 0.10% |
| Chad | 0.27% |
| Faroe Islands | 0.57% |
The rest of an economy’s exports cannot be assigned to a single category simply by subtracting this percentage from 100. The remaining share may go to high-income partners in the same region, low- and middle-income partners outside the region, or high-income partners elsewhere. Companion indicators are needed to separate those destinations.
Europe and the Americas also contain large internal differences
Many European economies are in the low bands: Norway is 1.11%, Portugal 1.58%, Sweden 1.81%, Denmark 2.00%, France 2.94%, Germany 3.52% and Italy 4.14%. Georgia, by contrast, is at 61.99%. The difference is too large to summarize Europe with one regional statement, and it reinforces the value of a country-level map.
The Americas are similarly mixed. Paraguay records 66.04%, El Salvador 54.29%, Guatemala 46.63%, Uruguay 37.81% and Argentina 30.59%. Brazil is 12.49%, Chile 13.40%, Peru 9.27%, Ecuador 9.50% and Mexico 3.35%. The resulting patchwork on the map is a direct reflection of destination-share differences, not a measure of export success or economic size.
Small islands and territories are underrepresented by the polygon map
The source table has numeric values for all 202 economies, but only 167 can be matched to the low-resolution polygon layer used here. Guam, Hong Kong SAR, Macao SAR, and a number of Caribbean and Pacific island economies and territories do not have a separate polygon or compatible code in this boundary file. They stay in the statistical calculations even when they are not visibly colored.
This limitation is especially important because Guam has an 84.72% value and several other small economies also sit far from the global median. A blank or gray area on the map is therefore not evidence of a zero share. For small territories, the source table and ranked values are more reliable than a low-resolution world map.
What the percentage cannot tell you
- It does not measure the absolute dollar value of merchandise exports.
- It does not identify the products being exported to the partner group.
- It does not measure export growth, trade balance, profitability or GDP contribution.
- It does not tell whether a high or low share is economically preferable.
- It does not explain why neighboring economies can have very different destination shares.
For those questions, the natural next step is to pair this series with total merchandise exports, product-level trade data, exports to high-income economies, and exports to low- and middle-income economies outside the region. Used on its own, TX.VAL.MRCH.WR.ZS is best understood as a clean snapshot of destination composition in 2023.
Source and calculation basis
The source is the World Bank indicator TX.VAL.MRCH.WR.ZS. The World Bank identifies World Bank staff estimates and the IMF Direction of Trade database as the underlying sources. All 202 observations used in this comparison are for 2023, and the unit is percent of total merchandise exports.
Frequently Asked Questions
What does a 40% value mean?
It means that about 40% of the reporting economy’s 2023 merchandise exports went to low- and middle-income economies within the same region. It is a destination-share measure, not an absolute export value.
Are all 202 observations from 2023?
Yes. Every observation used in this comparison is dated 2023, so the map does not mix different latest-observation years.
Does a higher share mean stronger export performance?
No. A higher share only means the specified partner group accounts for more of total merchandise exports. Export scale, growth, trade balance and diversification require other indicators.
Do gray or missing polygons mean the value is zero?
No. Some small islands and territories do not have a matching polygon in the low-resolution boundary layer. Their source values remain in the statistics and were not converted to zero.
Related Articles
Green Map creates custom-edited map images using open geographic data sources such as geoBoundaries, Natural Earth, OpenStreetMap, and government open data. These maps are edited visual materials, not raw data files, and are provided for education, documents, presentations, and graphic reference.