Public tertiary institutions spend money on very different kinds of needs. Salaries, teaching materials, administration, and services used during the year are recurring costs, while buildings, major renovations, and large equipment can serve institutions for many years. The World Bank indicator SE.XPD.CTER.ZS measures current education expenditure as a percentage of total direct expenditure in public tertiary institutions. In the World Bank definition, current expenditure is consumed within the current year and would need to be renewed if the same service is required the following year. It includes staff compensation and other current costs such as teaching materials, ancillary services, and administration. Financial aid to students and other transfers are excluded from direct institutional expenditure.
The comparison below uses the latest non-empty observation for 168 economies in the supplied World Bank series. Those observations do not share one reference year. They range from 2001 to 2024, and only 38 economies have a latest observation from 2023 or 2024. Another 74 economies have a latest value from 2019 or earlier. The result is therefore a latest-available cross-country view, not a synchronized 2024 ranking. The observation year should always be read alongside the percentage.
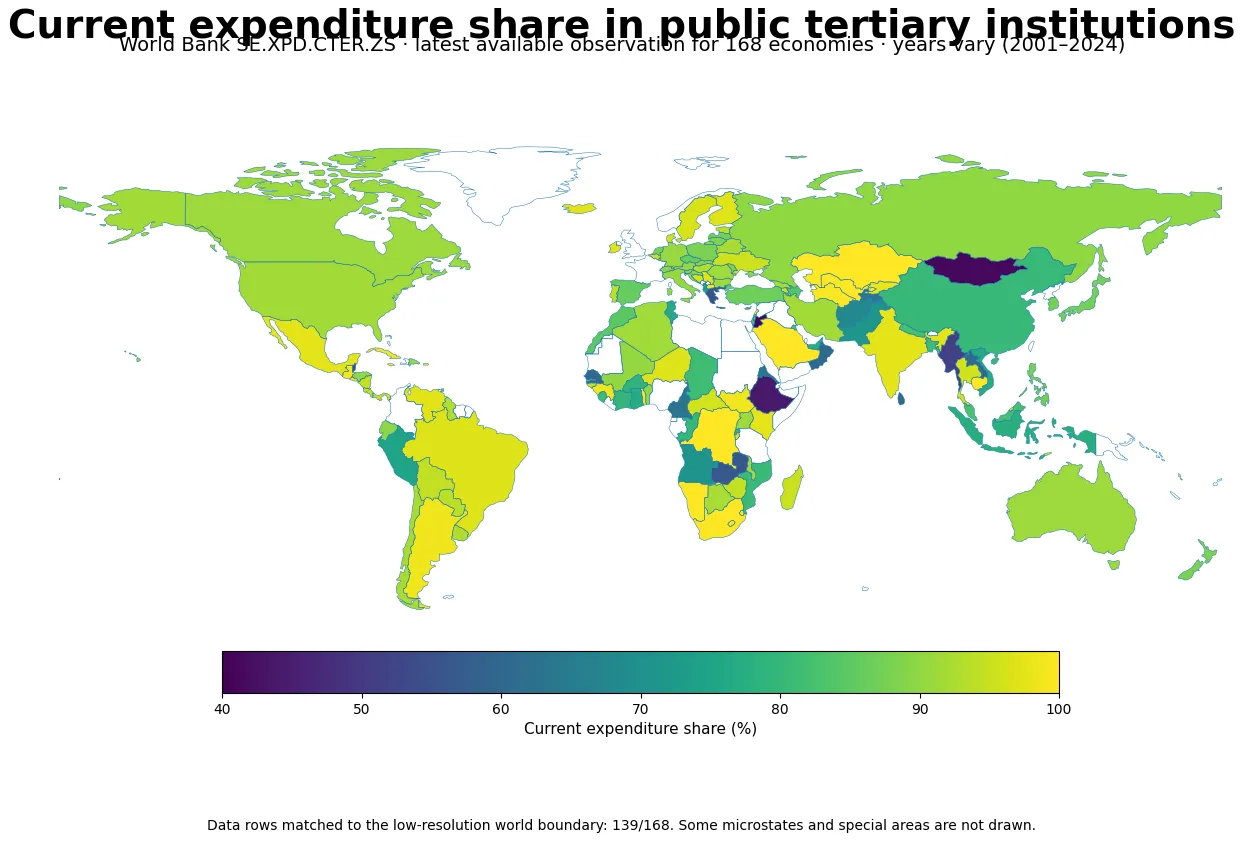
Table of Contents
What the percentage actually measures
This is not a measure of how much a government spends on tertiary education in total. The numerator is current expenditure in public tertiary institutions and the denominator is total direct expenditure in those institutions. A value of 95%, for example, means that most direct institutional spending in the observation year was classified as current spending: compensation, teaching inputs, administration, and other costs that are used within the year. A lower percentage does not automatically mean that the tertiary system receives less money. It means that current expenditure represents a smaller share of direct institutional expenditure.
That distinction matters because the spending mix can change for reasons that have little to do with the quality of education. A year with major campus construction, laboratory upgrades, or large equipment purchases can produce a lower current-expenditure share. A year with limited capital investment can push the ratio closer to 100% even if the overall education budget is modest. The indicator is therefore best understood as a measure of spending composition, not as a score for funding adequacy, institutional performance, or education quality.
The latest observation year varies widely
The most recent reported value is quite recent for some economies and much older for others. Sixteen observations come from 2024, 22 from 2023, and 39 from 2022. Seventeen more are from 2020 or 2021. The remaining 74, equal to 44.0% of the full dataset, are from 2019 or earlier. Two economies can therefore have similar percentages on the map while referring to very different periods in their education-finance systems.
| Observation period | Economies | Share of all observations |
|---|---|---|
| 2023–2024 | 38 | 22.6% |
| 2022 | 39 | 23.2% |
| 2020–2021 | 17 | 10.1% |
| 2019 or earlier | 74 | 44.0% |
A mixed-year map is useful for exploring where the latest reported spending structures look different, but it is not the right format for a strict same-year league table. If the question is about current policy performance, the sample should be restricted to a common year or a narrow period whenever coverage permits. If the question is simply where each economy’s latest reported structure stands, the latest-available approach is useful as long as the year is displayed and older observations are not presented as current conditions.
Distribution across 168 latest observations
Across all 168 latest observations, the median current-expenditure share is 91.90% and the mean is 88.07%. The distribution is concentrated at high percentages: 100 economies are at or above 90%, 66 are at or above 95%, and 31 are at or above 99%. At the other end, 33 economies are below 80%, 17 are below 70%, and 9 are below 60%. The range runs from 41.16% to 100%.
- 90% or higher: 100 economies
- 95% or higher: 66 economies
- 99% or higher: 31 economies
- Below 80%: 33 economies
- Below 70%: 17 economies
- Below 60%: 9 economies
The mean is lower than the median because a relatively small group of values in the 40% to 70% range pulls the average downward, while many observations cluster in the 90s. For this indicator, the median and the distribution across bands are often more informative than the mean alone. A mean near 88% should not be read as if most economies sit close to 88%; many are substantially higher, while a smaller set is much lower.
What the lower latest-available values show
| Economy | Observation year | Current-expenditure share |
|---|---|---|
| Jordan | 2024 | 41.16% |
| Mongolia | 2017 | 41.35% |
| Ethiopia | 2014 | 43.76% |
| Myanmar | 2019 | 51.10% |
| Belize | 2001 | 53.04% |
| Antigua and Barbuda | 2018 | 53.07% |
| Greece | 2022 | 55.68% |
| Zambia | 2016 | 56.23% |
| Senegal | 2022 | 59.93% |
| Oman | 2024 | 60.16% |
Jordan has the smallest latest value in this extract at 41.16% in 2024. Mongolia is close at 41.35%, although its observation is from 2017, and Ethiopia’s 43.76% value is from 2014. These percentages show that current spending made up a relatively smaller portion of direct institutional expenditure in those observation years. They do not, by themselves, tell us exactly which non-current items account for the difference or whether the overall tertiary-education budget was large or small.
Older observations deserve particular caution. Belize’s latest value in the dataset is from 2001, while several other low observations date from the mid-2010s. Those figures can still be useful for identifying the last reported structure, but they should not be described as the economy’s present 2026 position. In practical analysis, the observation year is not a minor footnote; it is part of the value’s meaning.
A value near 100% is not a quality score
Several economies have latest observations at 100%, including Aruba in 2016, Bermuda in 2023, Jamaica in 2024, Kazakhstan in 2019, Cambodia in 2014, Saint Lucia in 2023, the Marshall Islands in 2022, and Namibia in 2014. South Africa’s 2024 observation is 99.9998%, effectively at the same end of the scale. These values indicate that almost all reported direct institutional expenditure in those observations was classified as current expenditure.
That does not mean the tertiary system is better funded or more efficient. A very high current-spending share may simply mean that capital spending was limited in that year or recorded through a different financing route. In a system with aging facilities, a persistently high current share could coexist with underinvestment in buildings or equipment. In another system with recently completed campuses, a high current share could be entirely unsurprising. Interpreting the ratio requires information about absolute spending, capital projects, enrollment, and the institutional accounting framework.
A same-year look at the 2024 observations
Restricting the comparison to 2024 reduces the timing problem but leaves only 16 economies. Within that smaller group, the median is 91.90% and the mean is 85.46%. The spread is still wide. Jordan is at 41.16% and Oman at 60.16%, while Guatemala is at 99.49%, South Africa at 99.9998%, and Jamaica at 100%. Even in the same year, public tertiary institutions can have very different mixes of current and other direct expenditure.
| Economy with a 2024 observation | Current-expenditure share |
|---|---|
| Jordan | 41.16% |
| Oman | 60.16% |
| Monaco | 73.35% |
| Peru | 74.78% |
| Rwanda | 79.00% |
| Cote d’Ivoire | 79.75% |
| Ecuador | 89.68% |
| Algeria | 91.55% |
| Paraguay | 93.80% |
| Bolivia | 94.47% |
| South Sudan | 98.58% |
| Guatemala | 99.49% |
| South Africa | 99.9998% |
| Jamaica | 100.00% |
The 2024 subset is easier to compare in time, but it is not geographically representative of the world because so many economies do not have a 2024 observation in this extract. This illustrates the trade-off between coverage and comparability. A latest-available dataset gives broad geographic coverage but mixes years; a single-year dataset improves temporal comparability but can exclude large parts of the world. Good analysis should state which trade-off it is making rather than hiding it.
What to pair with this indicator
A fuller picture of tertiary-education finance requires several additional measures. Total tertiary-education expenditure or expenditure as a share of GDP helps establish the size of the funding envelope. Spending per student adjusts for enrollment and can reveal whether a high current-expenditure share is attached to a high or low resource level per learner. Capital-expenditure data can show whether a lower current share reflects construction and equipment investment. Staff-compensation data can separate salary pressure from other recurring costs such as materials, administration, or ancillary services.
- Total funding: a high current-expenditure share does not reveal whether the overall budget is large or small.
- Spending per student: enrollment differences can change the resources available to each learner even when spending shares look similar.
- Capital expenditure: construction, renovation, and major equipment can lower the current-spending share in a particular year.
- Staff compensation: separating payroll from other current costs helps explain why the recurring-cost share is high.
- Education outcomes and access: spending composition alone does not measure graduation, learning, research performance, affordability, or participation.
How to read the map and tables
The world map joins country codes from the World Bank extract to a low-resolution world boundary. Of the 168 data rows, 139 match that boundary directly. Some small island states, territories, and special areas are absent from the low-resolution geometry or use identifiers that do not have a one-to-one polygon match. Their data are still part of the statistical analysis even when they are not visible on the map. For exact country values, the table or original World Bank series should take precedence over the visual.
Missing geographic matches are not zeros. A country that is not drawn must not be interpreted as having 0% current expenditure. The analysis uses only non-empty reported values and does not fill missing observations with zero or copy a neighboring country’s value. This is particularly important for an indicator where a true zero would have a strong substantive meaning that is completely different from ‘no mapped geometry’ or ‘no reported value.’
Questions this indicator can answer well
SE.XPD.CTER.ZS is useful when the question concerns the composition of direct spending in public tertiary institutions. It can help identify economies where recurring operating costs account for almost all direct expenditure, highlight observations where the current share is much lower, and provide a starting point for investigating years of heavy capital investment. It is less suitable for questions such as which country spends the most on universities, which tertiary system is most efficient, or where students receive the best education. Those questions require different denominators and additional outcome data.
The World Bank’s official indicator page for SE.XPD.CTER.ZS provides the series definition and country time series. For a country-level study, it is better to examine several consecutive years rather than one latest observation. A sudden drop in the current-expenditure share may coincide with a capital project, an accounting change, a change in institutional coverage, or another reporting event. The ratio tells you where to look; it does not identify the cause on its own.
Summary
Current expenditure accounts for a large share of direct spending in public tertiary institutions in many economies, but the size of that share varies substantially. The median latest-available value across 168 economies is 91.90%, and 100 economies are at or above 90%, while 33 are below 80%. The observation years, however, range from 2001 to 2024, so the full dataset should not be treated as a same-year ranking. The most useful way to read the indicator is to remember two things: it describes how direct spending is composed, not how much is spent, and the observation year is essential context for every percentage.
Frequently Asked Questions
Does a current-expenditure share near 100% mean a better-funded tertiary system?
No. The indicator describes the composition of direct expenditure in public tertiary institutions. It does not measure the total size of the budget, spending per student, or education quality.
Are all country values from 2024?
No. The latest available observation differs by economy and ranges from 2001 to 2024 in this dataset. The observation year should be checked alongside every percentage.
Can this indicator show which country spends the most on tertiary education?
No. The denominator is total direct institutional expenditure, so the indicator is a percentage composition measure rather than an amount of money. Total expenditure requires a different indicator.
Related Articles
Green Map creates custom-edited map images using open geographic data sources such as geoBoundaries, Natural Earth, OpenStreetMap, and government open data.
These maps are edited visual materials, not raw data files, and are provided for education, documents, presentations, and graphic reference.