An account at a financial institution or the ability to use mobile money is a basic gateway to payments, transfers, saving and receiving income. In the World Bank 2024 indicator FX.OWN.TOTL.ZS, 139 reporting economies have a numeric observation for people age 15 and older. Across those economies, the median share is 72.8% and the mean is 70.4%. The gap between the two reflects a distribution that includes a set of economies with substantially lower access alongside many near-universal observations.
The source file contains 217 country and economy rows in total. 78 rows have no 2024 value and remain missing rather than being converted to zero. Rankings, percentiles and summary statistics therefore use only the 139 reported values. The same rule applies to the map: gray or hatched areas indicate no mapped observation or the absence of a separate polygon in the boundary file, not a measured value of 0%.
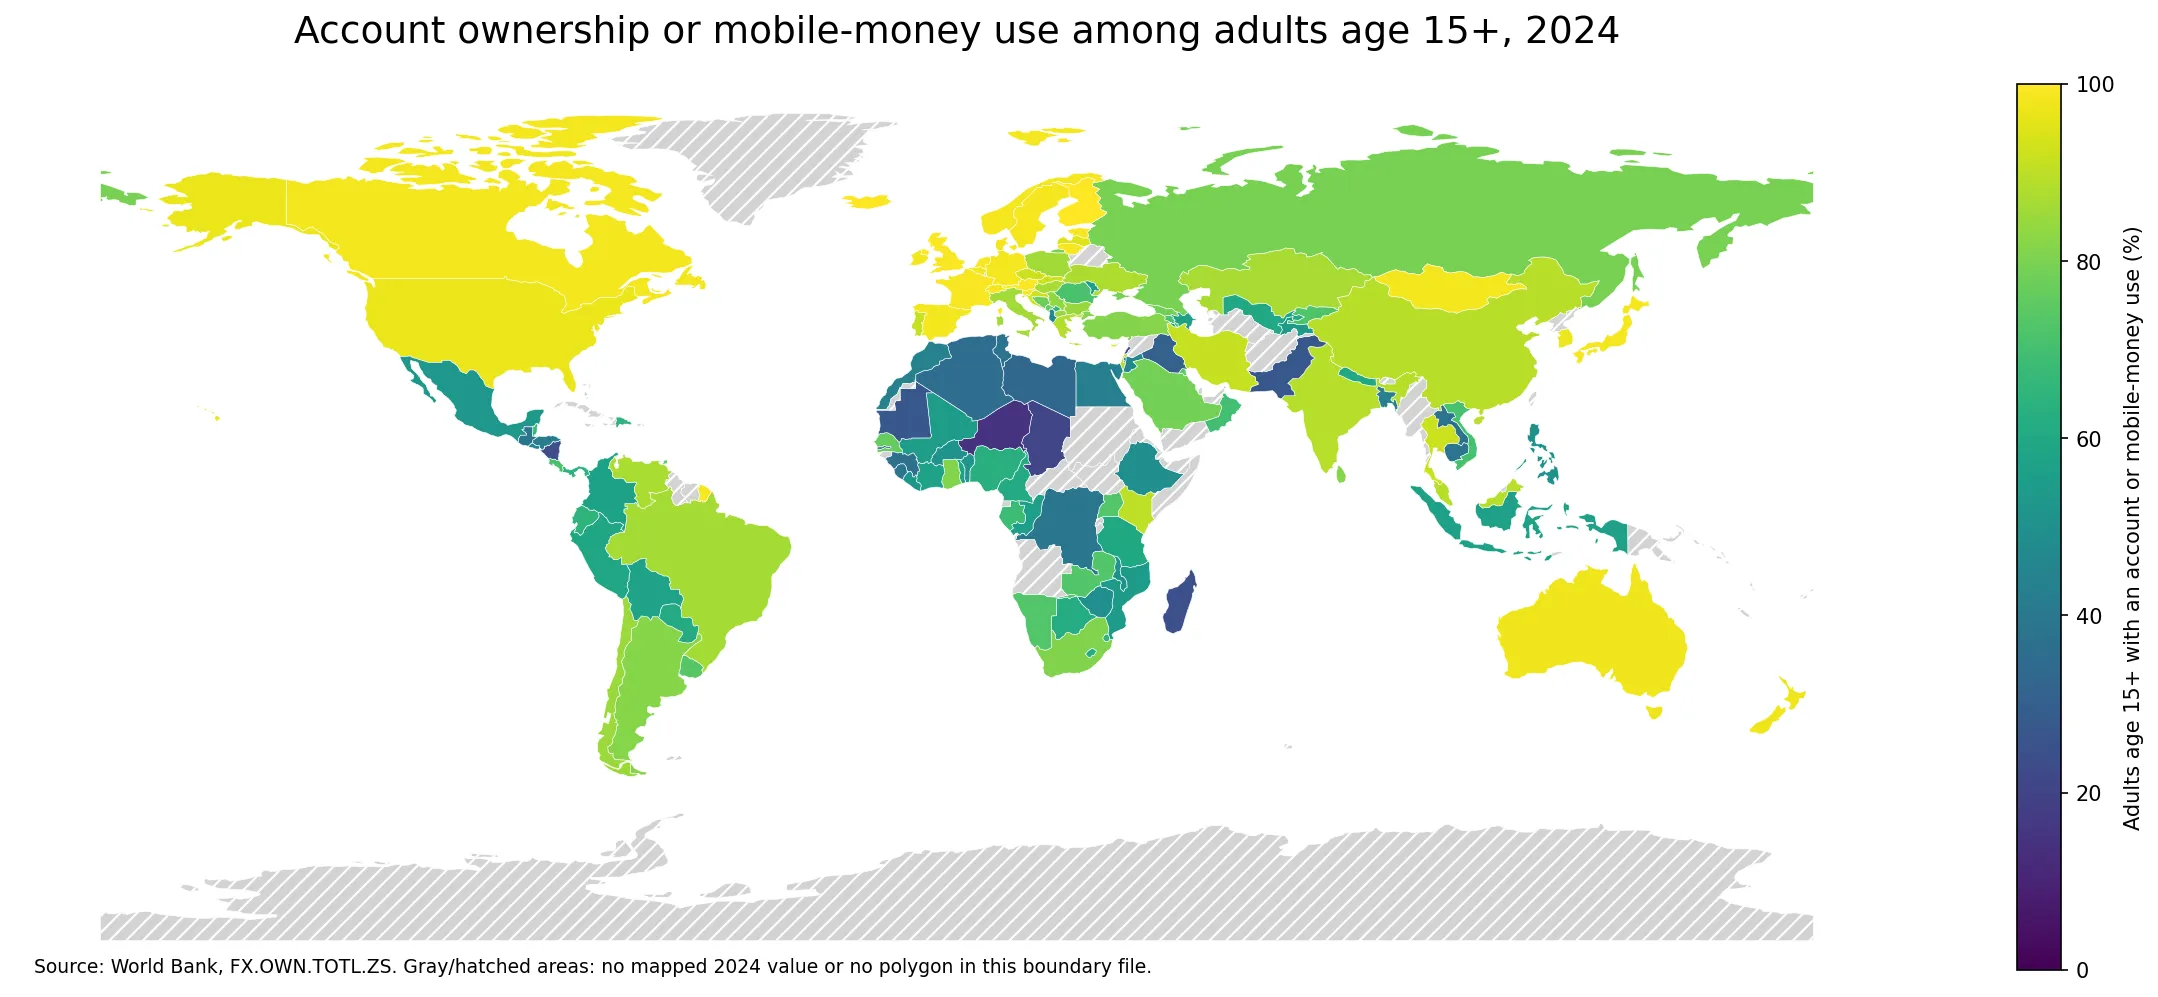
Table of Contents
How wide is the 2024 distribution?
The 25th percentile is 53.7% and the 75th percentile is 90.6%. That means the middle half of reporting economies spans almost 36.9 percentage points. The 10th percentile is 38.3% and the 90th percentile is 98.4%. A total of 36 economies are at or above 90%, while 29 are below 50%. These thresholds show why a single global average is not enough to describe the pattern.
The highest reported observation is Iceland at 99.9%, while the lowest is Niger at 14.8%. The difference is about 85.0 percentage points. A distribution this broad is better understood through several views at once: the map for geography, percentiles for the middle of the distribution, and top-bottom values for the extremes.
What exactly does the indicator measure?
The World Bank definition is broader than a conventional bank-account statistic. It includes respondents who report having an account, by themselves or jointly with someone else, at a bank or another type of financial institution, as well as respondents who personally used a mobile-money service during the previous 12 months. This matters in economies where mobile finance is an important alternative to branch-based banking.
The indicator should not be read as a complete measure of financial well-being. It does not tell us how much money people keep in an account, how frequently they transact, whether they can obtain affordable credit, whether they hold insurance, or whether the services they use are reliable and inexpensive. It is best interpreted as a measure of basic access or participation in formal or mobile financial channels.
The highest and lowest reported values
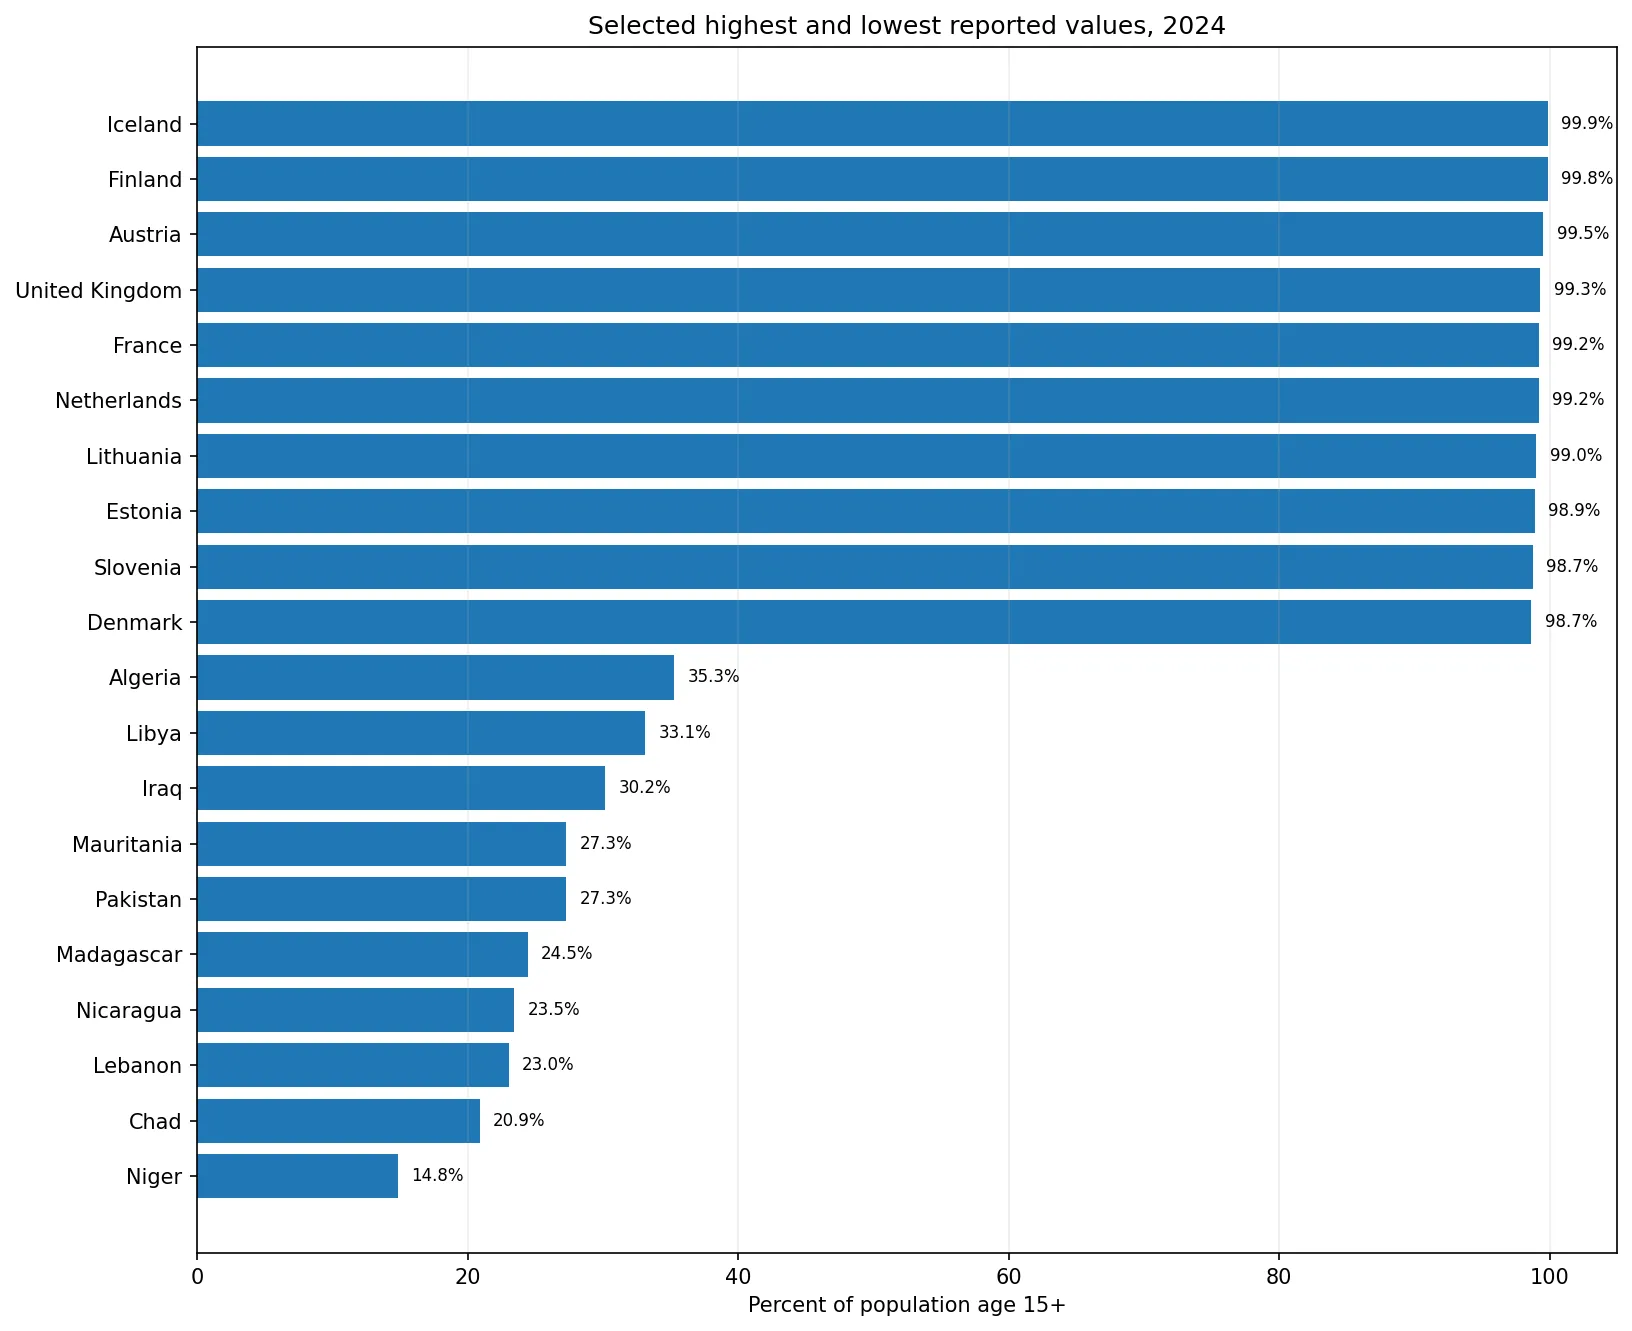
At the upper end, Iceland records 99.9%, Finland 99.8%, Austria 99.5%, the United Kingdom 99.3% and France 99.2%. Japan is also in the highest cluster at 98.5%. Differences among economies above 98% are small enough that the broad conclusion—very widespread access—is more informative than a precise decimal ranking.
At the lower end, Niger is 14.8%, Chad 20.9%, Lebanon 23.0%, Nicaragua 23.5% and Madagascar 24.5%. Pakistan and Mauritania are both around 27%. These figures document large access gaps, but they do not identify the cause of those gaps. Explaining causation would require additional evidence on institutions, income, infrastructure, identity systems, mobile networks and regulation.
Country contrasts beyond the extremes
Large economies occupy different parts of the distribution. The United States is 97.0%, China 89.4%, India 89.0% and Brazil 86.4%. Indonesia is 56.3% and Mexico 53.0%. These comparisons demonstrate that geography or income category alone cannot substitute for the reported country value.
South Africa is 81.1%, Nigeria 63.3% and Kenya 90.1%, illustrating substantial variation within the same broad region. Bangladesh is 43.3%. Differences of this size can coexist with very different mixes of bank accounts and mobile-money use, so the combined definition should remain visible whenever the indicator is discussed.
Selected top and bottom observations
| Economy | Share of population age 15+ |
|---|---|
| Iceland | 99.9% |
| Finland | 99.8% |
| Austria | 99.5% |
| United Kingdom | 99.3% |
| France | 99.2% |
| Netherlands | 99.2% |
| Lithuania | 99.0% |
| Estonia | 98.9% |
| Slovenia | 98.7% |
| Denmark | 98.7% |
| Niger | 14.8% |
| Chad | 20.9% |
| Lebanon | 23.0% |
| Nicaragua | 23.5% |
| Madagascar | 24.5% |
| Pakistan | 27.3% |
| Mauritania | 27.3% |
| Iraq | 30.2% |
| Libya | 33.1% |
| Algeria | 35.3% |
The table intentionally focuses on the tails of the distribution. It is not intended to imply that a one-place movement in a decimal ranking is economically meaningful. Survey estimates, sampling, timing and reporting conventions can differ. The strongest signal is the distance between broad ranges, particularly when comparing near-universal access with values below one-half of the adult population.
What the map reveals geographically
Many European economies cluster near the top of the scale, and high values are also visible in parts of North America and Oceania. Asia and Latin America contain a mixture of high and middle values, while lower observations appear in parts of Africa and West Asia. These are broad visual patterns rather than rules: neighboring countries can differ sharply, and several economies in regions with lower averages still report high access.
The map is therefore most useful as a navigation tool for identifying clusters and exceptions. It should not be used to infer the reason for a value simply from location. A country may reach a high share through a different combination of commercial banking, digital wallets, mobile-money networks and public payment infrastructure than another country with a similar percentage.
Interpretation checks before comparing countries
- The reference year is 2024, and the analysis uses 139 economies with numeric observations.
- The 78 missing rows are not zeros and are excluded from summary statistics and rankings.
- The measure combines financial-institution account ownership with personal mobile-money use during the previous 12 months.
- The denominator is the population age 15 and older, so it should not be mixed directly with youth-only or total-population percentages.
- A high share does not by itself measure account activity, balances, access to credit, affordability, service quality or financial resilience.
- Broad bands and distributional differences are more robust than fine decimal ranking among countries with nearly identical values.
Why the age-15-plus measure is useful
A broad adult measure provides a straightforward baseline for how widely basic financial channels reach a population. Having an account or using mobile money can support wage payments, government transfers, remittances, bill payment, online purchases and saving. By including mobile money, the indicator also captures forms of access that may be important where conventional bank branches are sparse.
The national average can still conceal important gaps by age, sex, income, education or urban-rural residence. More detailed indicators can help reveal those differences, but they must be compared carefully because denominators and survey populations differ. An adult total should not be treated as interchangeable with a youth-specific measure even when both refer to the same general concept of account access.
Data and method
The analysis uses World Bank indicator FX.OWN.TOTL.ZS for 2024. The geographic unit is country or reporting economy, and the unit is percent of the population age 15 and older. From 217 source rows, 139 rows with data_status equal to OK and a numeric value were used. The remaining 78 rows were preserved as missing. Means, percentiles and rankings were calculated directly from those 139 observations.
The choropleth joins ISO3 country codes to a low-resolution Natural Earth boundary file. Known blank ISO entries for France and Norway were repaired by country name before the join. Of the 139 numeric observations, 133 have a polygon in this boundary set and can be shaded on the map. Small islands and territories without separate polygons remain part of the statistics even when they cannot be drawn independently. That mapping limitation is distinct from a missing source observation.
Frequently Asked Questions
Does the indicator measure only bank-account ownership?
No. It includes having an account at a financial institution or personally using a mobile-money service during the previous 12 months.
How many economies have a 2024 value in this comparison?
There are 139 countries and reporting economies with numeric 2024 observations in the supplied World Bank data.
Were missing observations treated as 0%?
No. The 78 missing rows remain missing, are excluded from rankings and summary statistics, and are not converted to zero on the map.
Related Articles
Green Map creates custom-edited map images using open geographic data sources such as geoBoundaries, Natural Earth, OpenStreetMap, and government open data.
These maps are edited visual materials, not raw data files, and are provided for education, documents, presentations, and graphic reference.