Across the 111 countries and economies with a reported 2023 value, taxes on goods and services account for a median 30.9% of government revenue. The mean is 31.5%, but the distribution is wide. This is not a tax-rate measure and it is not taxes as a share of GDP. It describes how much of reported revenue comes from taxes levied on a broad range of goods, transactions and services.
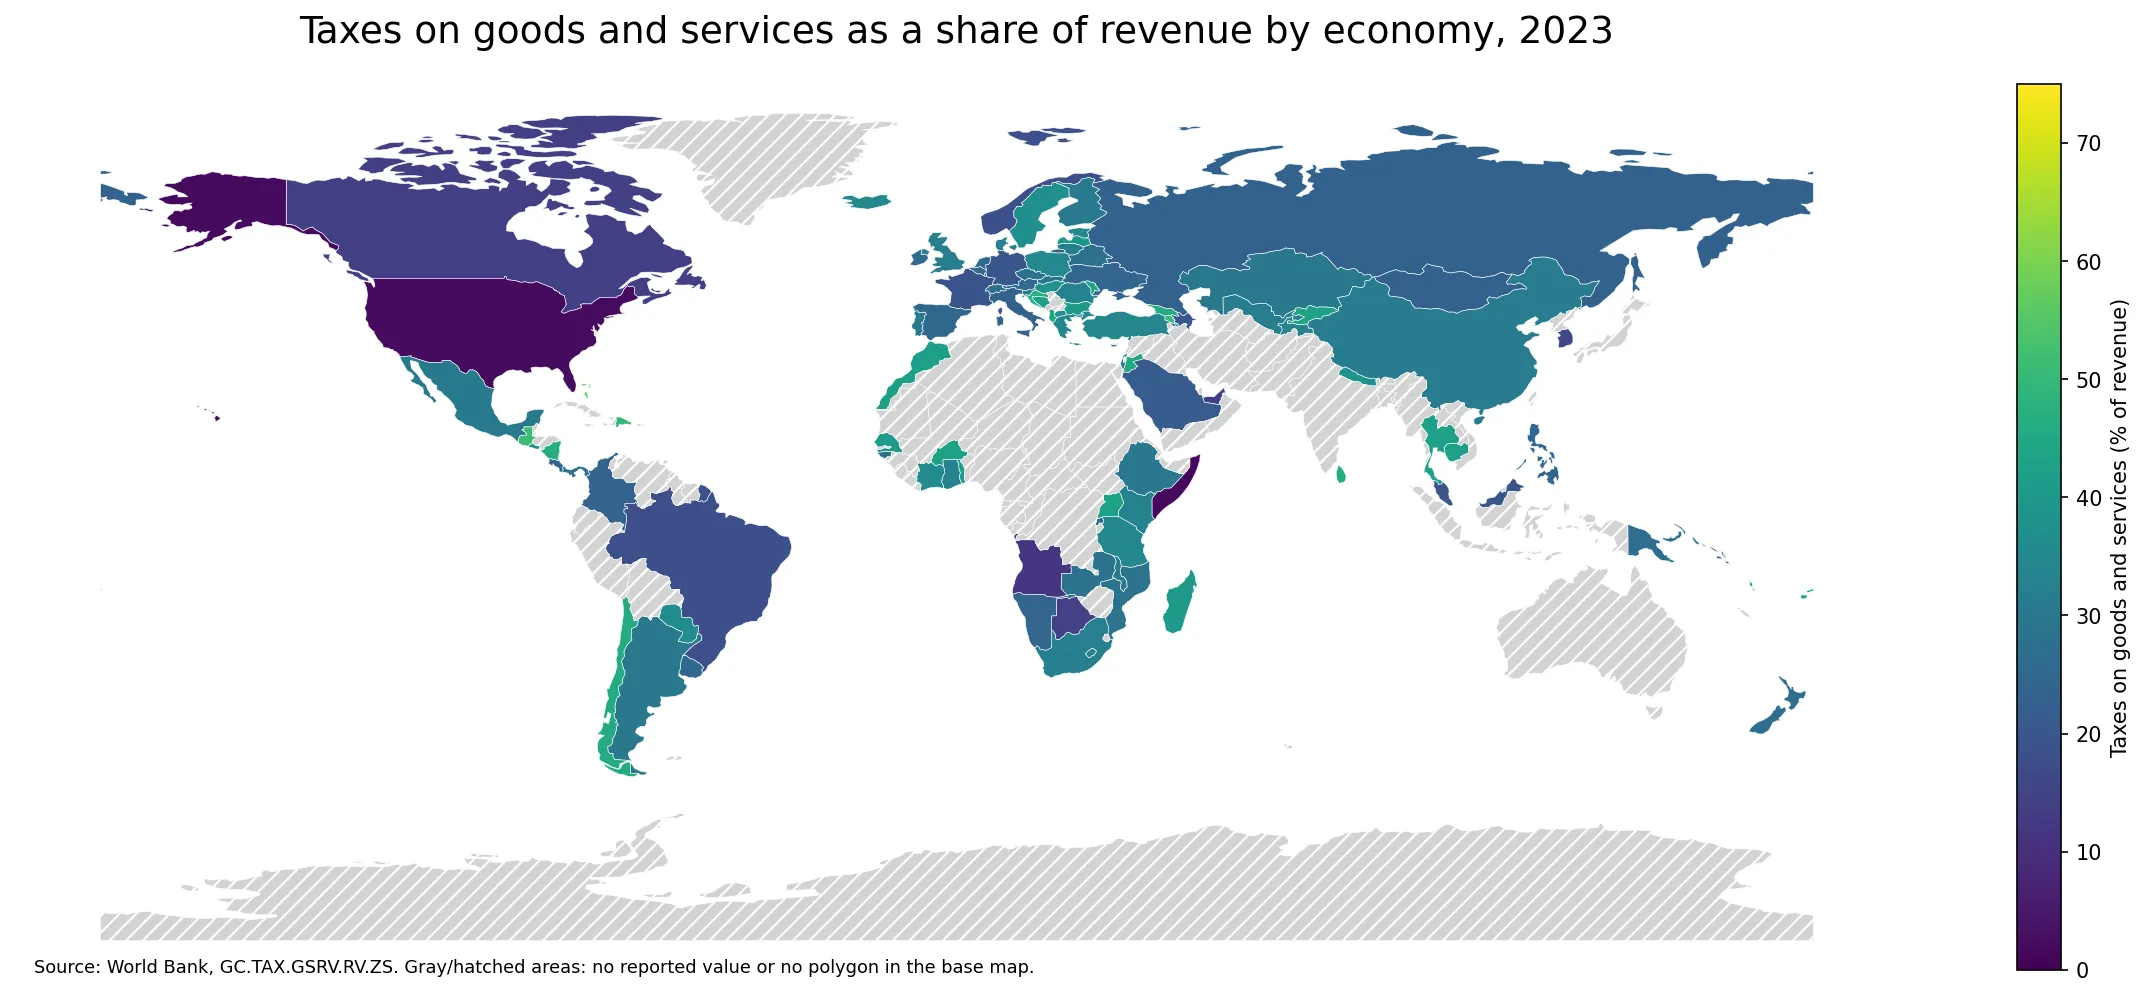
Table of Contents
How wide is the 2023 distribution?
The 25th percentile is 24.6% and the 75th percentile is 39.5%, placing the middle half of reporting economies within a band of almost 15 percentage points. The range is much larger: the highest reported value is 71.7% in Macao SAR, China, while the lowest is 1.7% in Somalia. A single global average therefore hides substantial differences in the composition of government revenue.
The denominator matters. The World Bank indicator is expressed as a percentage of revenue, not as a percentage of tax revenue alone. Revenue can include other categories in addition to taxes, so a high value does not automatically imply a high overall tax burden. A low value likewise does not prove that consumption-related tax rates are low. The measure is best used as a composition indicator.
The distance between the highest and lowest observations
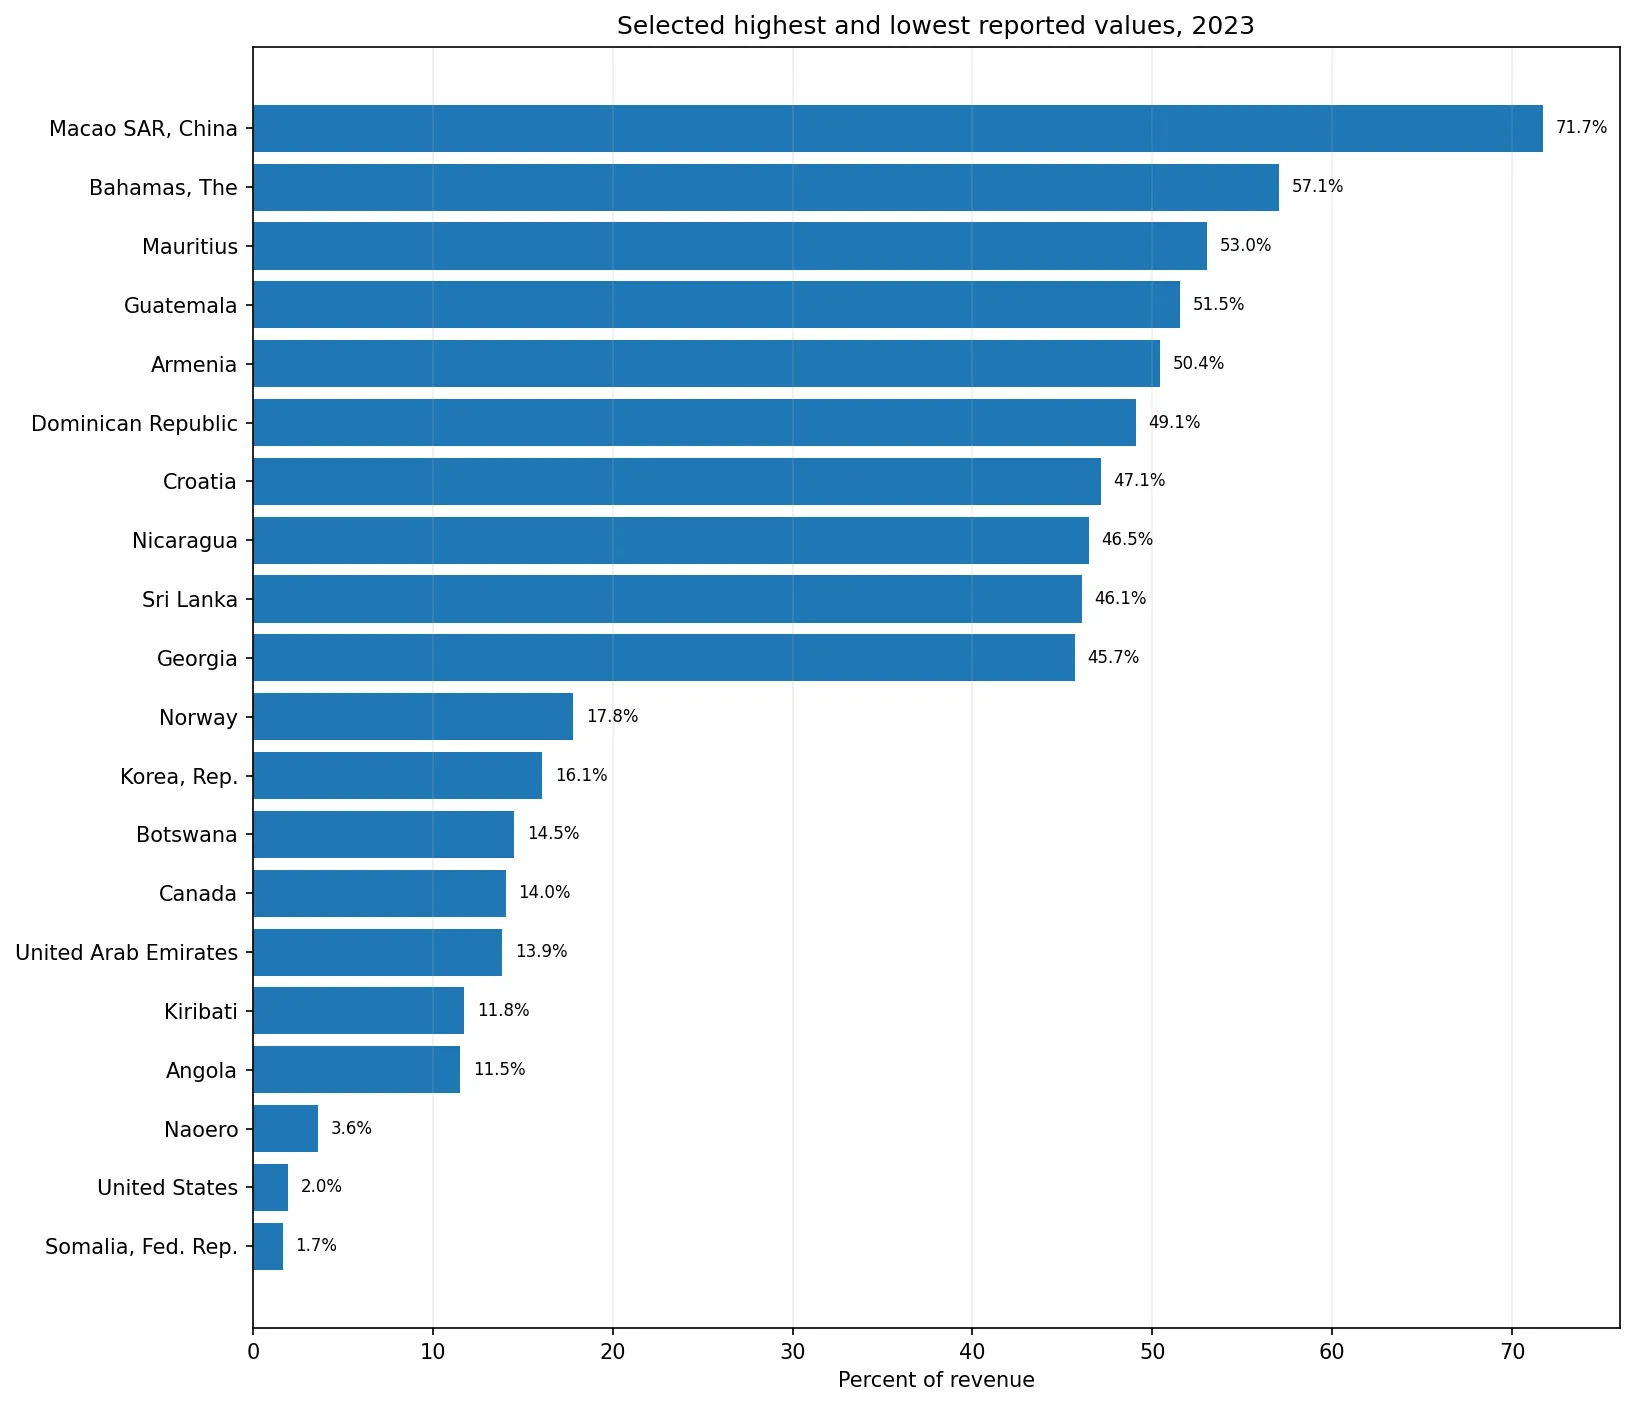
Macao SAR, China leads the supplied 2023 observations at 71.7%, followed by The Bahamas at 57.1%, Mauritius at 53.0%, Guatemala at 51.5% and Armenia at 50.4%. The Dominican Republic, Croatia, Nicaragua, Sri Lanka and Georgia are also around 45% or higher. These economies are spread across several regions, so the upper tail is not confined to one continent.
At the lower end, Somalia is 1.7%, the United States 2.0% and Naoero 3.6%, followed by Angola at 11.5%, Kiribati at 11.8%, the United Arab Emirates at 13.9% and Canada at 14.0%. The positions of the United States and Canada illustrate why this measure should not be read as a ranking of economic size, income or fiscal capacity.
Geographic patterns and contrasts between neighbors
Latin America and the Caribbean show a mixed pattern rather than a single regional level. Guatemala is 51.5%, the Dominican Republic 49.1%, Nicaragua 46.5% and Chile 45.5%, while Mexico is 30.3% and Brazil 18.1%. North America also sits toward the lower part of this specific distribution because the United States and Canada report relatively small shares.
Neighboring economies can differ sharply. Armenia reports 50.4% compared with Azerbaijan at 19.9%, while Georgia is 45.7% and Türkiye 34.1%. In southeastern Europe, Croatia is 47.1% versus Italy at 23.3%. Such contrasts are consistent with the indicator reflecting national revenue structure, classification and reporting scope rather than geography alone.
Top 10 reported values
| Economy | Share of revenue |
|---|---|
| Macao SAR, China | 71.7% |
| Bahamas, The | 57.1% |
| Mauritius | 53.0% |
| Guatemala | 51.5% |
| Armenia | 50.4% |
| Dominican Republic | 49.1% |
| Croatia | 47.1% |
| Nicaragua | 46.5% |
| Sri Lanka | 46.1% |
| Georgia | 45.7% |
Bottom 10 reported values
| Economy | Share of revenue |
|---|---|
| Somalia, Fed. Rep. | 1.7% |
| United States | 2.0% |
| Naoero | 3.6% |
| Angola | 11.5% |
| Kiribati | 11.8% |
| United Arab Emirates | 13.9% |
| Canada | 14.0% |
| Botswana | 14.5% |
| Korea, Rep. | 16.1% |
| Norway | 17.8% |
What this indicator does not measure
- It is not the statutory VAT, sales-tax or excise-tax rate.
- It is not tax revenue as a share of GDP and therefore is not a direct measure of the overall tax burden.
- Because the denominator is total revenue, differences in non-tax revenue can change the ratio even when goods-and-services tax receipts do not move proportionally.
- Government-finance coverage and classification can vary across reporting systems, so very small rank differences should not be over-interpreted.
- Missing observations are not zero and were kept separate from the measured distribution.
Taxes on goods and services generally cover taxes levied on the production, leasing, delivery, sale, purchase or other transfer of ownership of a broad range of goods, as well as the provision of services. The indicator is useful for examining the role of transaction- and consumption-related taxation in the revenue mix, but it does not by itself describe distributional effects, household burden or the progressivity of the tax system.
What can be learned from the ratio?
Its most direct use is comparing the composition of revenue across countries. An economy that relies more heavily on income and profit taxes, social contributions, resource-related receipts, property income, fees or other revenue sources can show a lower goods-and-services tax share even if its absolute collections are large. Conversely, a higher ratio can indicate that these taxes form a more important part of the reported revenue mix. The component amounts must be examined separately before drawing conclusions about fiscal dependence.
Changes over time can also be informative, but this article is a 2023 cross-section. Explaining why a country moved up or down would require a consistent multi-year series and evidence on tax reforms, economic conditions, resource receipts and one-off revenue changes. A single-year observation should not be treated as proof of a policy effect.
Data and method
The analysis uses World Bank indicator GC.TAX.GSRV.RV.ZS for 2023. The supplied file contains 217 country or economy rows, of which 111 have numeric observations and 106 are source-missing. Missing rows were not converted to zero. Summary statistics and rankings use only the 111 reported values. The map joins ISO3 codes to a standard world boundary layer; small territories or special administrative areas without a matching polygon remain part of the statistics even when they cannot be drawn separately.
For the 111 reported observations, the mean is 31.5% and the median 30.9%. The interquartile range runs from 24.6% to 39.5%, with a minimum of 1.7% and a maximum of 71.7%. The tables and chart were created by sorting these supplied observations directly, with missing values excluded from the ranking.
Frequently Asked Questions
Does a high goods-and-services tax share mean tax rates are high?
Not necessarily. The indicator is the share of total government revenue coming from these taxes, so tax rates, the tax base and the size of other revenue sources all affect the ratio.
Is this the same as tax revenue as a percentage of GDP?
No. The denominator here is government revenue, not GDP, so it measures revenue composition rather than the overall tax burden relative to the economy.
Were economies without a 2023 value treated as zero?
No. Missing observations remained missing and were excluded from the mean, median and rankings.
Related Articles
Green Map creates custom-edited map images using open geographic data sources such as geoBoundaries, Natural Earth, OpenStreetMap, and government open data.
These maps are edited visual materials, not raw data files, and are provided for education, documents, presentations, and graphic reference.