Benton County in east-central Iowa is organized around a dispersed set of small cities, a road network that converges on Vinton, and the broad Cedar River valley cutting through the northern half of the county. The general map places Vinton, Belle Plaine, Atkins, Urbana, Van Horne, Newhall, and other communities beside major routes such as U.S. 30, U.S. 218, Iowa 150, and I-380. The terrain-and-water map then shifts attention from roads to Cedar River, Bear Creek, Prairie Creek, Wildcat Creek, and the many smaller tributaries that divide the countryside. The elevation map adds a third perspective, showing a mapped local range of about 227 to 320 meters. High-resolution JPG versions of the maps shown on this page are available together in the download section below.
Vinton is the easiest place to use as an orientation point. Benton County’s official website identifies Vinton as the county seat, and the map makes that role visually clear: the city sits near the north-central part of the county where several important roads and the Cedar River come close together. Belle Plaine occupies a very different position near the southwest, while Urbana is in the northeast and Atkins and Walford are farther east and southeast. This spread means the county cannot be understood as a single compact urban area with suburbs around one center. Its towns are separated by farmland, creek valleys, and long stretches of local road.
The strongest way to read the map set is to connect those towns with both transportation and terrain. U.S. 218 and Iowa 150 make Vinton a major reference point, U.S. 30 runs east–west through the southern half, and I-380 appears near Urbana in the northeast. Meanwhile Cedar River bends through lower ground near Vinton, and a dense network of smaller creeks cuts through the western, central, and southern uplands. A road map alone can make the county look like a simple rural grid, but the water and elevation views show why many roads cross valleys, climb ridges, or change direction around drainage corridors.
Table of Contents
Vinton anchors U.S. 218 and Iowa 150 while U.S. 30 crosses the south
On the general county map, Vinton stands out immediately because of its larger urban footprint and the concentration of roads around it. U.S. 218 approaches from the south, while Iowa 150 begins at U.S. 218 in Vinton and continues north toward Urbana. That highway relationship is also documented in Iowa route references, but it is easy to see directly on the supplied map: Vinton is the point where travel toward the northeast and travel through the central county can be compared on one page.
West of Vinton, Garrison appears amid a much more rural road network. Farther south, Van Horne and Keystone provide useful landmarks for the central-western part of the county. Mount Auburn sits to the north, while Shellsburg lies to the east of Vinton. None of these places forms a continuous built-up strip with the county seat. Instead, each community is separated by open countryside and a web of short streams, which is why the county map is more useful when town names, roads, and water lines are read together rather than one at a time.
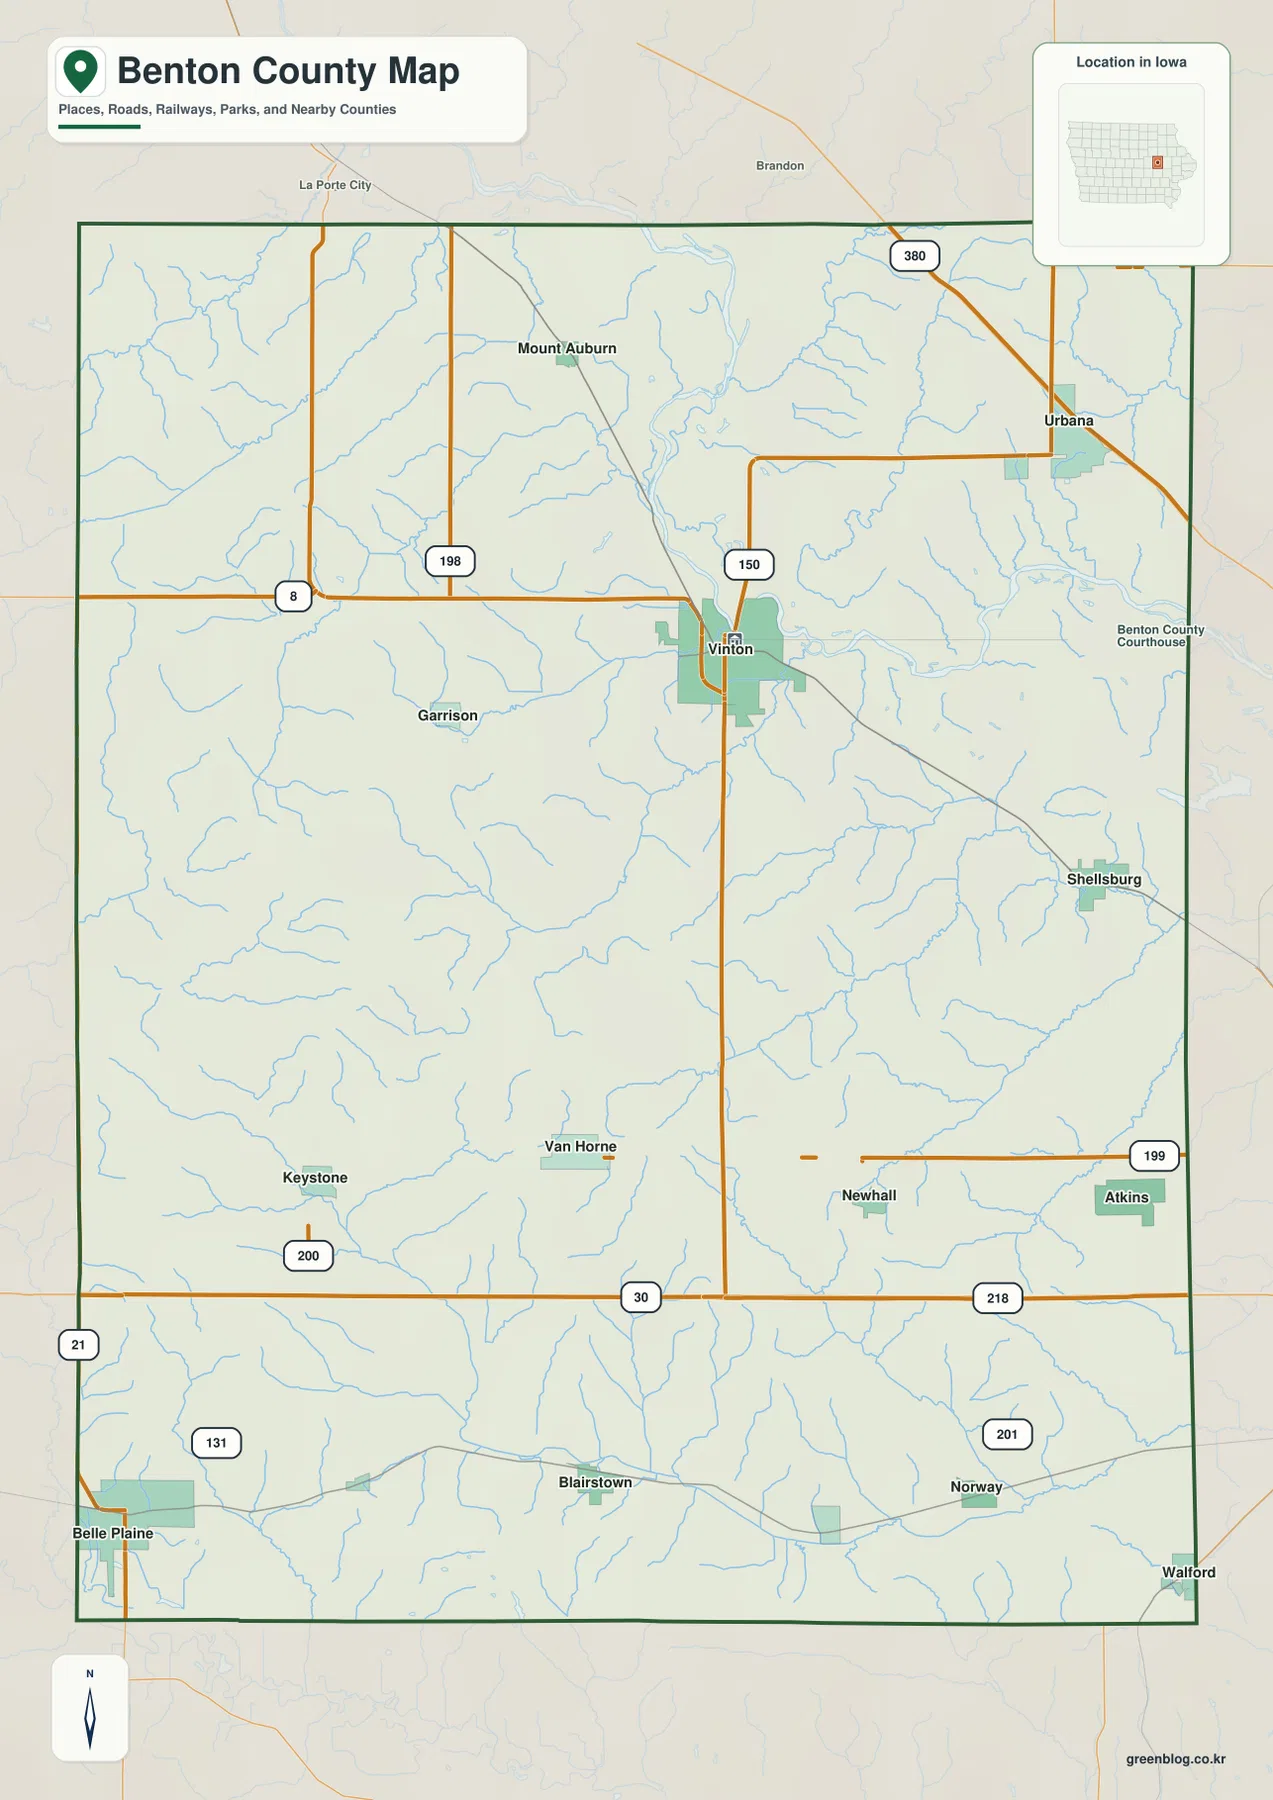
U.S. 30 becomes the main reference line in the southern half of the county. It runs broadly east–west, helping separate the locations of Van Horne, Newhall, Blairstown, Norway, and nearby rural areas. Belle Plaine sits farther southwest, below the main U.S. 30 corridor shown on the map, while Walford is near the southeastern edge. For a reader trying to locate southern Benton County, it is often faster to find U.S. 30 first and then work north or south from that route than to begin at Vinton.
The northeast has a different transportation pattern. Near Urbana, I-380 is visible along with Iowa 150 and connecting roads. Urbana therefore works as a gateway reference for the northeastern corner, just as Vinton works for the north-central part and U.S. 30 for the south. This static map is not intended to replace current navigation, road-closure, or construction information, but it clearly shows how the county’s larger roads divide the landscape and connect its separate towns.
Six highlighted cities show how widely settlement is spread
The city-distribution map isolates six larger communities shown in the source graphic: Vinton, Belle Plaine, Atkins, Urbana, Walford, and Newhall. Their placement makes the county’s dispersed settlement pattern much easier to see. Vinton is north-central, Urbana is northeast, Atkins and Newhall occupy the eastern to southeastern interior, Belle Plaine is near the southwest, and Walford is close to the southeast boundary. The map does not show a tight ring of communities around Vinton; instead, the highlighted cities occupy very different parts of the county.
A CITY INDEX printed below the map includes reference numbers for the six places. Those values should not be treated here as guaranteed current population counts, because population estimates can change after a static map is prepared. For current statistics, the U.S. Census Bureau is the better source. The useful feature of this map is the ranking and geographic placement: Vinton and Belle Plaine are separated by a large portion of the county, while Urbana, Atkins, Newhall, and Walford create a second group of reference points toward the east and southeast.
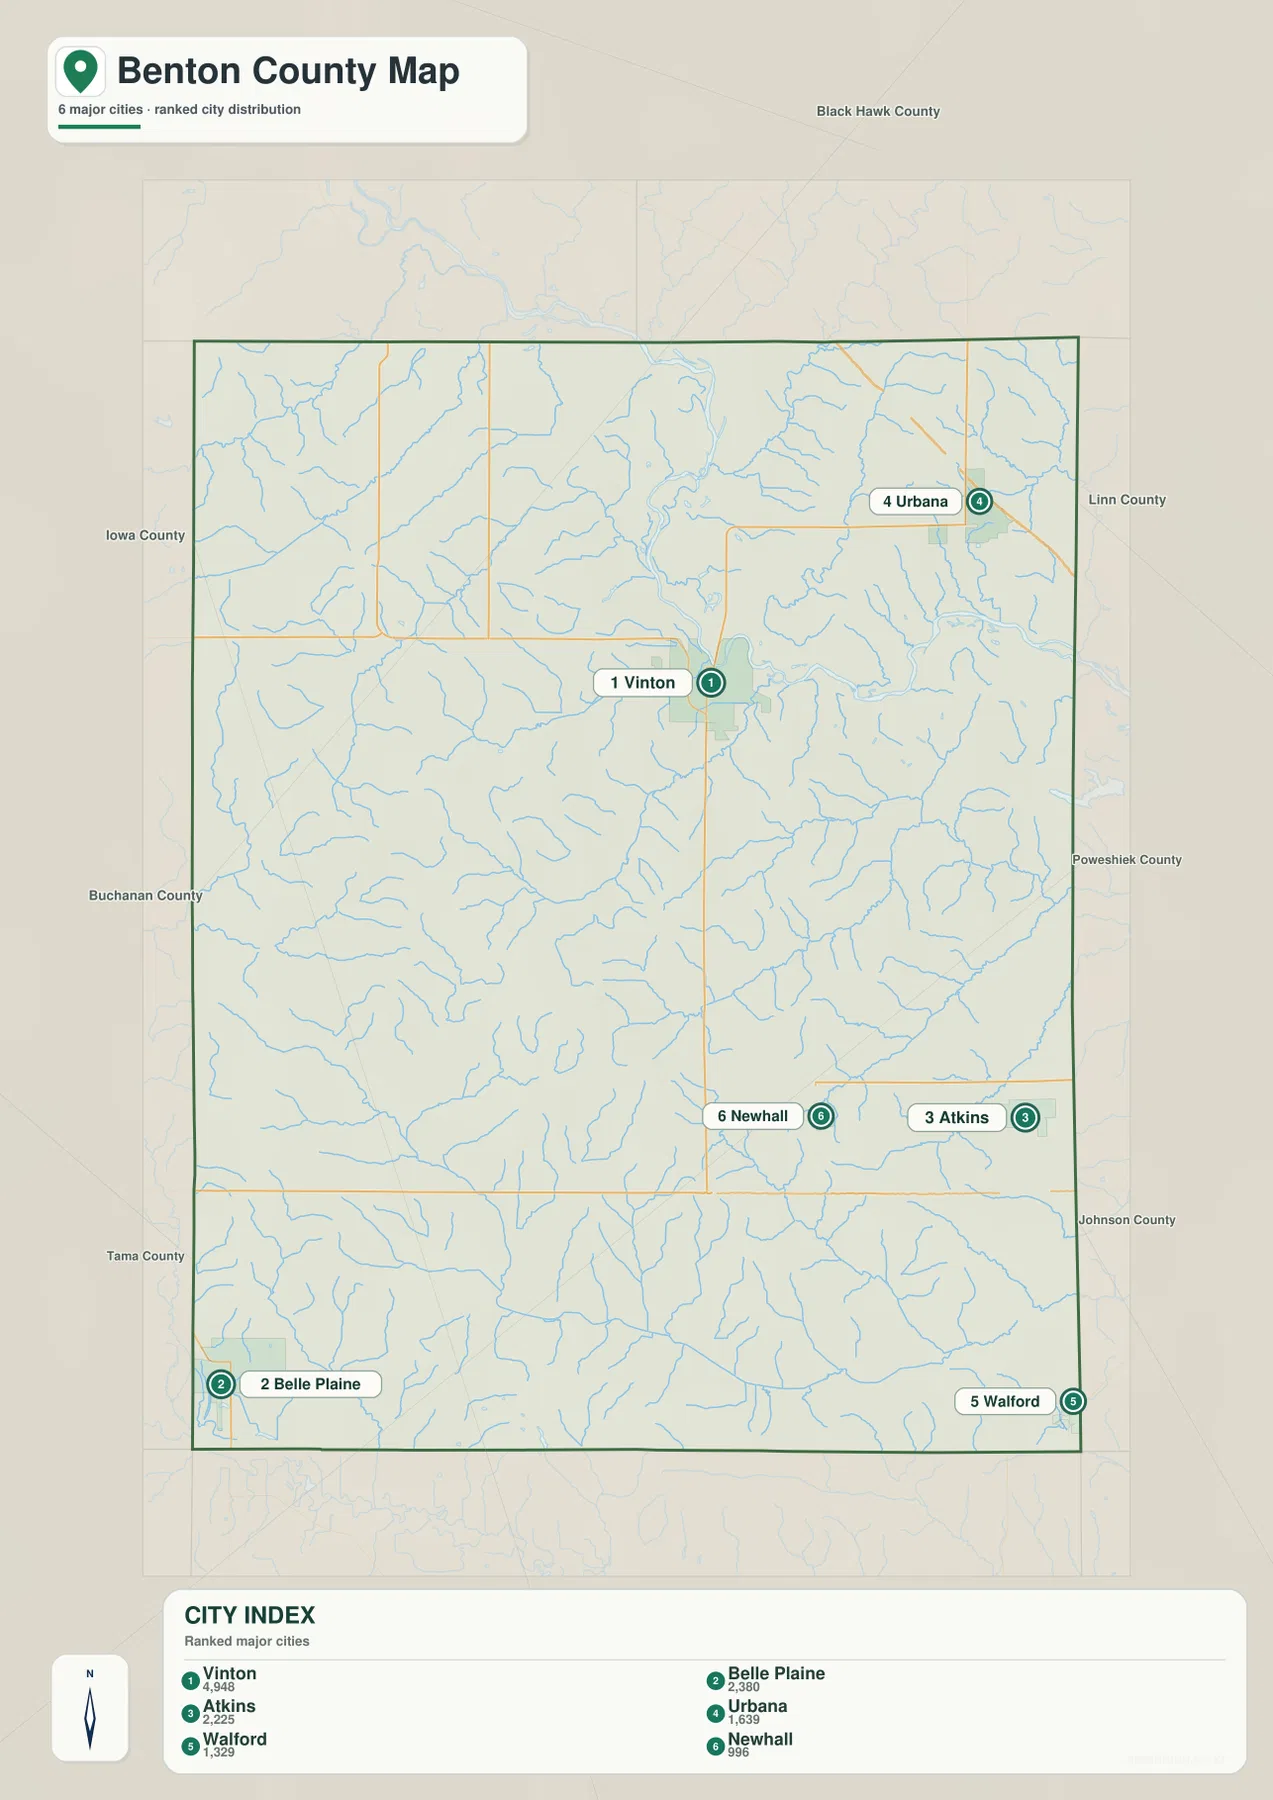
The contrast between Vinton and Belle Plaine is especially useful. Vinton is tied to Cedar River and the U.S. 218–Iowa 150 road junction, while Belle Plaine sits in the southwest with a separate local road pattern. Between them, places such as Keystone, Van Horne, and Blairstown break up the rural landscape but do not create a continuous urban corridor. That makes a countywide map valuable for anyone who has seen only one town and wants to understand where the others actually sit.
Atkins, Urbana, Walford, and Newhall also serve different orientation roles. Urbana is close to the I-380 and Iowa 150 area in the northeast. Atkins lies farther south and east, Newhall is west of Atkins within the southeastern interior, and Walford is close to the county’s lower-right edge. Comparing the city map with the general map helps distinguish which communities are near major highways and which are better approached through local county roads.
Cedar River forms the main low corridor, with Bear, Prairie, and Wildcat creeks branching away
Cedar River is the dominant water feature on the terrain-and-water map. It enters the northern part of the mapped area, bends through the Vinton region, and occupies a broad valley that receives numerous tributaries. This relationship matters because Vinton is not only a road center; it is also a river town. Benton County Conservation manages several properties along Cedar River, including river-access and recreation areas near Vinton, which reinforces the geographic importance of the river beyond the map itself.
Named tributaries fill the rest of the map. Bear Creek is prominent in the northeast. Rock Creek, Spring Creek, Pratt Creek, and Hinkle Creek appear across the northwestern and western portions. Mud Creek runs through the central area, while Wildcat Creek and Little Bear Creek are visible farther east. In the south, Prairie Creek stretches across a long section of the county, and Buffalo Creek appears near the southwest. These streams do not form a neat parallel pattern; they curve through different valleys and join larger channels from several directions.
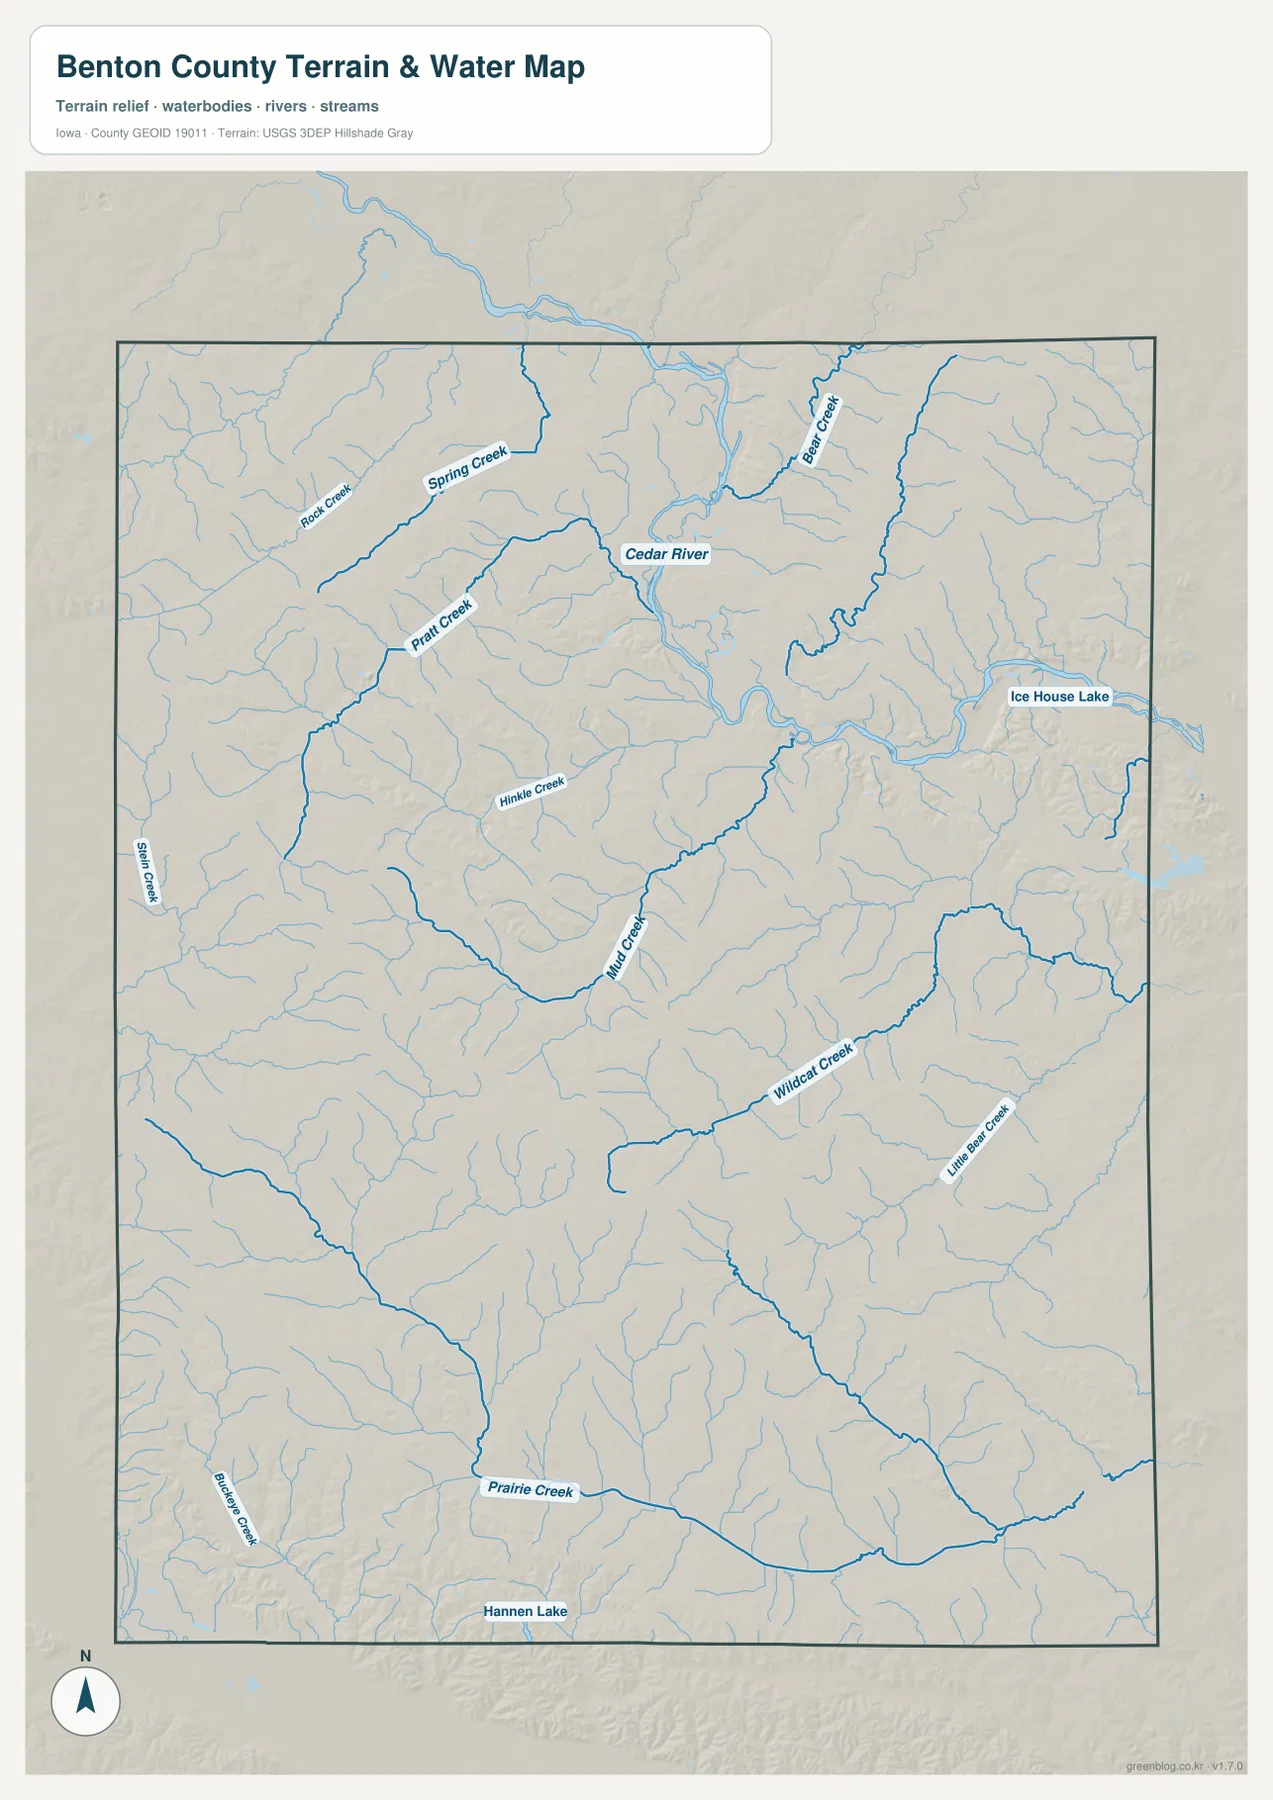
Ice House Lake is labeled in the eastern part of the water map, and Hannen Lake appears near the southern edge. Benton County Conservation describes Hannen Lake Park in southern Benton County as a park with a 45-acre lake surrounded by woodland and prairie. That official park description gives useful context to a feature that otherwise appears as only a small water label on a county-scale map. The map is still selective, however; not every pond, drainage ditch, or temporary water feature is represented at the same level.
This layer is a geographic water reference, not a flood-risk, legal, parcel, or navigation map. It can show where Cedar River and named creeks lie and help explain the shape of nearby terrain, but it does not provide flood-insurance boundaries, property ownership, channel depth, water quality, or current river stage. Anyone making a safety or property decision should use the appropriate current agency data rather than treating a static county map as a live water-condition product.
A 227–320 meter range reveals Cedar River lowlands and higher western ground
The elevation map gives a local mapped range of approximately 227 to 320 meters, with a mean near 268 meters. Greens represent the lower part of that local range, while yellow, tan, and brown mark progressively higher terrain. The most obvious low area is the broad, winding green corridor associated with Cedar River in the north-central part of the county. When the river on the water map is compared with the elevation image, the match between the channel and the lower valley is immediate.
Higher ground is more extensive across the western and west-central parts of the county. Brown and tan ridges are repeatedly cut by narrow green tributary valleys, producing a much more dissected surface than the straight road grid on the general map might suggest. Similar but narrower low corridors follow Prairie Creek in the south and other tributaries toward the east. The county does not contain mountain-scale relief, but local height differences are frequent enough to create a rolling landscape with many short ridges and creek bottoms.
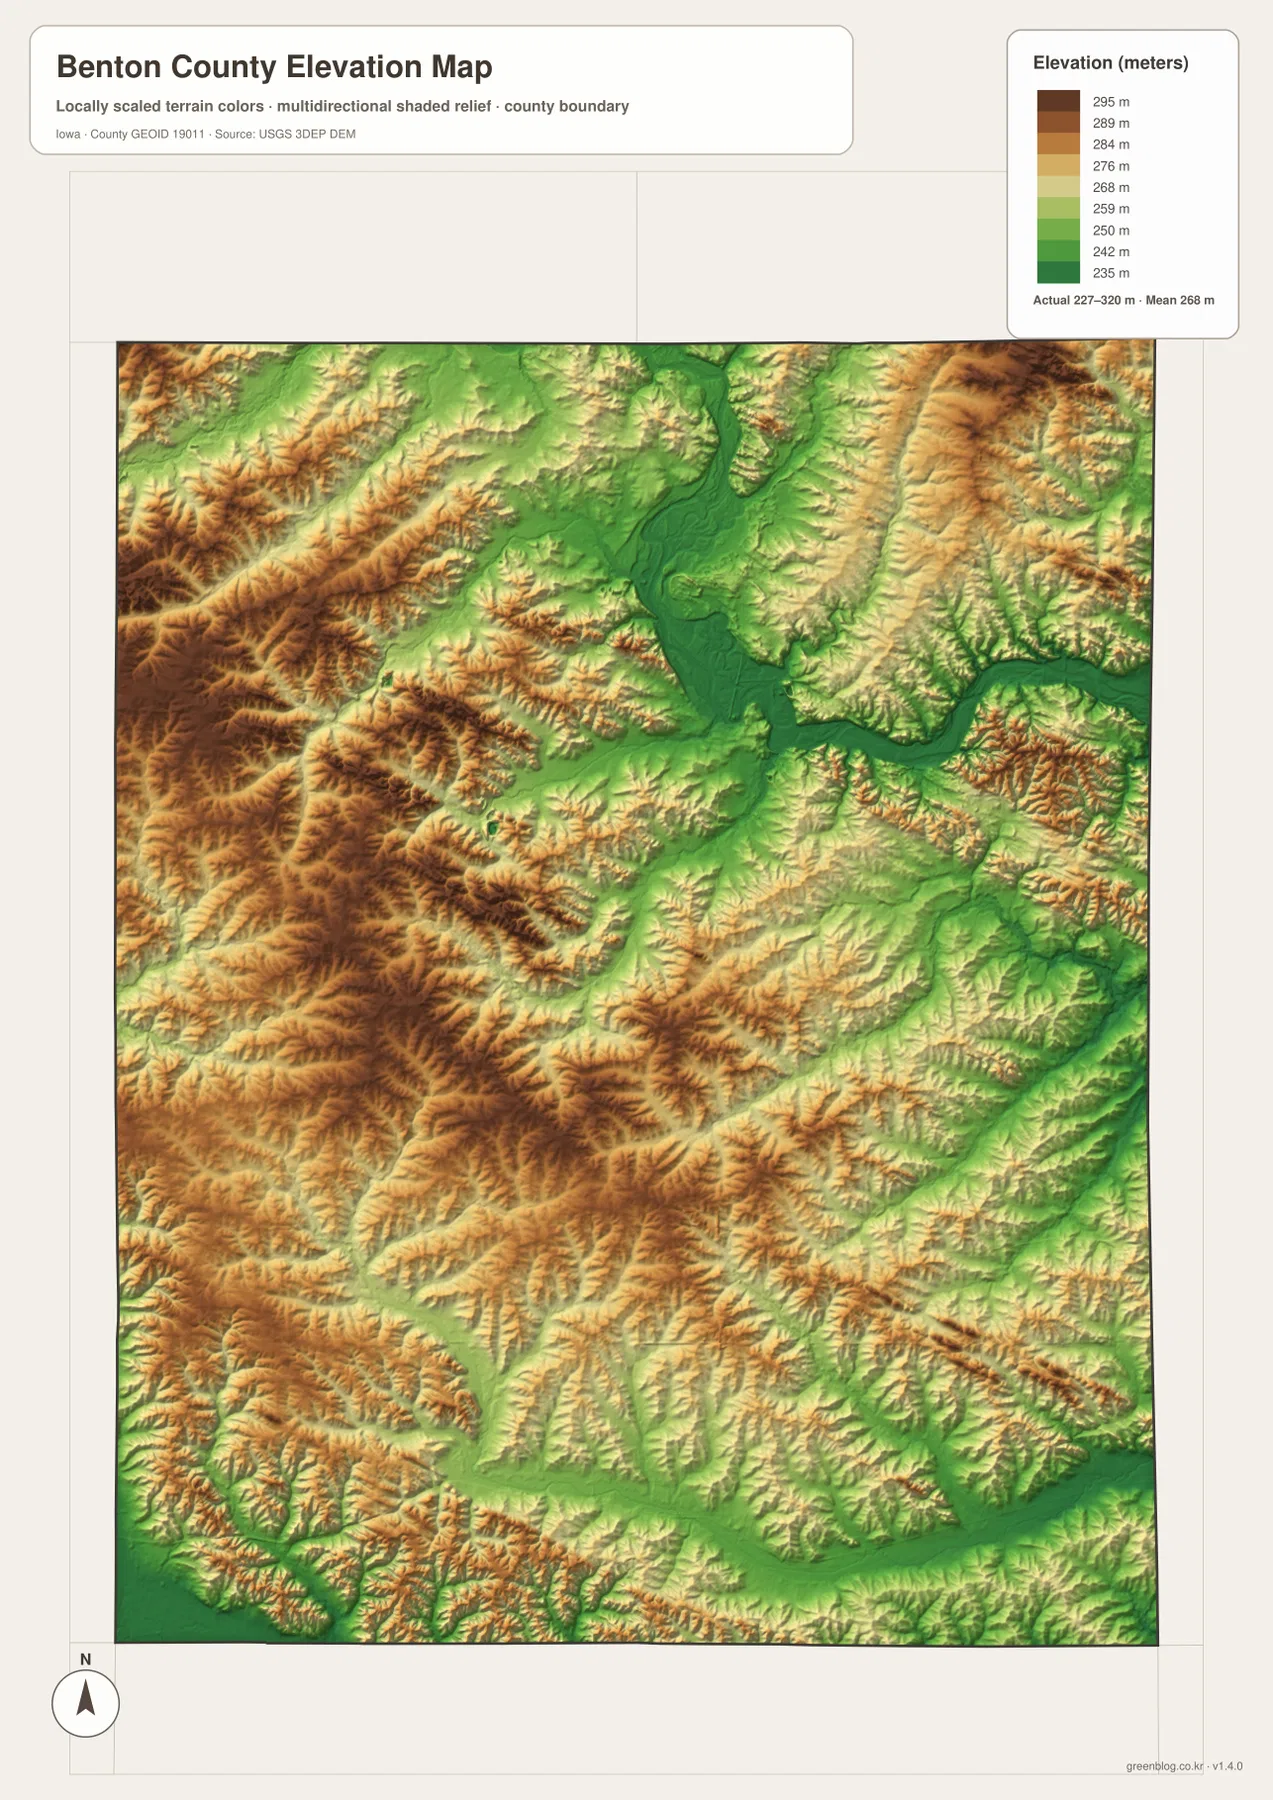
The elevation layer also changes how the major roads are understood. U.S. 30 runs across the southern county, but it does not stay within a single elevation color. U.S. 218 and roads around Vinton likewise cross from upland terrain into lower river corridors. A straight line on a road map can therefore cross several small valleys and ridges. Looking at the elevation image after locating a route on the general map is a practical way to see why apparently simple rural travel can involve repeated rises and descents.
The colors should be used for county-scale comparison, not as survey-grade measurements. They are appropriate for identifying broad lowlands, uplands, and tributary valleys, but they cannot determine a building-pad elevation, parcel slope, drainage design, or construction grade. For engineering or property work, use a higher-resolution official elevation product or field survey. Here, the map’s best role is to show how Cedar River and the creek network are connected to the visible shape of the land.
Reading roads and valleys together clarifies Vinton and the southern towns
Vinton is a good example of why the four views belong together. On the general map it looks like the central road hub of northern Benton County. On the water map, Cedar River curves beside the same area. On the elevation map, that river occupies a broad green lowland with higher terrain rising away from the valley. Those three observations explain Vinton more fully than a city label alone: it is an administrative and transportation center positioned beside one of the county’s strongest natural corridors.
The southern towns require a different frame. U.S. 30 is the major east–west guide, with Van Horne and Newhall near the corridor and Belle Plaine, Blairstown, Norway, and Walford distributed farther south or southeast. Prairie Creek and numerous smaller tributaries cut through the same area. On the elevation map, green creek bottoms repeatedly interrupt the higher rolling ground. This is why a road-only interpretation of southern Benton County can miss much of the terrain that shapes the route between towns.
Urbana and Atkins show a third pattern. Urbana is associated with the northeastern I-380 and Iowa 150 area, while Atkins is farther south and east within a denser field of local roads and tributaries. Bear Creek and Wildcat Creek help organize the water geography of that side of the county. Comparing all of the maps makes it easier to see that “east Benton County” is not one uniform zone; its towns occupy different road and creek settings.
If only one map is needed, choose according to the question. Use the general county map for towns, route numbers, and overall boundaries. Use the city map for a simplified view of the six highlighted communities. Switch to the terrain-and-water map when river and creek names matter, and use the elevation map when the difference between valley bottoms and higher ridges is the main concern. The maps are most informative when a place is located first and then followed across the other layers.
The WebP images embedded in the article are optimized previews. The download archive contains the corresponding original JPG files for the general county map, city-distribution map, terrain-and-water map, and elevation map. Each JPG is 2572×3638 pixels in portrait orientation, which makes small route labels and creek names easier to inspect when zoomed or printed. Reviewing the previews first can help you choose the relevant map before opening the larger files.
For printing or close inspection, the JPG originals are preferable to the reduced page previews. Static maps should still be paired with current sources when the task depends on changing information. Iowa DOT is the better source for current transportation references, USGS products are appropriate for hydrography and elevation data, and the Census Bureau should be used when a current population value is required rather than relying on a number printed on a static city graphic.
Frequently Asked Questions
Which map best explains Vinton’s relationship to Cedar River?
Start with the general map to locate Vinton and the major roads, then use the terrain-and-water map to follow Cedar River beside the city. The elevation map adds the final piece by showing the river corridor as lower green terrain surrounded by higher ridges and uplands.
Are the numbers in the city index current population figures?
They are best treated as reference values printed on the source map, not as guaranteed current statistics. For the latest population information, consult the U.S. Census Bureau. The city map is most useful for comparing the positions of Vinton, Belle Plaine, Atkins, Urbana, Walford, and Newhall across the county.
What is included in the downloadable ZIP?
The archive contains four high-resolution JPG files matching the general county map, city-distribution map, terrain-and-water map, and elevation map shown above. Each image is 2572×3638 pixels, providing more detail for zooming and printing than the embedded WebP previews.
Map File Information
Download the Benton County maps shown in this article as high-resolution JPG files.
- Printable Size: 2572×3638 pixels each
Related Maps
Sources and references
- Benton County official website — county background and Vinton county-seat context
- Benton County Conservation Parks — Cedar River access sites and Hannen Lake Park information
- Iowa Department of Transportation – Benton County Maps — county and city transportation map references
- U.S. Census Bureau QuickFacts – Benton County — current population statistics
- USGS National Hydrography — hydrography reference data
- USGS 3D Elevation Program — elevation reference data
Green Map creates custom-edited map images using open geographic data sources such as geoBoundaries, Natural Earth, OpenStreetMap, and government open data.
These maps are edited visual materials, not raw data files, and are provided for education, documents, presentations, and graphic reference.