Peach County is agricultural first, but its two main built centers give the map a distinct shape. Agriculture covers 37.58% of the supplied 2025 classification, forest 31.11%, developed land 18.41%, and wetlands 7.95%. A large hard-surface cluster sits around Fort Valley in the west-central county, while Byron forms a separate northeastern center near Interstate 75. This Peach County Georgia Land Cover Map shows how farms and woods fill much of the space between them.
The page includes four WebP views for current land cover, vegetation, impervious surface, and the 1985–2025 endpoint comparison. Four original 2480 × 1754 JPG maps are bundled in one ZIP for county profiles, agricultural context, lessons, and presentations.
Table of Contents
Fort Valley forms the largest built center inside an agricultural landscape
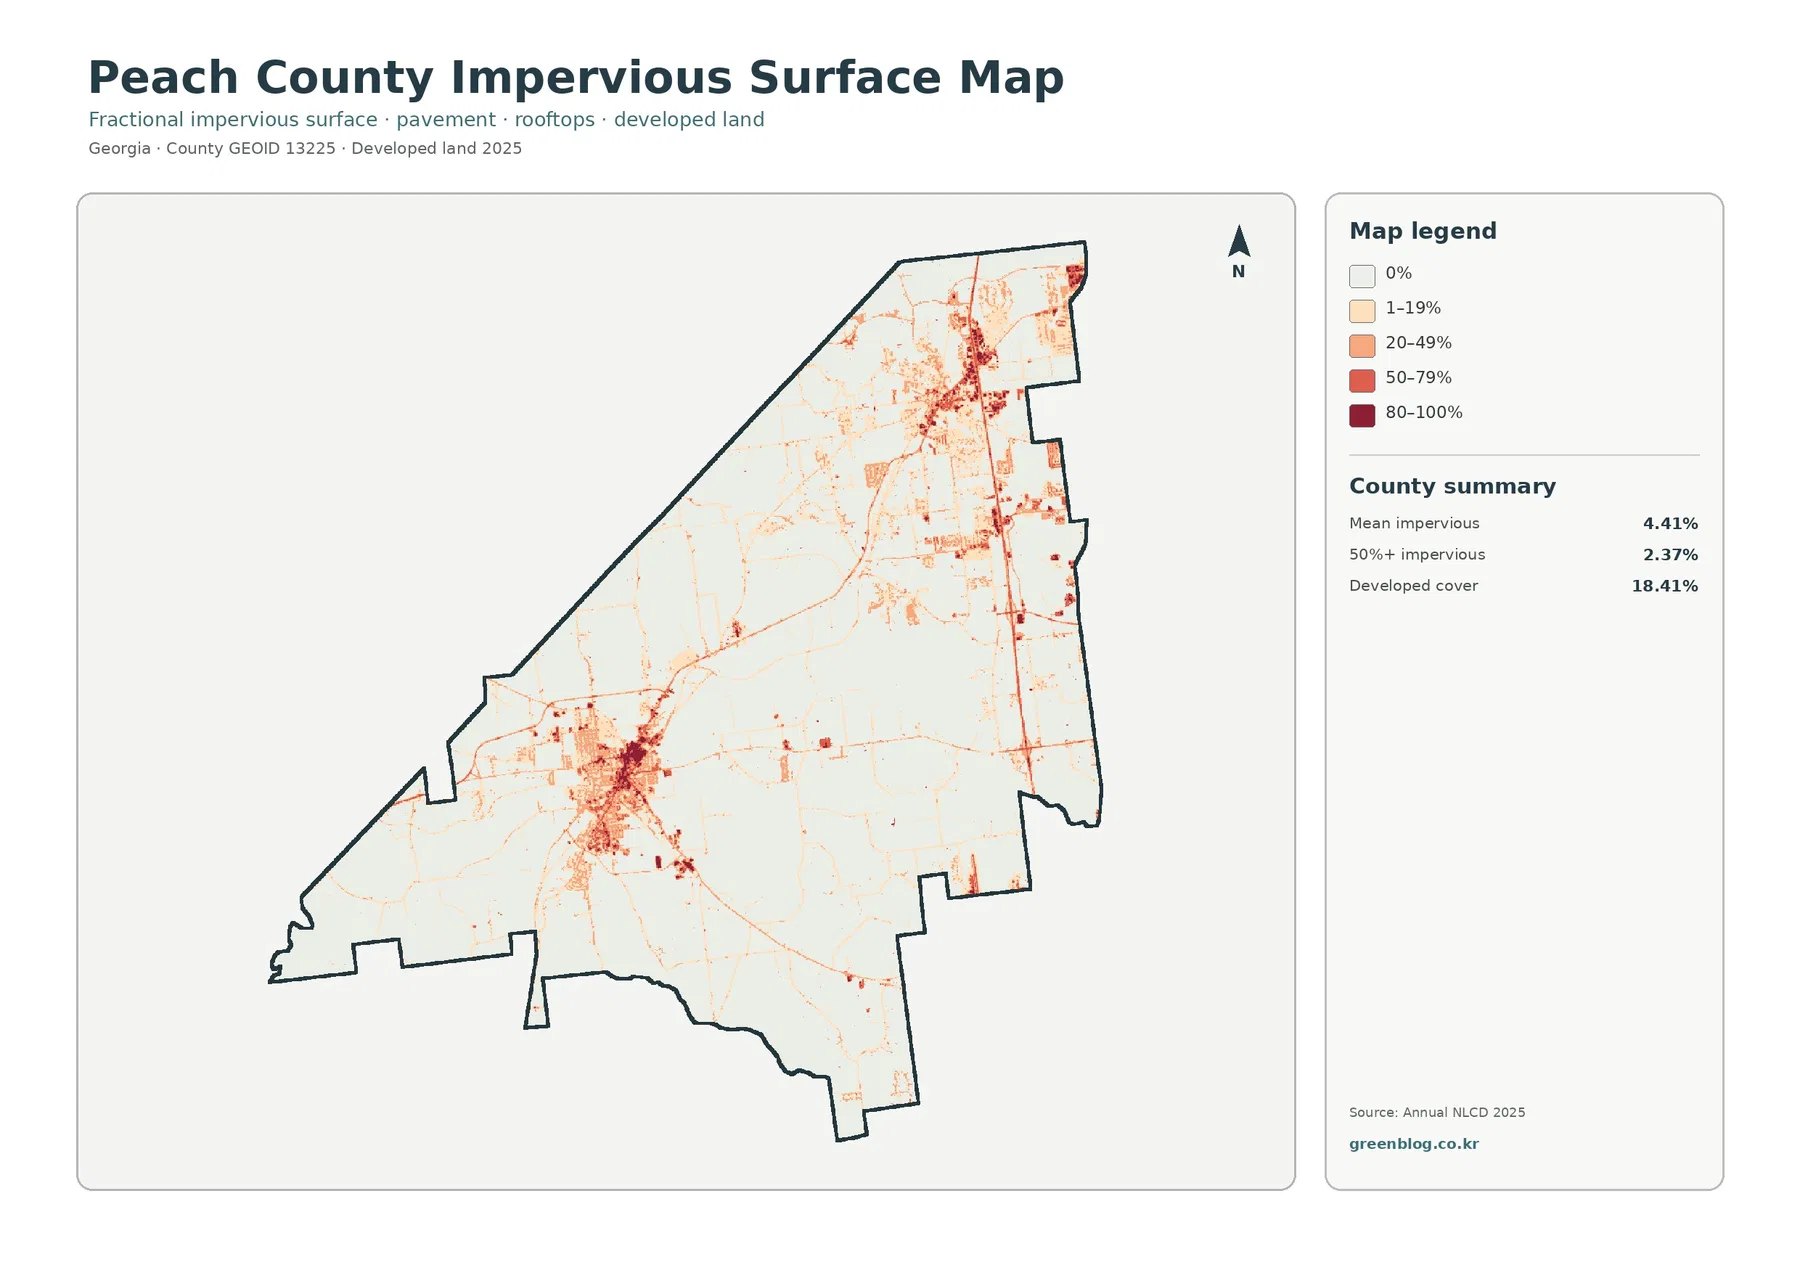
The strongest west-central hard-surface cluster is a useful reference for Fort Valley, which the city’s official site identifies as the Peach County seat. Darker impervious cells form a compact center, while lower values spread along several road-shaped lines into surrounding farms and woodland. The built area is substantial, but it does not fill the western half of the county.
Fort Valley’s official description places the city at the heart of a major Georgia peach-producing region and notes a large peach packing and retail operation near town. Peach County Extension similarly says peaches and pecans make up much of its agricultural workload. Those sources give local meaning to the broad farm cover around Fort Valley without turning every agricultural pixel into a peach orchard.
Byron creates a second development center tied to Interstate 75
A second large hard-surface cluster occupies the northeast. Byron’s official website says Interstate 75 exits lie within the city limits and emphasizes the city’s proximity to Macon, Warner Robins, and Robins Air Force Base. That transportation setting helps explain why the northeastern developed pattern is separated from Fort Valley yet still substantial.
Byron also describes new subdivisions, an industrial park, and continued growth while noting that agricultural fields and peach and pecan orchards remain only minutes away. The 2025 raster has the same broad contrast: concentrated development in the northeast is surrounded by farm blocks, forest, and smaller wet areas rather than by continuous urban cover.
Road-shaped impervious lines can support this interpretation, but route names are not encoded in the raster. Interstate 75 and other roads should be confirmed with Census TIGER/Line or local transportation data rather than assigned from shape alone.
Agriculture is the largest countywide class at 37.58%
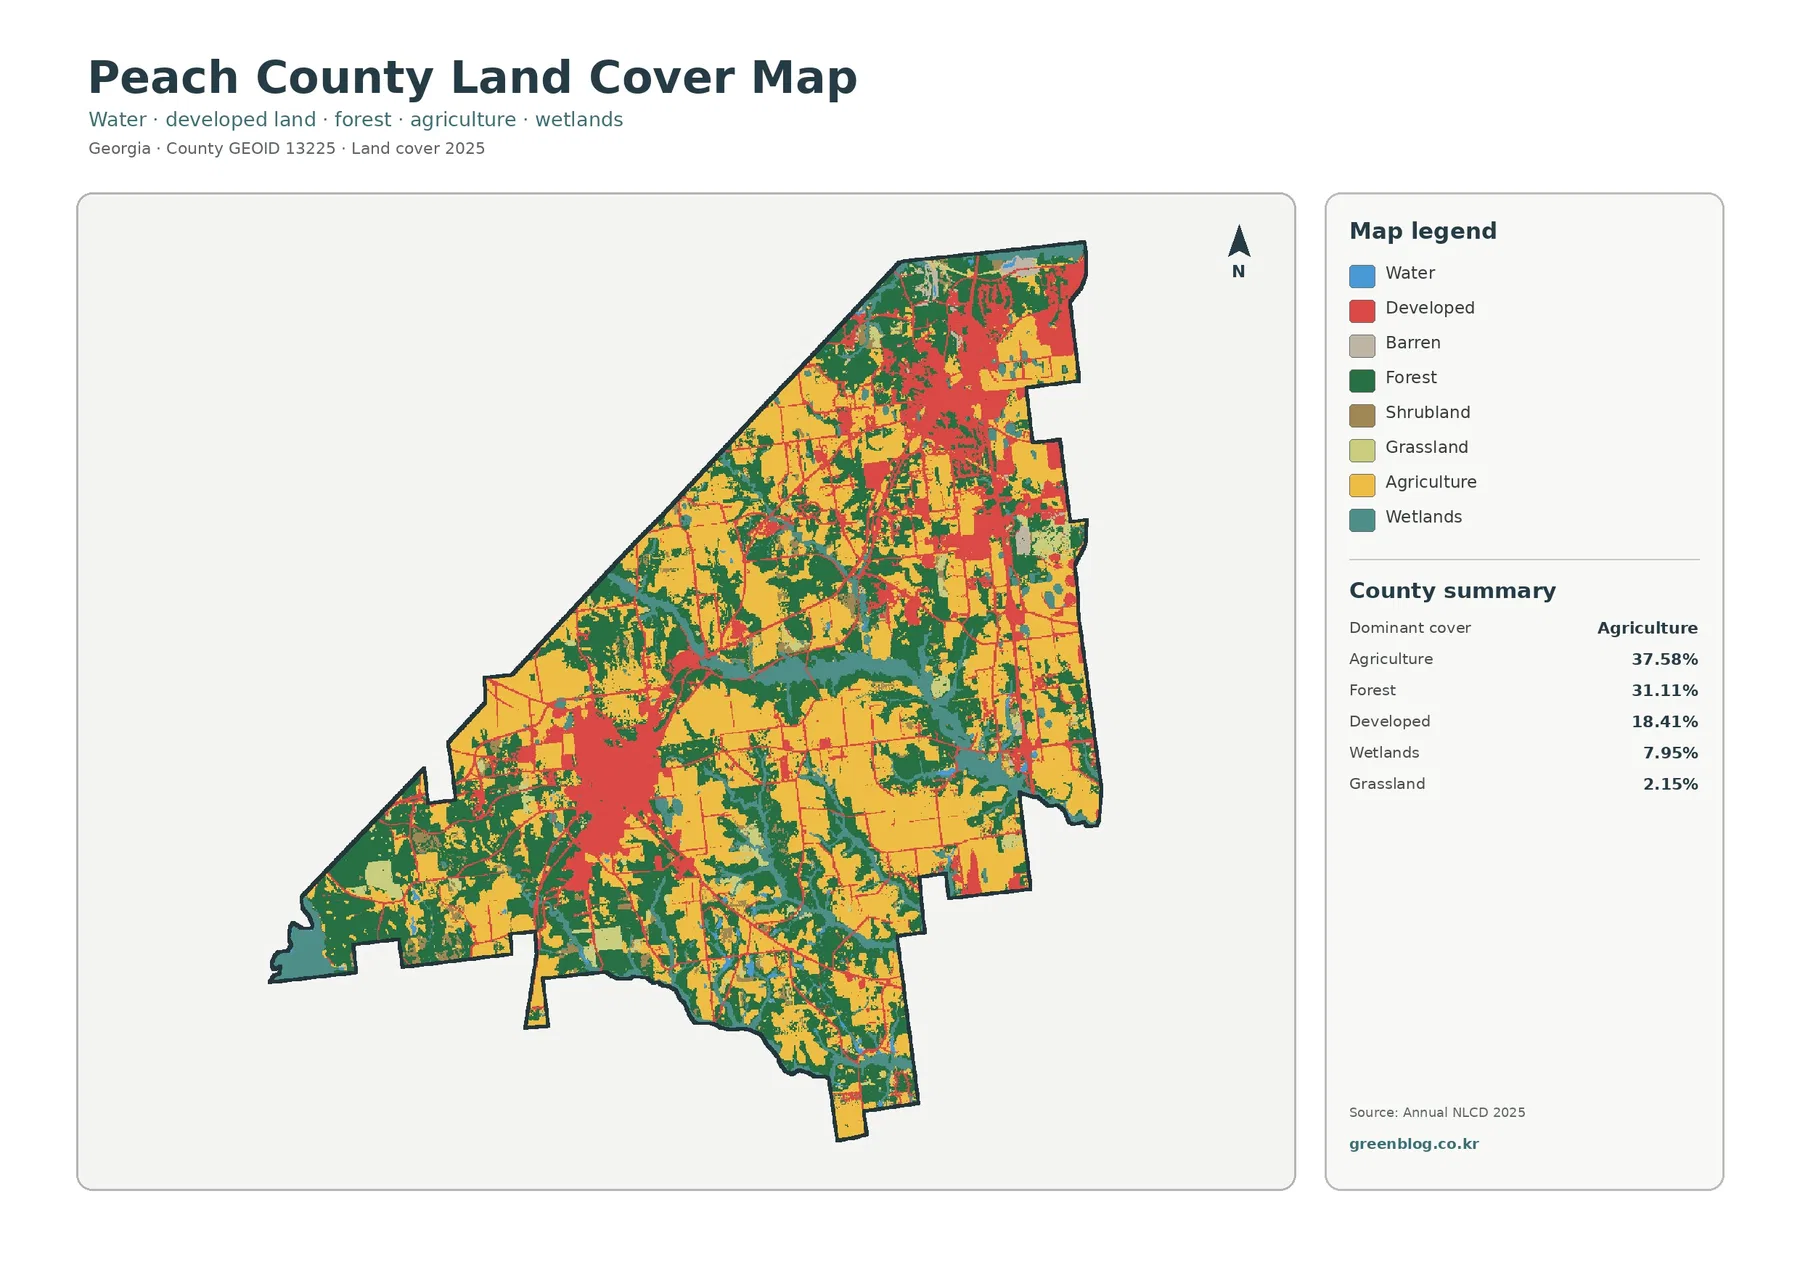
Yellow agricultural cover is extensive in the north, east, center-south, and western portions. Large farm blocks surround both major settlement areas and continue through the space between them. Agriculture therefore shapes the county at a much broader scale than either Fort Valley or Byron.
Forest covers 31.11%, making it almost as important as agriculture. Larger green areas are visible in the southwest, center, and along the southern edge, while wooded strips repeatedly divide fields elsewhere. Peach County is better described as a farm-and-forest landscape with two built centers than as a county dominated by one continuous type of open land.
Developed land is 18.41%, wetlands 7.95%, and grassland 2.15%. The vegetation summary adds shrubland at 1.91% and open water at only 0.43%. Teal wetland areas are much more extensive than blue open water, so wetland cover should not be mistaken for exposed ponds or channels.
The vegetation view shows why the county name should not be read as a peach-orchard map
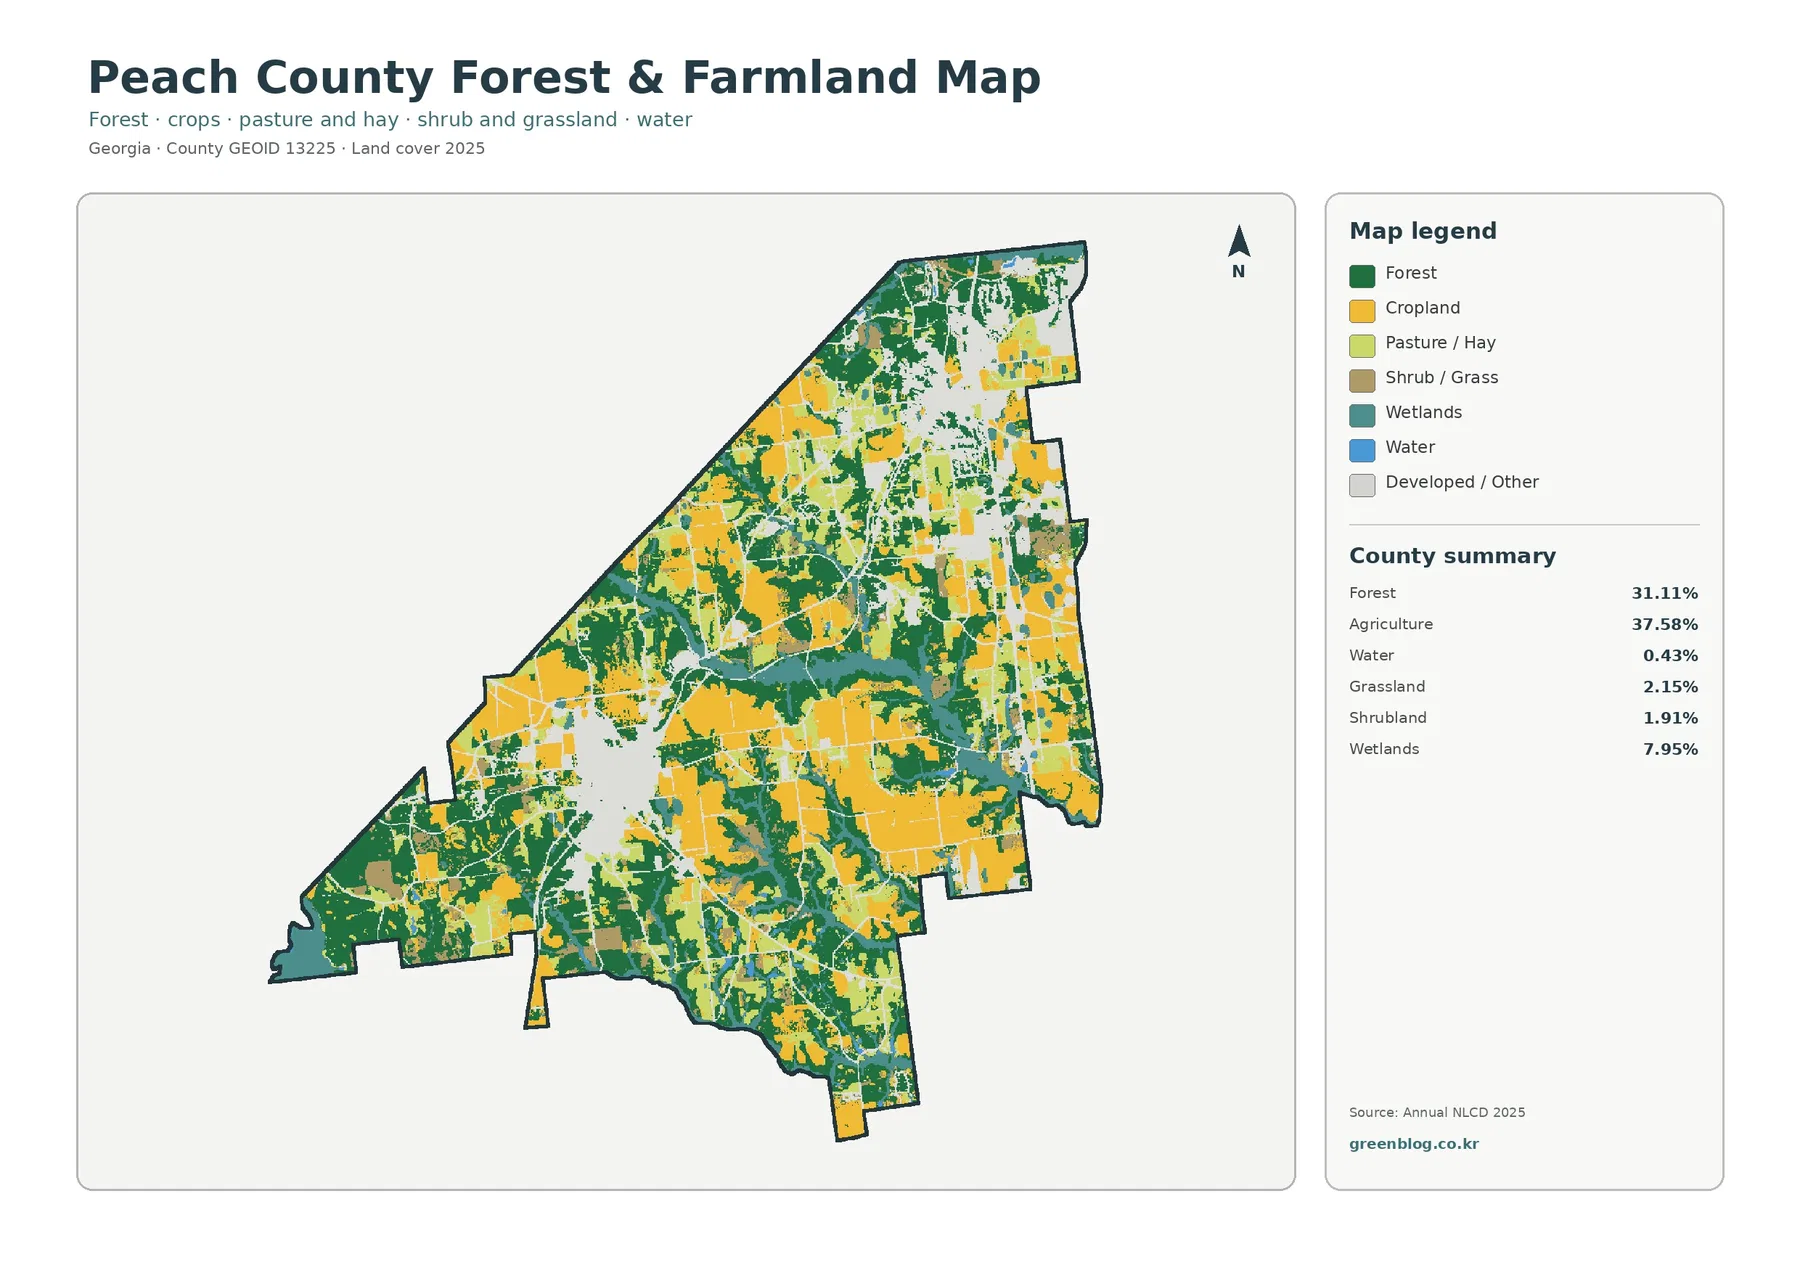
With developed cover muted, broad farm blocks become even more obvious, especially across the north and east. Forest creates strong interruptions in the southwest and center, while wetlands form elongated patches through lower areas. The two town centers become light gaps within a much larger rural surface.
Peach County Extension reports that peaches and pecans account for much of its workload, but the office also serves agronomic crops, large greenhouses, sod, and nursery production. That matters when reading the map. The yellow agriculture category can contain different production systems, and this county-scale raster does not identify individual orchards or crop species.
Annual NLCD uses 30-meter cells, so orchard edges, tree rows, roads, small ponds, farm structures, and mixed rural lots can look simplified.
A 4.41% impervious mean shows that hard surfaces are concentrated rather than countywide
Although developed land covers 18.41%, the countywide mean impervious value is only 4.41%. Just 2.37% of Peach County reaches 50% impervious surface or higher. The difference exists because developed classes can contain lawns, trees, yards, and exposed soil, while the impervious layer isolates roofs, pavement, parking areas, and similar hard surfaces.
The two darkest concentrations line up with Fort Valley and Byron, while most farm and forest areas remain pale. The contrast shows development intensity but is not a flood-risk estimate.
The 1985–2025 comparison spreads far beyond the places classified to developed
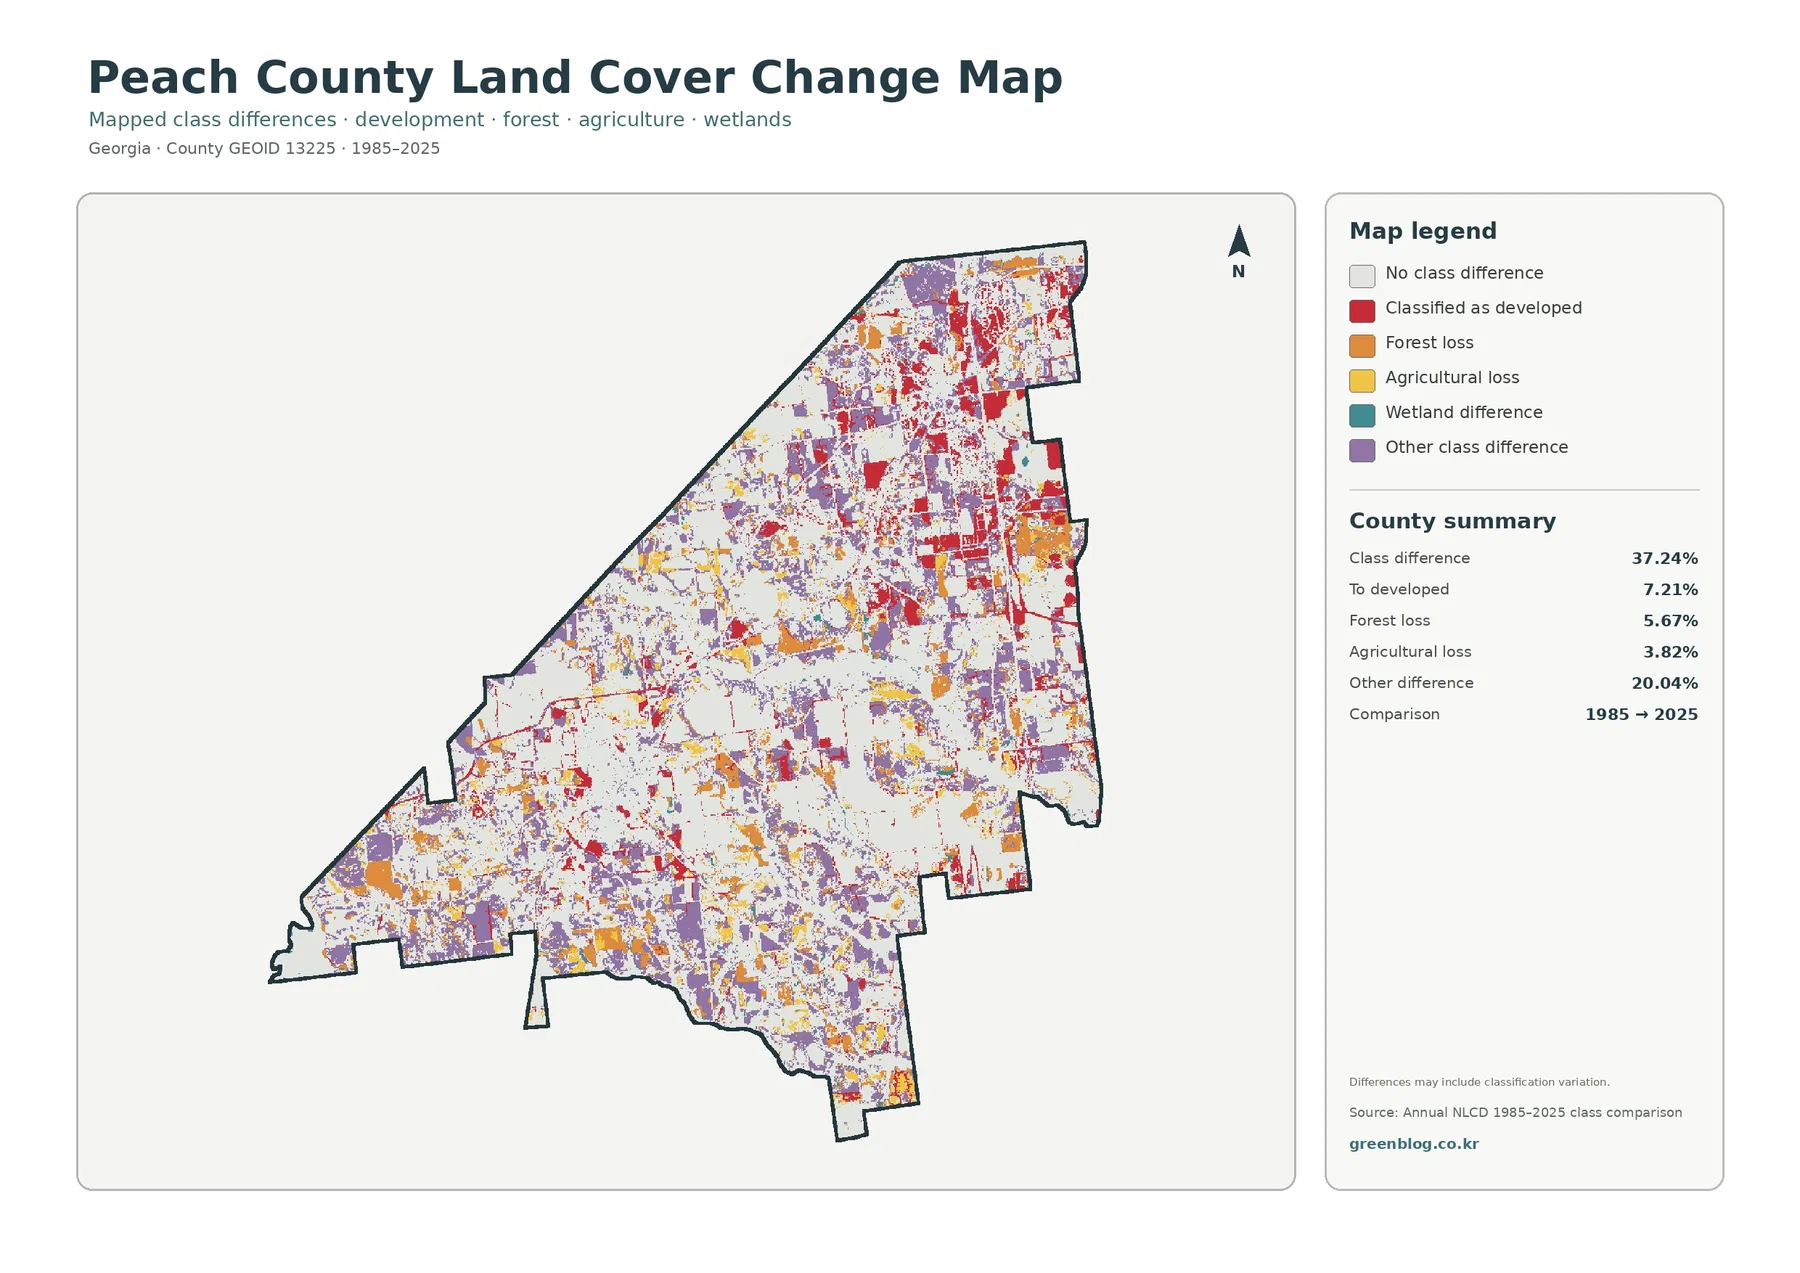
The total endpoint class difference is 37.24%. That figure counts cells assigned different categories in 1985 and 2025. It is not the share of Peach County that was urbanized or damaged, and it cannot be subtracted from the current agricultural or developed percentage to recreate an earlier map.
The printed summary lists 20.04% other difference, 7.21% classified to developed, 5.67% forest loss, and 3.82% agricultural loss. Developed-change red is especially visible around Byron, Fort Valley, and road-oriented areas between or beyond the two centers. Forest-loss orange, agricultural-loss yellow, and other-difference purple are distributed much more widely across the county.
Wetland difference appears in the legend without its own printed percentage. The missing value should not be reconstructed by subtraction. The map also notes that classification variation may be included, so intermediate imagery and local land-use records are needed before assigning a cause to a particular change patch.
Land cover is different from orchard boundaries, zoning, and ownership
Agricultural color does not identify a peach or pecan orchard, and it does not mark a farm parcel. Green forest does not establish ownership or protected status, teal wetland cover is not a regulatory wetland determination, and red developed cover does not show zoning.
Choosing the four JPGs for Peach County
Use the 2025 countywide map first when the goal is to show agriculture, forest, and the two main development centers together. The vegetation view is better for the county’s broad farm-and-forest surface. Choose the impervious map for Fort Valley and Byron hard surfaces, and reserve the endpoint map for a separate discussion of 1985–2025 classification differences.
Each JPG measures 2480 × 1754 pixels and suits reports, lessons, and presentations. Test a proof before large-format printing because the package does not mark the files as A3 high-resolution assets.
Frequently Asked Questions
What is the largest land-cover class in Peach County?
Agriculture is the largest class in the supplied 2025 summary at 37.58%. Forest follows at 31.11% and developed land at 18.41%, with Fort Valley and Byron forming two distinct built centers.
Does the agriculture color identify peach orchards?
No. Local Extension sources confirm the importance of peaches and pecans, but the countywide land-cover category does not identify individual crops or orchard boundaries.
Does the 37.24% endpoint difference measure development growth?
No. It counts all cells with different class labels in 1985 and 2025. The summary separately lists 7.21% classified to developed, 5.67% forest loss, 3.82% agricultural loss, and 20.04% other difference.
Sources and Reference Data
- MRLC Annual NLCD Data – official access to annual land-cover and comparison products
- USGS Annual NLCD Land Cover Classification – definitions for agriculture, forest, developed land, wetlands, and related classes
- U.S. Census Bureau TIGER/Line Shapefiles – authoritative county, place, and transportation layers for comparison
- City of Fort Valley – About Fort Valley – official context for the county seat and Fort Valley’s peach-producing heritage
- City of Byron – About Byron – official context for Interstate 75 access, local growth, and nearby agriculture
- UGA Extension – Peach County Impact – county-specific information on peaches, pecans, agronomic crops, greenhouses, sod, and nursery production
Map File Information
The ZIP contains four original JPG maps for comparing Peach County's 37.58% agricultural cover, 31.11% forest, Fort Valley and Byron development, impervious surfaces, wetlands, and 1985–2025 class differences.
- Included Files: Four original JPG land-cover maps
- File Type: JPG files in one ZIP archive
- Intended Use: Printing, education, presentations, and map-based projects
Related Maps
- Appling County Georgia Land Cover Map
- Atkinson County Georgia Land Cover Map
- Bacon County Georgia Land Cover Map
Green Map creates custom-edited map images using open geographic data sources such as geoBoundaries, Natural Earth, OpenStreetMap, and government open data. These maps are edited visual materials, not raw data files, and are provided for education, documents, presentations, and graphic reference.