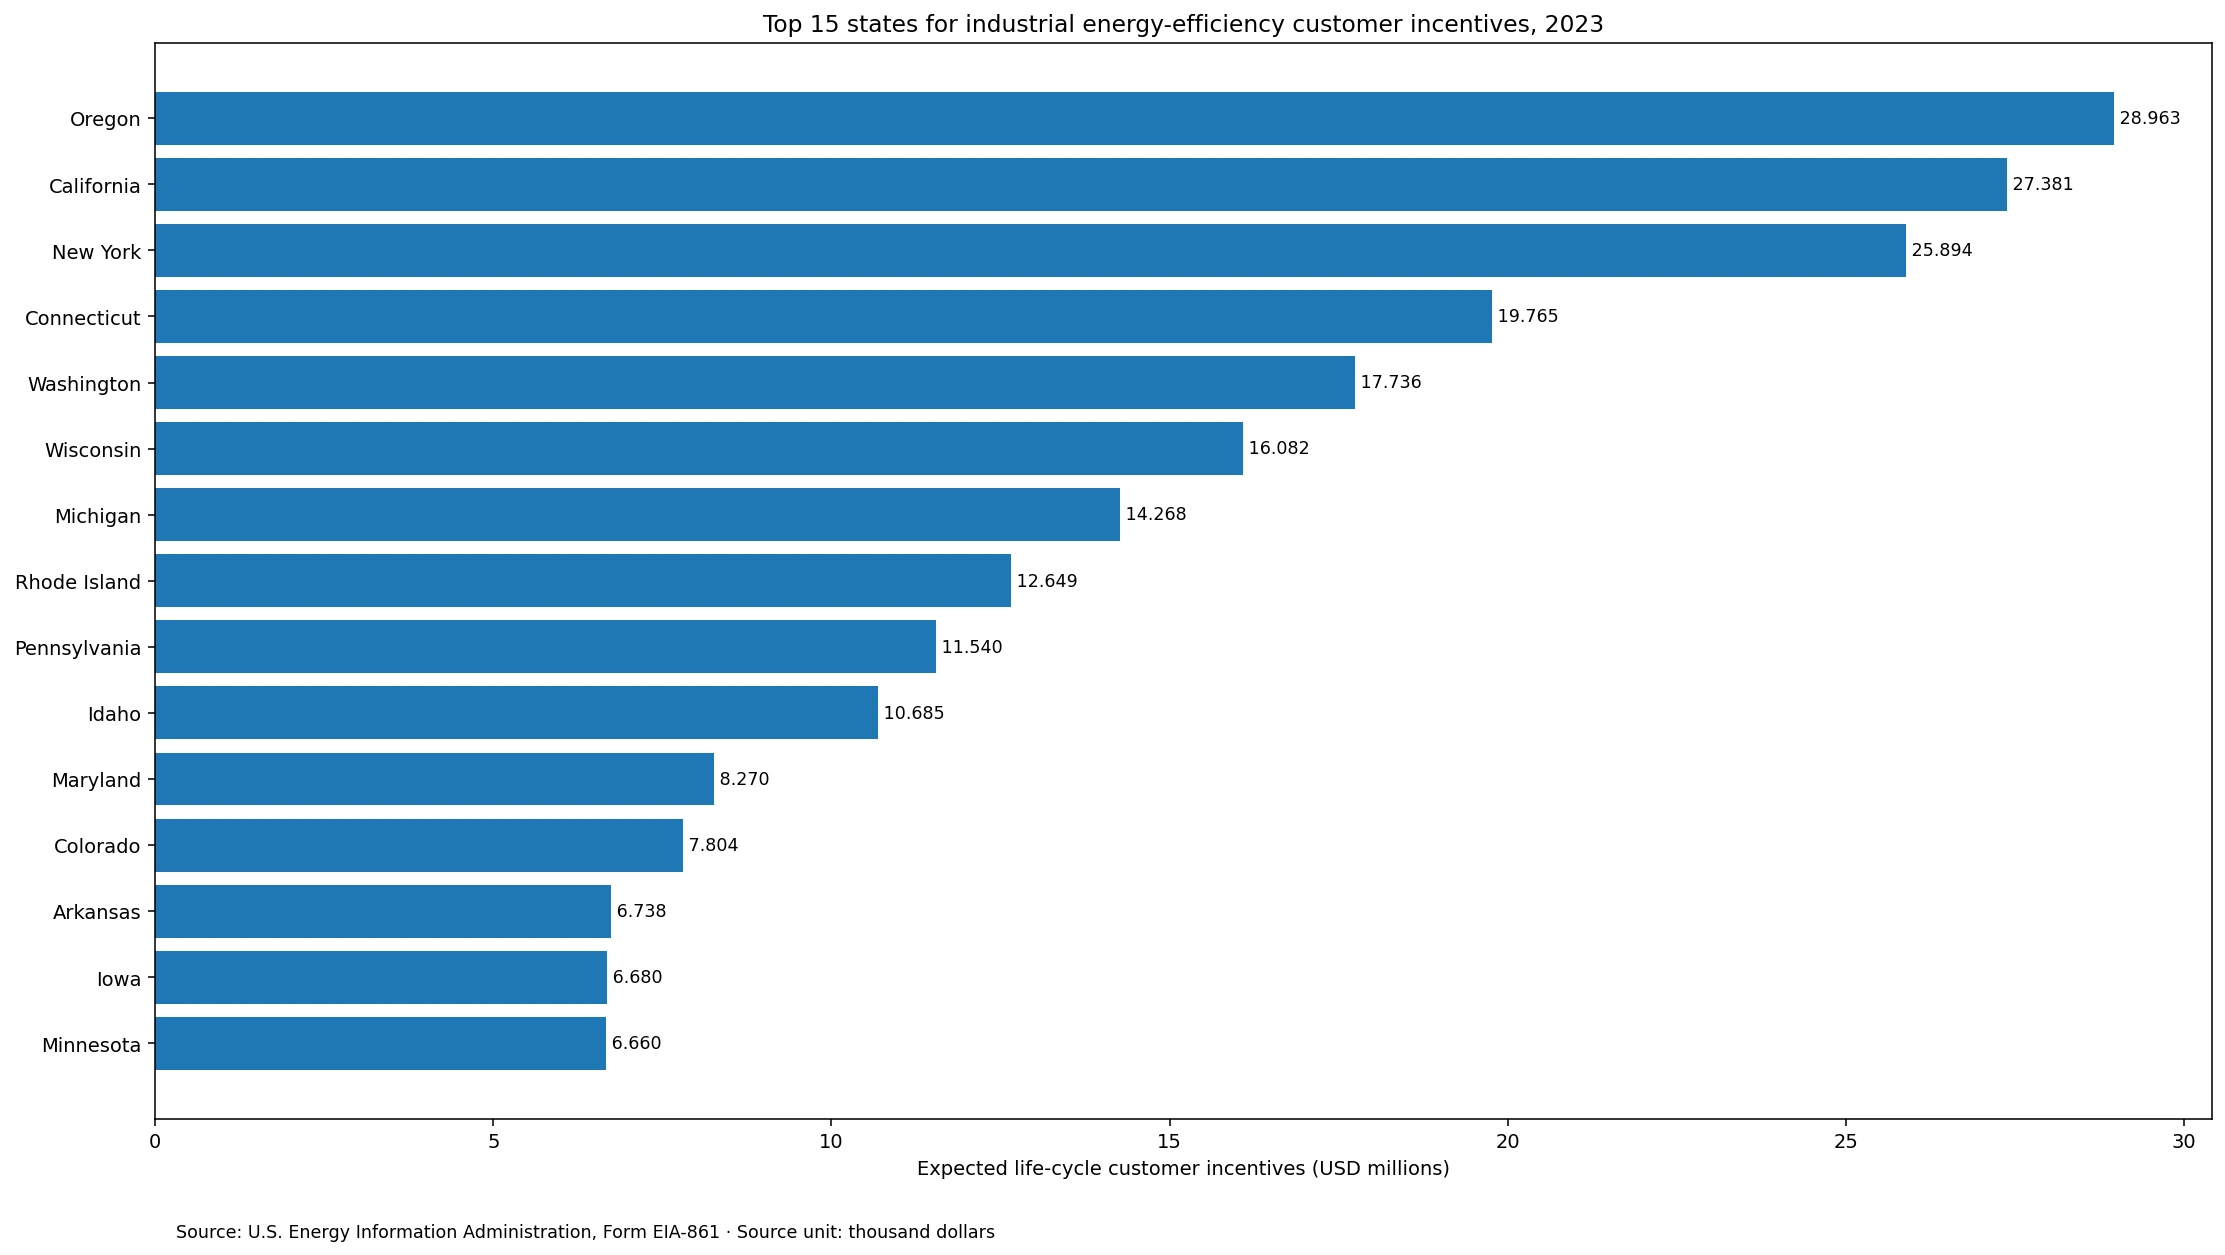
Customer incentives tied to industrial energy-efficiency programs vary widely across U.S. states in the 2023 reporting data. In the U.S. Energy Information Administration (EIA) State Electricity Profiles slice for Industrial + Expected Life Cycle of Programs + Customer Incentive, Oregon is highest at $28.963 million. California follows at $27.381 million and New York at $25.894 million. The 50 states and the District of Columbia sum to $252.898 million.
These amounts are not industrial electricity bills, fuel expenditures, or a simple total of cash rebates paid during calendar year 2023. They belong to EIA’s energy-efficiency program cost framework. The cost field is Customer Incentive, and the time-period facet is Expected Life Cycle of Programs. The safest interpretation is therefore the reported expected life-cycle customer-incentive amount associated with industrial energy-efficiency programs in the 2023 data slice.
Table of Contents
Customer incentives are a program-cost measure, not industrial energy spending
Form EIA-861 collects information on electricity energy-efficiency programs, including energy savings, peak-demand savings, and associated costs. Such programs can encourage customers to adopt more efficient equipment or processes while maintaining the service or production activity they need. The customer-incentive field represents a program-cost category associated with economic support for participating customers. It should not be substituted for the total amount industrial customers spend on electricity or other fuels.
The sector filter is Industrial, so residential, commercial, and transportation program incentives are excluded. A large absolute value also does not establish that a state has the most effective policy or the greatest electricity savings. Program scale, the number and size of industrial customers, participation, the technologies supported, program life, and reporting coverage can all affect the total. Assessing efficiency would require matched savings and participation data in addition to this cost field.
Oregon, California, and New York account for 32.5% of the state sum
Oregon contributes 11.5% of the 51-jurisdiction sum, California 10.8%, and New York 10.2%. Together the top three total $82.238 million, or 32.5% of the sum.
Adding Connecticut and Washington brings the top-five total to $119.739 million, equivalent to 47.3%. The top ten reach $184.963 million and 73.1% of the state sum. The top fifteen account for 87.4%. This concentration means a relatively small group of states drives most of the aggregate dollar amount.
The $4.959 million mean is far above the $1.032 million median
The arithmetic mean across 51 jurisdictions is $4.959 million, while the median is $1.032 million. The mean is about 4.8 times the median because the largest observations pull the average upward. The first quartile is $0.052 million and the third quartile is $6.709 million. For this skewed distribution, the median, quartiles, and concentration shares are more informative than the mean alone.
| Customer-incentive band | Jurisdictions |
|---|---|
| $0 | 9 |
| Over $0 to $0.1 million | 6 |
| Over $0.1 to $0.5 million | 5 |
| Over $0.5 to $1 million | 5 |
| Over $1 to $5 million | 11 |
| Over $5 to $10 million | 5 |
| Over $10 to $20 million | 7 |
| Over $20 million | 3 |
Exactly 9 jurisdictions report $0 in this slice, and all 51 rows contain numeric observations. The zeroes are therefore not missing values. 25 jurisdictions, or 49.0%, are at or below $1 million. 10 exceed $10 million, and 3 exceed $20 million. A zero in this exact field does not prove that a state had no industrial energy-efficiency activity; other cost or savings fields may be nonzero.
Complete 2023 ranking for all 51 jurisdictions
The table below sorts the same 2023 Industrial + Expected Life Cycle of Programs + Customer Incentive observations from highest to lowest. Shares use the direct state-data sum of $252.898 million as the denominator. Display values convert the source unit of thousand dollars to USD millions; rankings are calculated from the unconverted observations.
| Rank | State or jurisdiction | Expected life-cycle customer incentives (USD millions) | Share of 51-row sum |
|---|---|---|---|
| 1 | Oregon (OR) | 28.963 | 11.5% |
| 2 | California (CA) | 27.381 | 10.8% |
| 3 | New York (NY) | 25.894 | 10.2% |
| 4 | Connecticut (CT) | 19.765 | 7.8% |
| 5 | Washington (WA) | 17.736 | 7.0% |
| 6 | Wisconsin (WI) | 16.082 | 6.4% |
| 7 | Michigan (MI) | 14.268 | 5.6% |
| 8 | Rhode Island (RI) | 12.649 | 5.0% |
| 9 | Pennsylvania (PA) | 11.540 | 4.6% |
| 10 | Idaho (ID) | 10.685 | 4.2% |
| 11 | Maryland (MD) | 8.270 | 3.3% |
| 12 | Colorado (CO) | 7.804 | 3.1% |
| 13 | Arkansas (AR) | 6.738 | 2.7% |
| 14 | Iowa (IA) | 6.680 | 2.6% |
| 15 | Minnesota (MN) | 6.660 | 2.6% |
| 16 | Oklahoma (OK) | 4.911 | 1.9% |
| 17 | New Mexico (NM) | 4.489 | 1.8% |
| 18 | Florida (FL) | 3.089 | 1.2% |
| 19 | Utah (UT) | 3.089 | 1.2% |
| 20 | Arizona (AZ) | 2.408 | 1.0% |
| 21 | Missouri (MO) | 2.124 | 0.8% |
| 22 | Indiana (IN) | 1.540 | 0.6% |
| 23 | Wyoming (WY) | 1.349 | 0.5% |
| 24 | Illinois (IL) | 1.185 | 0.5% |
| 25 | New Jersey (NJ) | 1.095 | 0.4% |
| 26 | Tennessee (TN) | 1.032 | 0.4% |
| 27 | Nebraska (NE) | 0.948 | 0.4% |
| 28 | New Hampshire (NH) | 0.928 | 0.4% |
| 29 | Texas (TX) | 0.779 | 0.3% |
| 30 | South Carolina (SC) | 0.757 | 0.3% |
| 31 | Montana (MT) | 0.690 | 0.3% |
| 32 | Alabama (AL) | 0.289 | 0.1% |
| 33 | Louisiana (LA) | 0.216 | 0.1% |
| 34 | Mississippi (MS) | 0.213 | 0.1% |
| 35 | Ohio (OH) | 0.203 | 0.1% |
| 36 | Massachusetts (MA) | 0.190 | 0.1% |
| 37 | Virginia (VA) | 0.090 | 0.0% |
| 38 | North Carolina (NC) | 0.063 | 0.0% |
| 39 | Georgia (GA) | 0.041 | 0.0% |
| 40 | South Dakota (SD) | 0.033 | 0.0% |
| 41 | Kentucky (KY) | 0.031 | 0.0% |
| 42 | Hawaii (HI) | 0.001 | 0.0% |
| 43 | Alaska (AK) | 0.000 | 0.0% |
| 44 | Delaware (DE) | 0.000 | 0.0% |
| 45 | District of Columbia (DC) | 0.000 | 0.0% |
| 46 | Kansas (KS) | 0.000 | 0.0% |
| 47 | Maine (ME) | 0.000 | 0.0% |
| 48 | Nevada (NV) | 0.000 | 0.0% |
| 49 | North Dakota (ND) | 0.000 | 0.0% |
| 50 | Vermont (VT) | 0.000 | 0.0% |
| 51 | West Virginia (WV) | 0.000 | 0.0% |
The $253.091 million national table and the state sum differ by just 0.08%
EIA Electric Power Annual Table 10.2 reports $253.091 million for 2023 Industrial Life Cycle Costs – Customer Incentive. The direct state-and-District sum here is $252.898 million, a difference of $0.193 million, or about 0.08% of the national figure. The two presentations are therefore very close in scale, but the article does not force them into exact equality. State rankings and shares are calculated only from the internally consistent 51-row series.
The same national table reports $163.528 million of 2023 industrial life-cycle all-other costs. Combining the two reported cost categories gives $416.619 million, with customer incentives representing about 60.7% of that two-category amount. The categories should still remain separate because they represent different types of program cost.
Life-cycle cost is not the same as cash paid only during 2023
EIA’s energy-efficiency data distinguish reporting-year measures from expected life-cycle measures. Because this series uses Expected Life Cycle of Programs, it should not be restated as a simple accounting total of incentives paid during the 2023 calendar year. A question about actual reporting-year disbursements requires the reporting-year cost series or more detailed program-level financial data.
The time boundary also matters for cost-effectiveness calculations. A dollars-per-MWh ratio is only meaningful when the cost and energy-savings series use the same sector, period definition, and reporting scope. Mixing life-cycle customer incentives with reporting-year savings, or treating customer incentives as the entire program cost, would combine different concepts.
The geography shows concentration, not a causal explanation
The upper group spans several regions: Oregon and California on the Pacific Coast; New York, Connecticut, and Rhode Island in the Northeast; Wisconsin and Michigan around the Great Lakes; and other high values in Pennsylvania and Idaho. Zero and small observations are also distributed across more than one region. The pattern demonstrates geographic variation in reported incentive amounts, but this one field cannot establish whether regulation, industrial composition, electricity prices, or participation levels caused the differences.
- What the data can answer: the absolute size, ranking, distribution, and concentration of 2023 reported expected life-cycle industrial customer incentives by state.
- What the data cannot answer alone: savings per program dollar, incentive per industrial customer, policy quality, or the actual amount a company received during calendar year 2023.
- Useful follow-up data: industrial energy savings in MWh, peak-demand savings in MW, industrial customer counts, electricity sales, participant counts, and all-other program costs.
Source and calculation method
The state observations come from the U.S. Energy Information Administration Form EIA-861 detailed data and the State Electricity Profiles energy-efficiency program series. The selected slice is annual 2023 data with sector=IND, timePeriod=Expected Life Cycle of Programs, and the customer-incentive field. The source unit is thousand dollars. The national cross-check and cost-category context use Electric Power Annual Table 10.2.
The 51 jurisdiction codes are unique, all rows are dated 2023, and there are no missing numeric observations. There are 9 reported zeroes. The sum ($252.898 million), mean ($4.959 million), median ($1.032 million), quartiles, rankings, and cumulative shares are calculated directly from those 51 observations. The representative chart shows the top 15 states after converting thousand dollars to USD millions for readability.
Main takeaway
Oregon has the largest 2023 reported expected life-cycle industrial customer-incentive amount at $28.963 million, followed by California at $27.381 million and New York at $25.894 million. The top ten account for 73.1% of the state sum, and the mean is about 4.8 times the median. The series is useful for comparing the scale of one EIA program-cost category across states, but it is not a stand-alone measure of program efficiency or policy performance.
Frequently Asked Questions
Which state had the largest 2023 industrial energy-efficiency customer incentives?
Oregon ranked first at $28.963 million, followed by California at $27.381 million and New York at $25.894 million.
Are customer incentives the same as industrial electricity bills or energy expenditures?
No. They are a program-cost category associated with EIA-861 energy-efficiency programs, not the amount industrial customers spend on electricity or fuel.
Does Expected Life Cycle of Programs mean only incentives paid during calendar year 2023?
No. The reporting year is 2023, but this series is tied to expected program life-cycle costs rather than a simple one-year cash-disbursement total.
Do the $0 observations mean those states had no industrial energy-efficiency programs?
Not necessarily. Zero is the reported value for this exact industrial-sector, life-cycle, customer-incentive field; other savings or cost fields can still be nonzero.
Related Maps
Green Map creates custom-edited map images using open geographic data sources such as geoBoundaries, Natural Earth, OpenStreetMap, and government open data.
These maps are edited visual materials, not raw data files, and are provided for education, documents, presentations, and graphic reference.