Download the high-resolution A3 JPG St. Clair County Illinois Map ZIP directly from this page. The county has one of the clearest urban-to-rural contrasts among the Illinois counties in this series. Belleville, O’Fallon, East St. Louis, Cahokia Heights, Fairview Heights, and Swansea cluster in the northwestern part of the county, while Freeburg, Mascoutah, and Marissa are separated by much larger open areas. The water and elevation views add another contrast between broad lowlands, central hills, and the Kaskaskia River corridor in the southeast.
The WebP maps embedded in the article are sized for quick browser viewing. The matching original JPG files in the download archive are better for enlarging small road, creek, and place labels or for printing. A practical way to begin is with Belleville and O’Fallon, then move west toward East St. Louis and Cahokia Heights, east toward Mascoutah, and south toward Freeburg and Marissa. After that, the water and elevation maps explain why the southern and eastern sections look much less urban than the northwest.
Table of Contents
Belleville, O’Fallon, and the dense northwestern city belt
Belleville is the easiest central landmark on the general county map. Swansea lies immediately north, Fairview Heights farther northwest, and O’Fallon northeast. East St. Louis and Fairmont City occupy the western side of the urbanized area, with Cahokia Heights and Dupo extending southward. Caseyville adds another reference near the northwestern edge. The result is a dense group of communities concentrated in a relatively small part of a much larger county.
The road network follows that concentration. The map labels 255, 50, 64, 177, 158, 159, 15, 13, and 4, with several routes passing through or near the Belleville–Fairview Heights–O’Fallon area. Major roads continue west toward East St. Louis and southeast toward Mascoutah. It is easier to use the map by connecting roads to named communities rather than memorizing every number at once: Belleville serves as the center, O’Fallon and Shiloh organize the northeast, and Mascoutah provides a strong eastern reference.
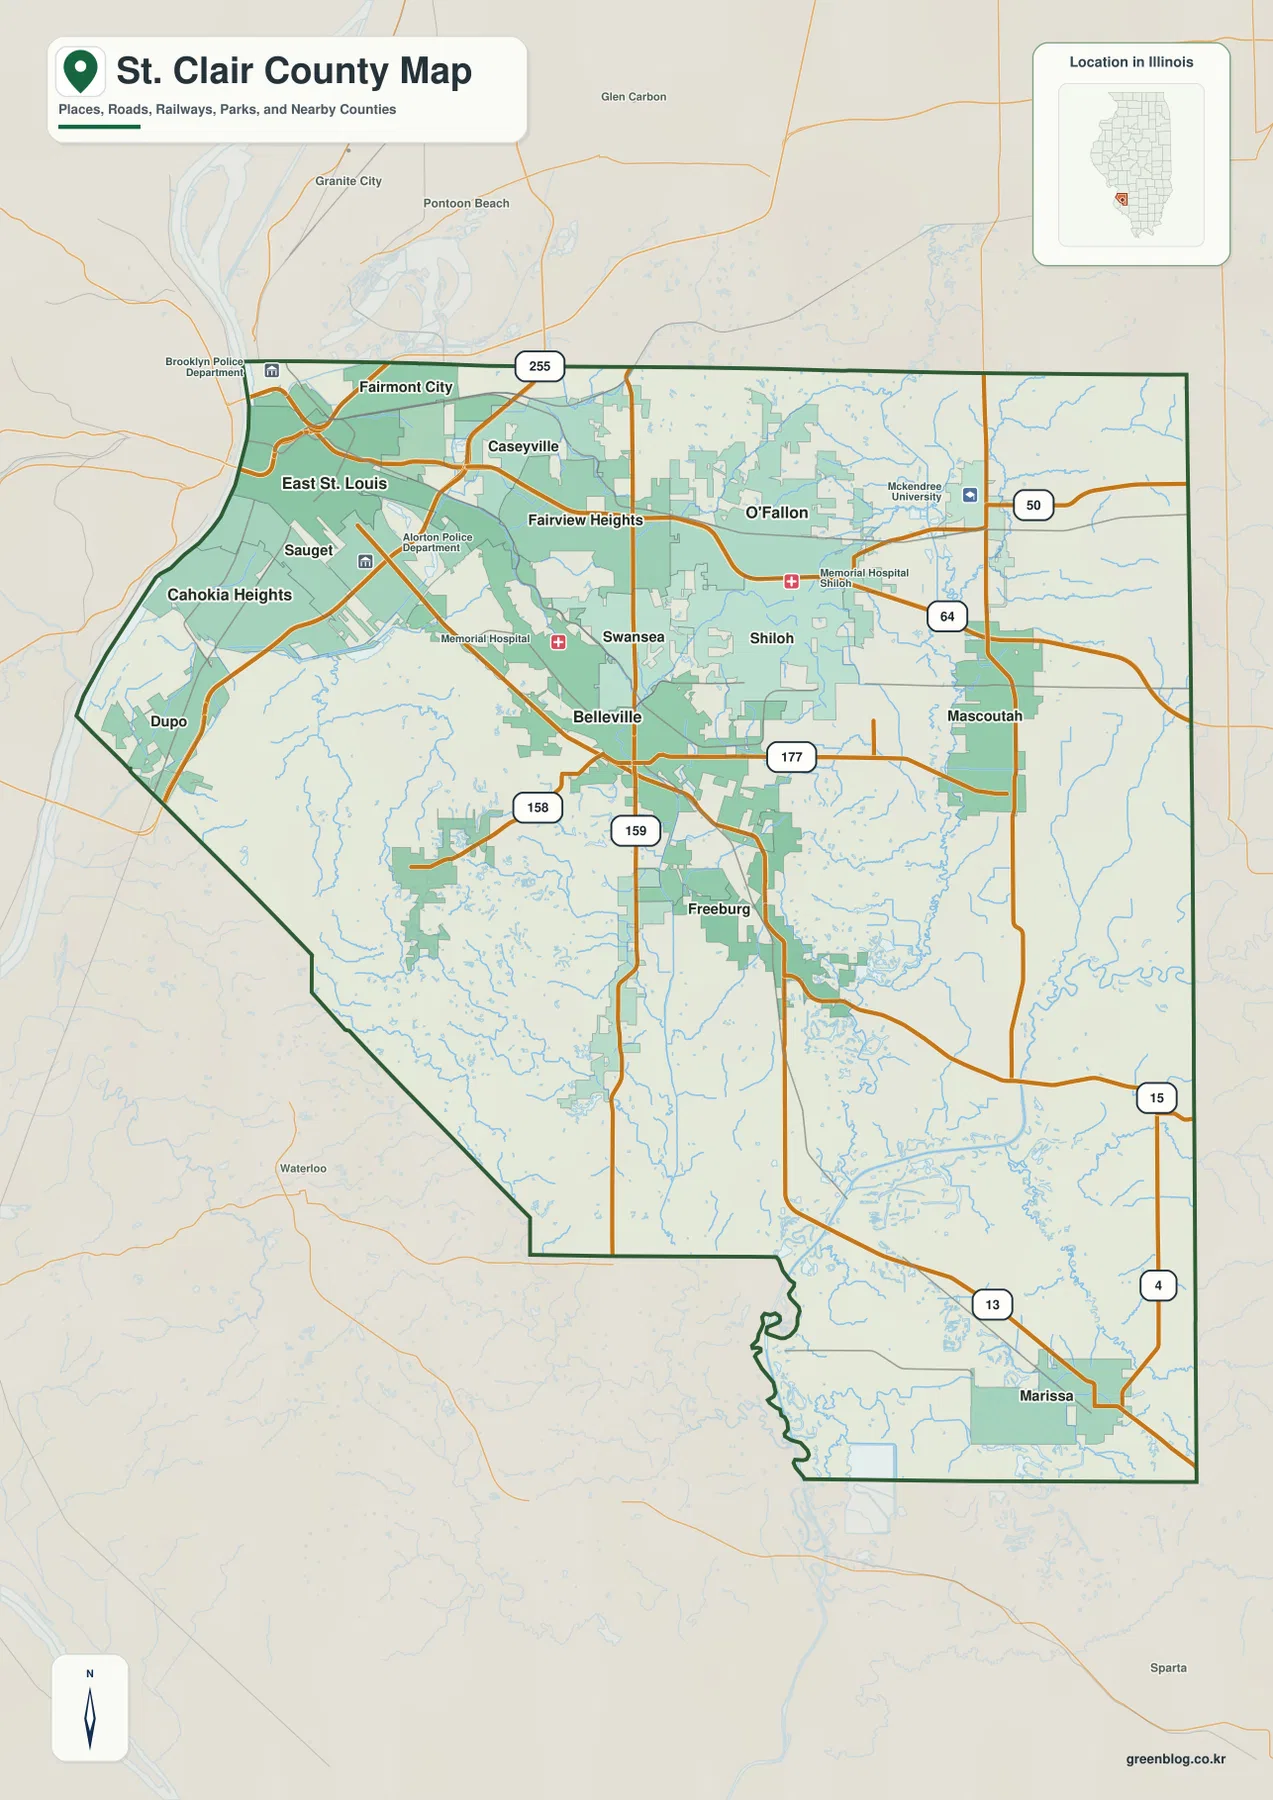
The southern half has a very different settlement pattern. Freeburg is an important reference south of Belleville, but there is no continuous built-up strip connecting it to the larger northwestern cities. Marissa lies much farther south near the southeastern part of the county, and wide areas between communities contain more small roads and waterways than large urban labels. Dupo is closer to the western city belt but still sits at the edge of a much more open interior.
Mascoutah is another useful example of the county’s changing density. It lies southeast of O’Fallon and Shiloh, separated from the largest northwestern cluster. Moving beyond Mascoutah toward the southern and eastern boundaries, the map contains fewer large built-up areas and more open land. The general county map is therefore useful not only for locating towns and roads but also for seeing where the dense metropolitan pattern begins to break apart.
The six-city index shows how concentrated the largest centers are
The city-index map removes most smaller road and place labels and highlights six communities. The supplied ranking places Belleville first with 41,370, O’Fallon second with 32,262, East St. Louis third with 17,999, Cahokia Heights fourth with 17,106, Fairview Heights fifth with 16,745, and Swansea sixth with 14,710. These figures are treated only as values printed on the supplied city index and are not presented here as newly verified current population counts.
The locations are more revealing than the ranking by itself. Belleville sits near the middle of the six-city cluster. Swansea is immediately north, Fairview Heights northwest, and O’Fallon northeast. East St. Louis and Cahokia Heights are farther west. All six lie in the northwestern section of the county, leaving a large southern area without a city from this index. That concentration is one of the most distinctive geographic patterns on the page.
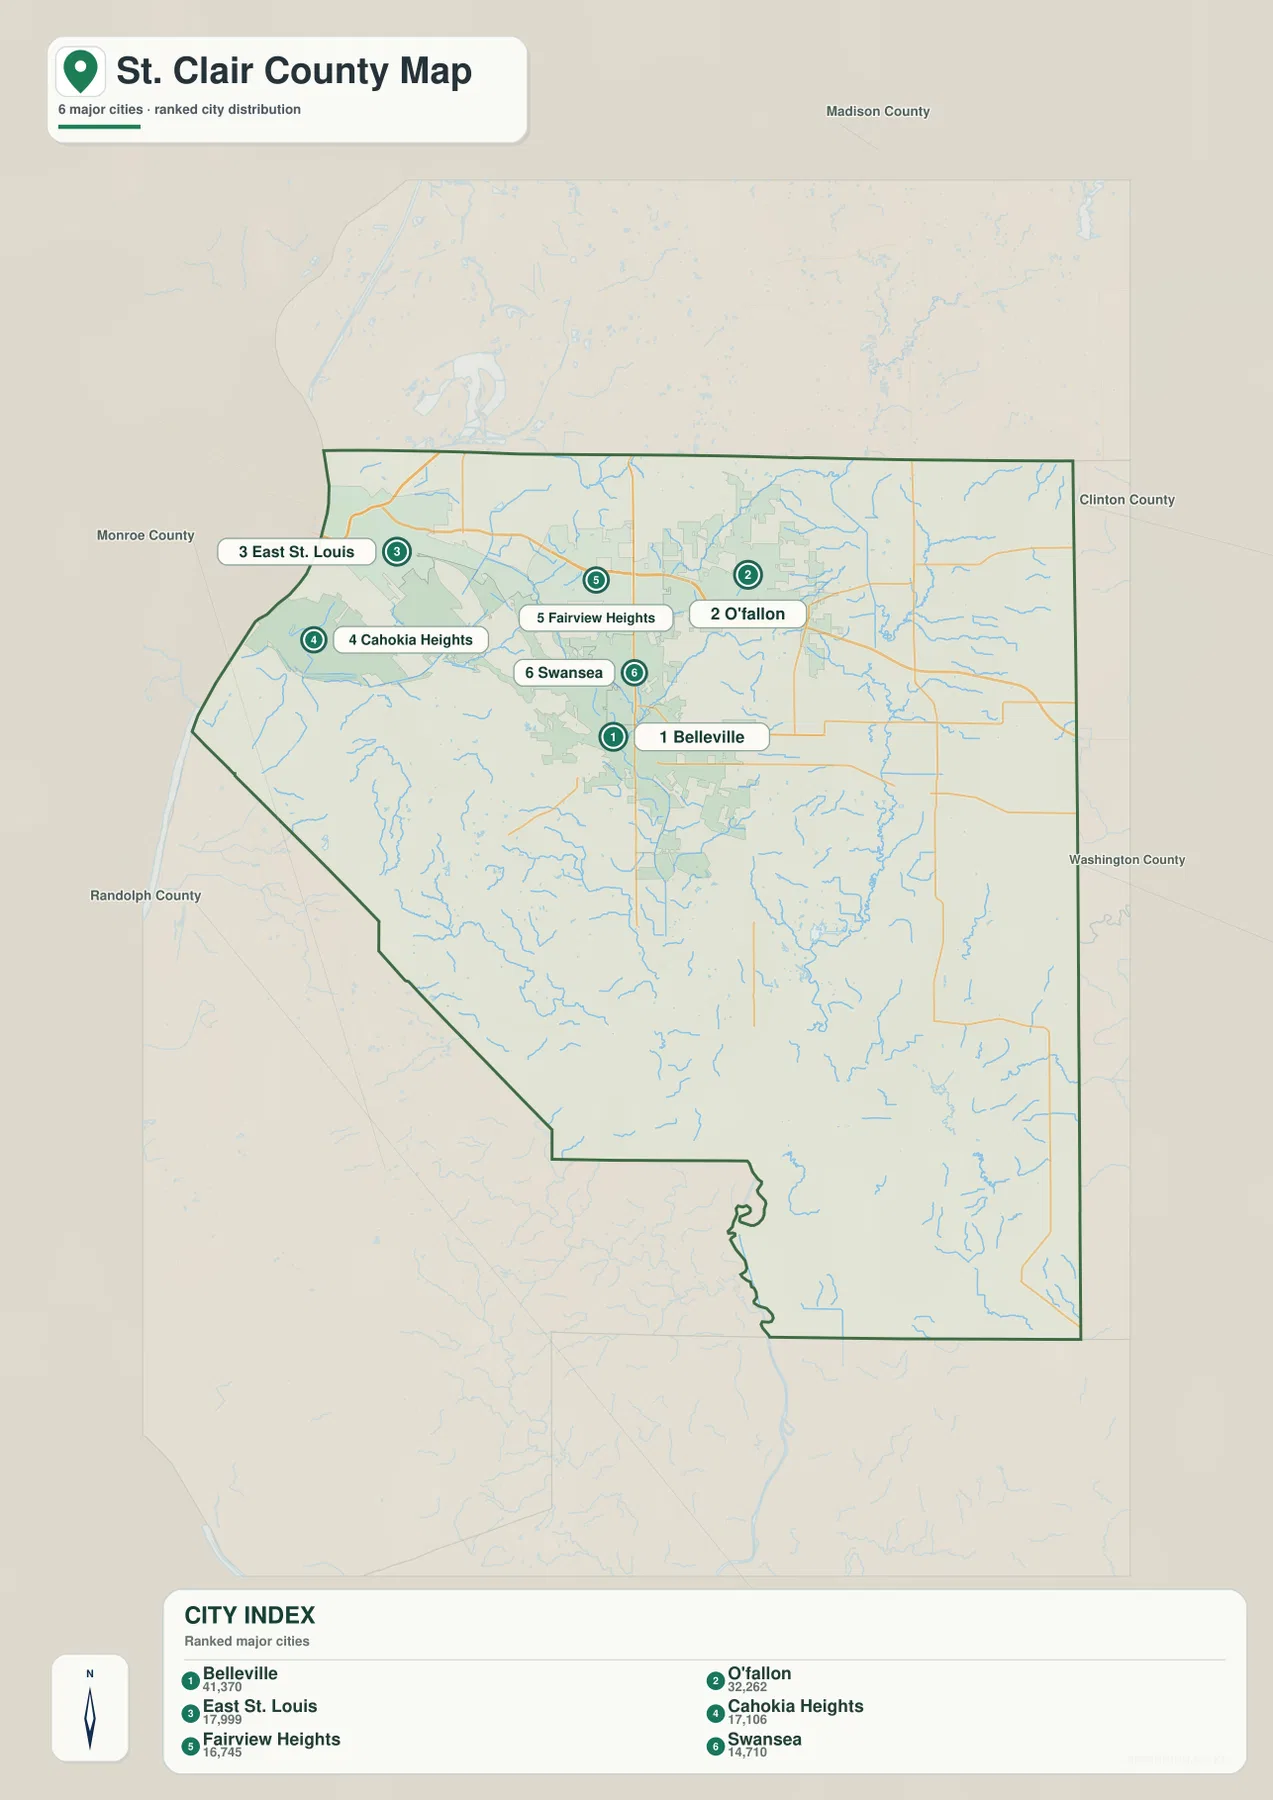
Important places such as Mascoutah and Freeburg do not appear in this simplified ranking, which is why the city index should not replace the full county map. Its purpose is narrower: it shows where the six highlighted major cities sit relative to one another. The full map remains better for finding smaller communities and route numbers, while the index quickly communicates the strong northwestern concentration.
Kaskaskia River, Silver Creek, and Richland Creek organize the water map
The terrain-and-water map is easiest to read by starting with the Kaskaskia River in the southeastern part of the county. The river occupies a broad low corridor near the southern boundary, while Silver Creek runs northward through the eastern interior. Hog River is labeled east of Silver Creek and Mud Creek farther south. These larger named waterways provide a framework for the many smaller tributaries that cover the eastern and southern sections.
Richland Creek is the strongest central stream label. Christine Lake and Stalberg Lake sit near its upper and middle sections, and West Fork Richland Creek extends toward the southwest. Sportsman Lake lies nearby in the southwestern interior. Spring Lake is farther northwest, Mascoutah Lake in the east-central county, and Dyer Pond farther southeast. The standing-water features are therefore distributed across several drainage areas rather than concentrated around one large lake.
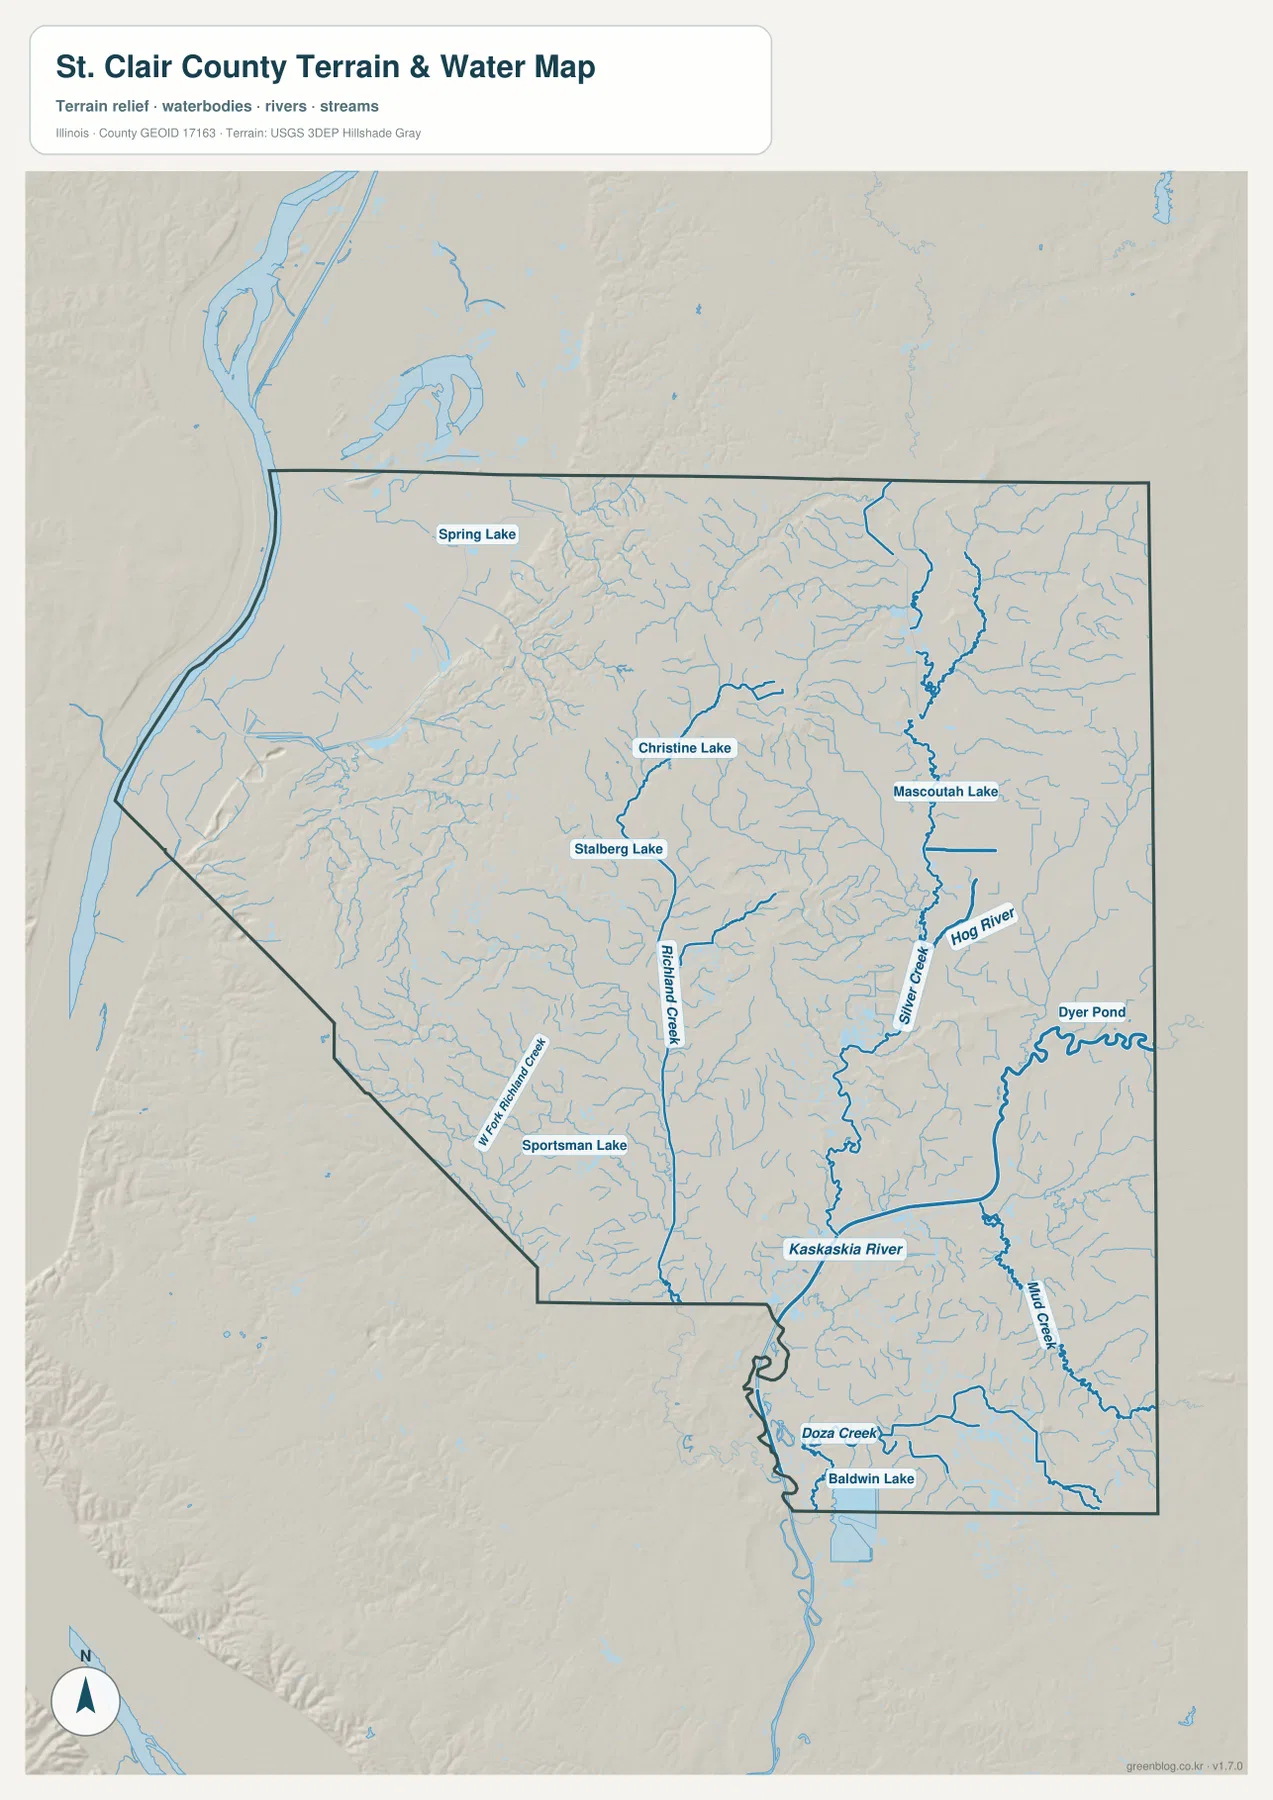
At the far southern end, Doza Creek runs close to the county boundary and Baldwin Lake forms one of the most prominent water bodies in that area. The Kaskaskia River and Mud Creek also occupy this southeastern lowland. This is a very different landscape from the northwestern city belt, where roads and built-up areas dominate the general map. The water layer helps explain why the southern and eastern parts of the county appear more open and dissected by drainage channels.
This layer is intended for general geographic reference rather than flood-hazard, water-quality, navigation, parcel, or legal-boundary decisions. A stream or lake label shows relative location, not public access, navigability, or a current regulatory condition. Current flood, water-use, or legal questions require the appropriate official source.
From 42 to 219 meters, lowlands rise quickly into central hills
The supplied elevation map reports an actual range of about 42 to 219 meters and a mean near 144 meters. The broadest dark-green lowland follows the western edge of the county, and another extensive low area appears around the Kaskaskia River in the southeast. Between those lowlands, tan and brown terrain covers much of the central and west-central interior. The nearly 180-meter range creates a much stronger local relief contrast than the road map alone suggests.
The higher central ground is not a single smooth plateau. Richland Creek, West Fork Richland Creek, Silver Creek, and many smaller tributaries carve lower green corridors through the warmer-colored hills. This creates a branching pattern of valleys between ridges. Comparing the water and elevation maps side by side makes the relationship clear: many named creeks occupy the same lower strips that appear in green on the terrain surface.
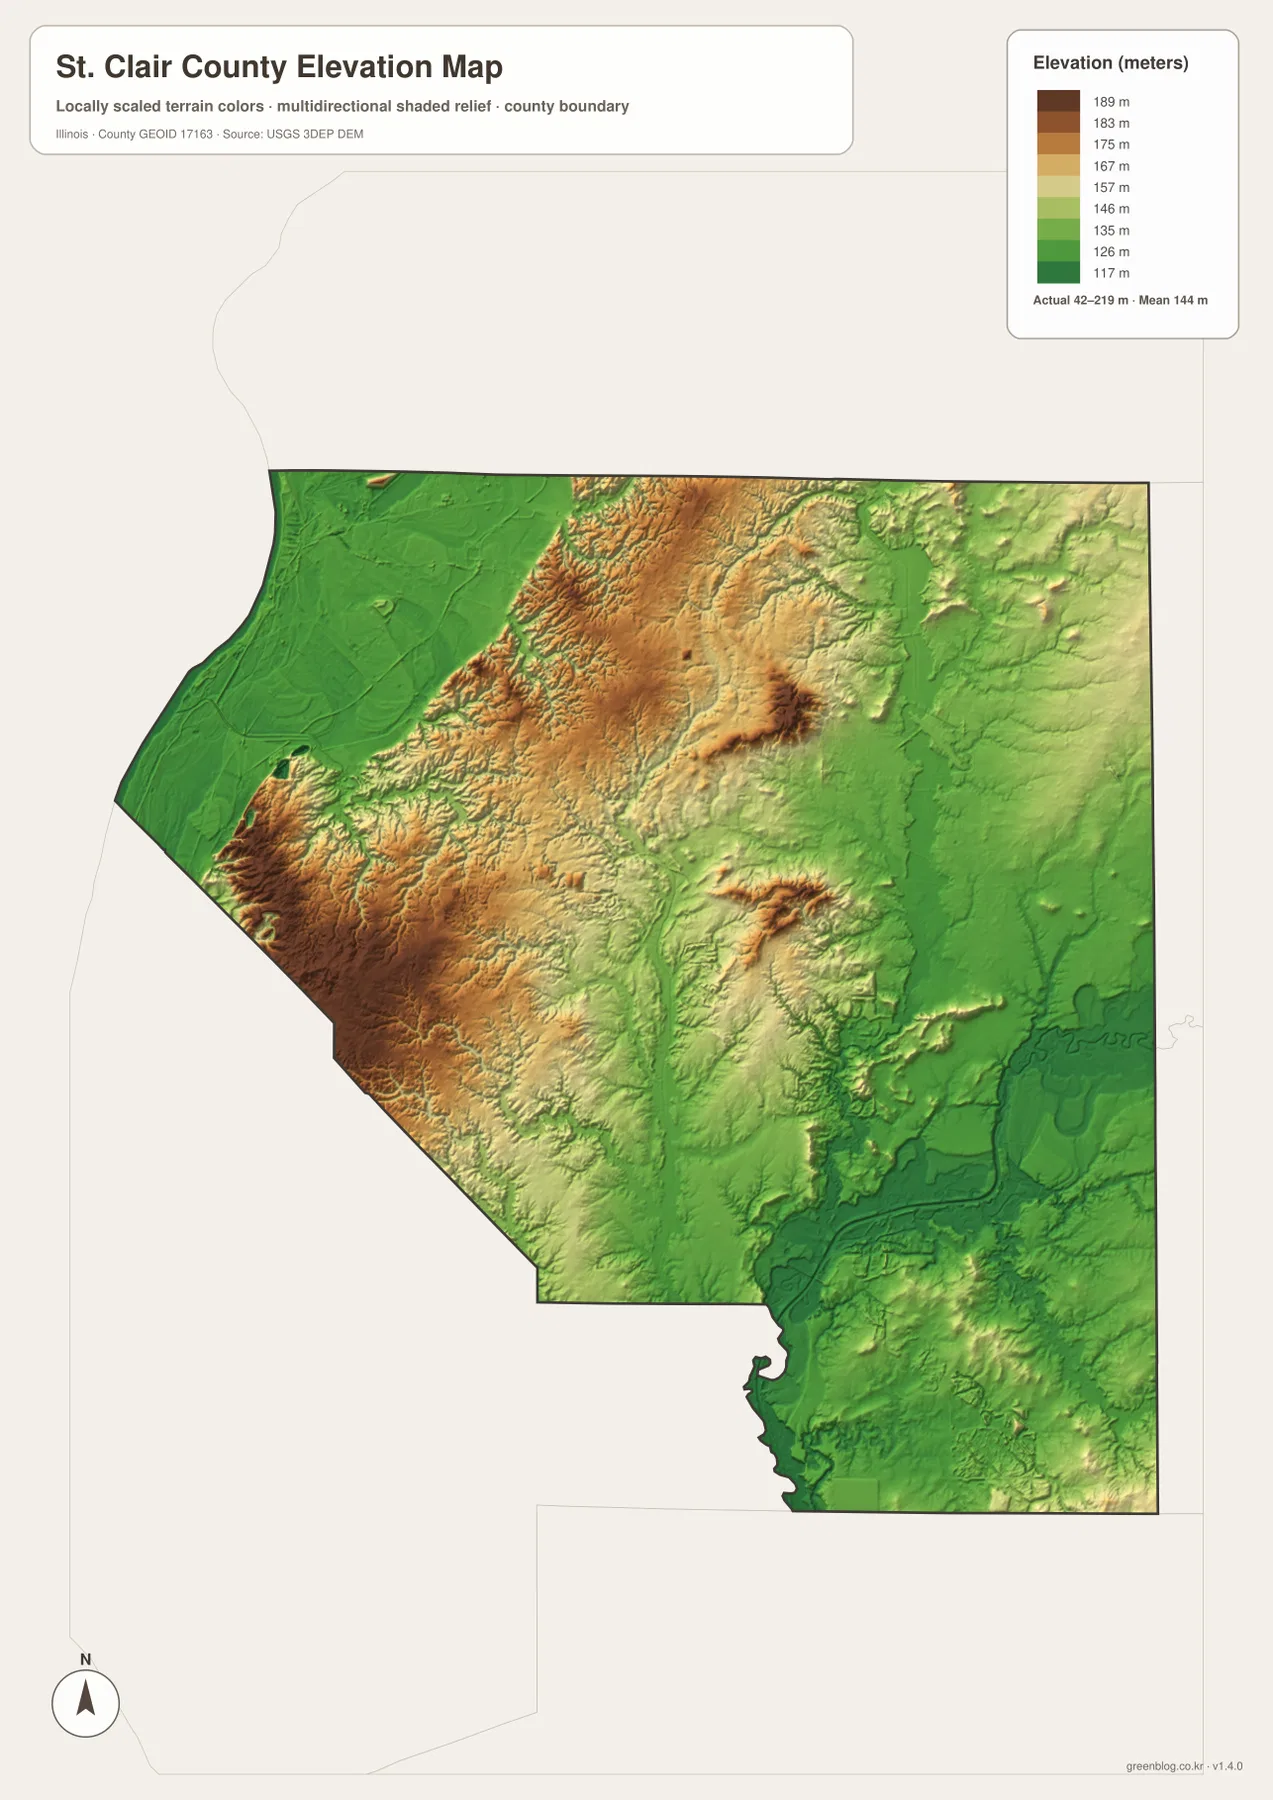
Relating the terrain back to the settlements makes the pattern easier to use. East St. Louis, Cahokia Heights, and Dupo sit close to the very low western edge. Moving inland toward Belleville brings more rolling terrain and steeper local differences. O’Fallon, Shiloh, and Mascoutah lie across the eastern half where low stream valleys and gentle uplands alternate. Around Marissa and the southeastern corner, the Kaskaskia system again creates a broad lower landscape.
The elevation layer is meant for county-scale comparison, not parcel surveying or engineering design. The 42–219 m range is useful for identifying broad lowlands, tributary valleys, and higher central terrain, but it does not provide a survey-grade elevation for a specific property. Construction, drainage, flood, and legal decisions require more precise and current data.
Use the map view that matches your question
For communities and roads, begin with Belleville and then trace Swansea and Fairview Heights to the north, O’Fallon to the northeast, and East St. Louis and Cahokia Heights to the west. Use the city index when the main question is simply where the six highlighted major cities are concentrated. For waterways, start with the Kaskaskia River and Silver Creek, then add Richland Creek, Hog River, and Mud Creek. The elevation map is most useful after those waterways are familiar because it shows the low valleys and higher central terrain around them.
The ZIP below contains four high-resolution JPG files matching the county-and-road, city-index, terrain-and-water, and elevation views on this page. Each image is 2572 × 3638 pixels in portrait orientation, making small place, road, and stream labels easier to enlarge or print than in the browser-sized WebP versions. These are general reference maps, so current traffic, legal parcel boundaries, flood determinations, water rules, and survey-grade elevations should be checked against the appropriate official source.
Frequently Asked Questions
Where are the largest highlighted cities concentrated in St. Clair County?
The six cities in the supplied index are concentrated in the northwest. Belleville is near the center of that group, with Swansea and Fairview Heights to the north, O’Fallon to the northeast, and East St. Louis and Cahokia Heights to the west. The southern half of the county is much less densely settled on the general map.
Which map is best for Kaskaskia River and the major creeks?
The terrain-and-water map is the clearest choice. It shows Kaskaskia River, Silver Creek, Richland Creek, Hog River, Mud Creek, Spring Lake, Mascoutah Lake, and Baldwin Lake in one county view. It is intended for general geography rather than flood, navigation, or legal-water-boundary decisions.
What elevation range is shown for St. Clair County?
The supplied elevation layer reports an actual range of about 42 to 219 meters and a mean near 144 meters. The western edge and southeastern river corridor are among the lowest areas, while broad central sections rise into higher hills and ridges.
Map File Information
The ZIP contains high-resolution A3 JPG versions of the St. Clair County road-and-boundary map, major-city index, terrain-and-water map, and elevation map.
- Printable Size: 2572 × 3638 pixels each
- File Type: ZIP containing 4 JPG files
Related Maps
Sources and references
- Official St. Clair County overview – county background and local information
- St. Clair County Parks Department – county parks and natural-area references
- U.S. Census Bureau TIGER/Line Shapefiles – county boundaries, roads, and place references
- USGS National Hydrography – rivers, streams, and lakes
- USGS 3D Elevation Program – elevation and terrain reference
Green Map creates custom-edited map images using open geographic data sources such as geoBoundaries, Natural Earth, OpenStreetMap, and government open data.
These maps are edited visual materials, not raw data files, and are provided for education, documents, presentations, and graphic reference.