You can download the Grundy County Illinois map files directly from this page. One ZIP contains the original high-resolution JPG versions of the county, city, water, and elevation maps, while the WebP images in the article provide quick browser previews. Start around Morris and I-80, then compare Minooka, Coal City, Diamond, Mazon, Gardner, the northeastern river junction, and the county-wide relief before opening the full-size files for printing or close inspection.
The supplied map set is especially useful because the same county looks very different depending on the question. The general map keeps Morris, Minooka, Coal City, Diamond, Mazon, Gardner, major roads, and nearby communities in one frame. The ranked city view strips the county down to six numbered places. The water view brings the Illinois, Des Plaines, Kankakee, Mazon, and smaller streams to the foreground, while the elevation surface makes the low northeastern river country stand out against higher ground to the west and southwest.
Rather than treating those views as four copies of the same geography, this guide follows several specific features across them: the Morris–I-80 area, the city cluster toward the northeast and east, the river junctions and Mazon drainage, and the 114–215 meter elevation range printed on the supplied relief map. That approach makes it easier to choose the file that matches a practical need without crowding every road, stream, and terrain detail into a single image.
Table of Contents
Start at Morris: roads, county landmarks, and the northern cluster
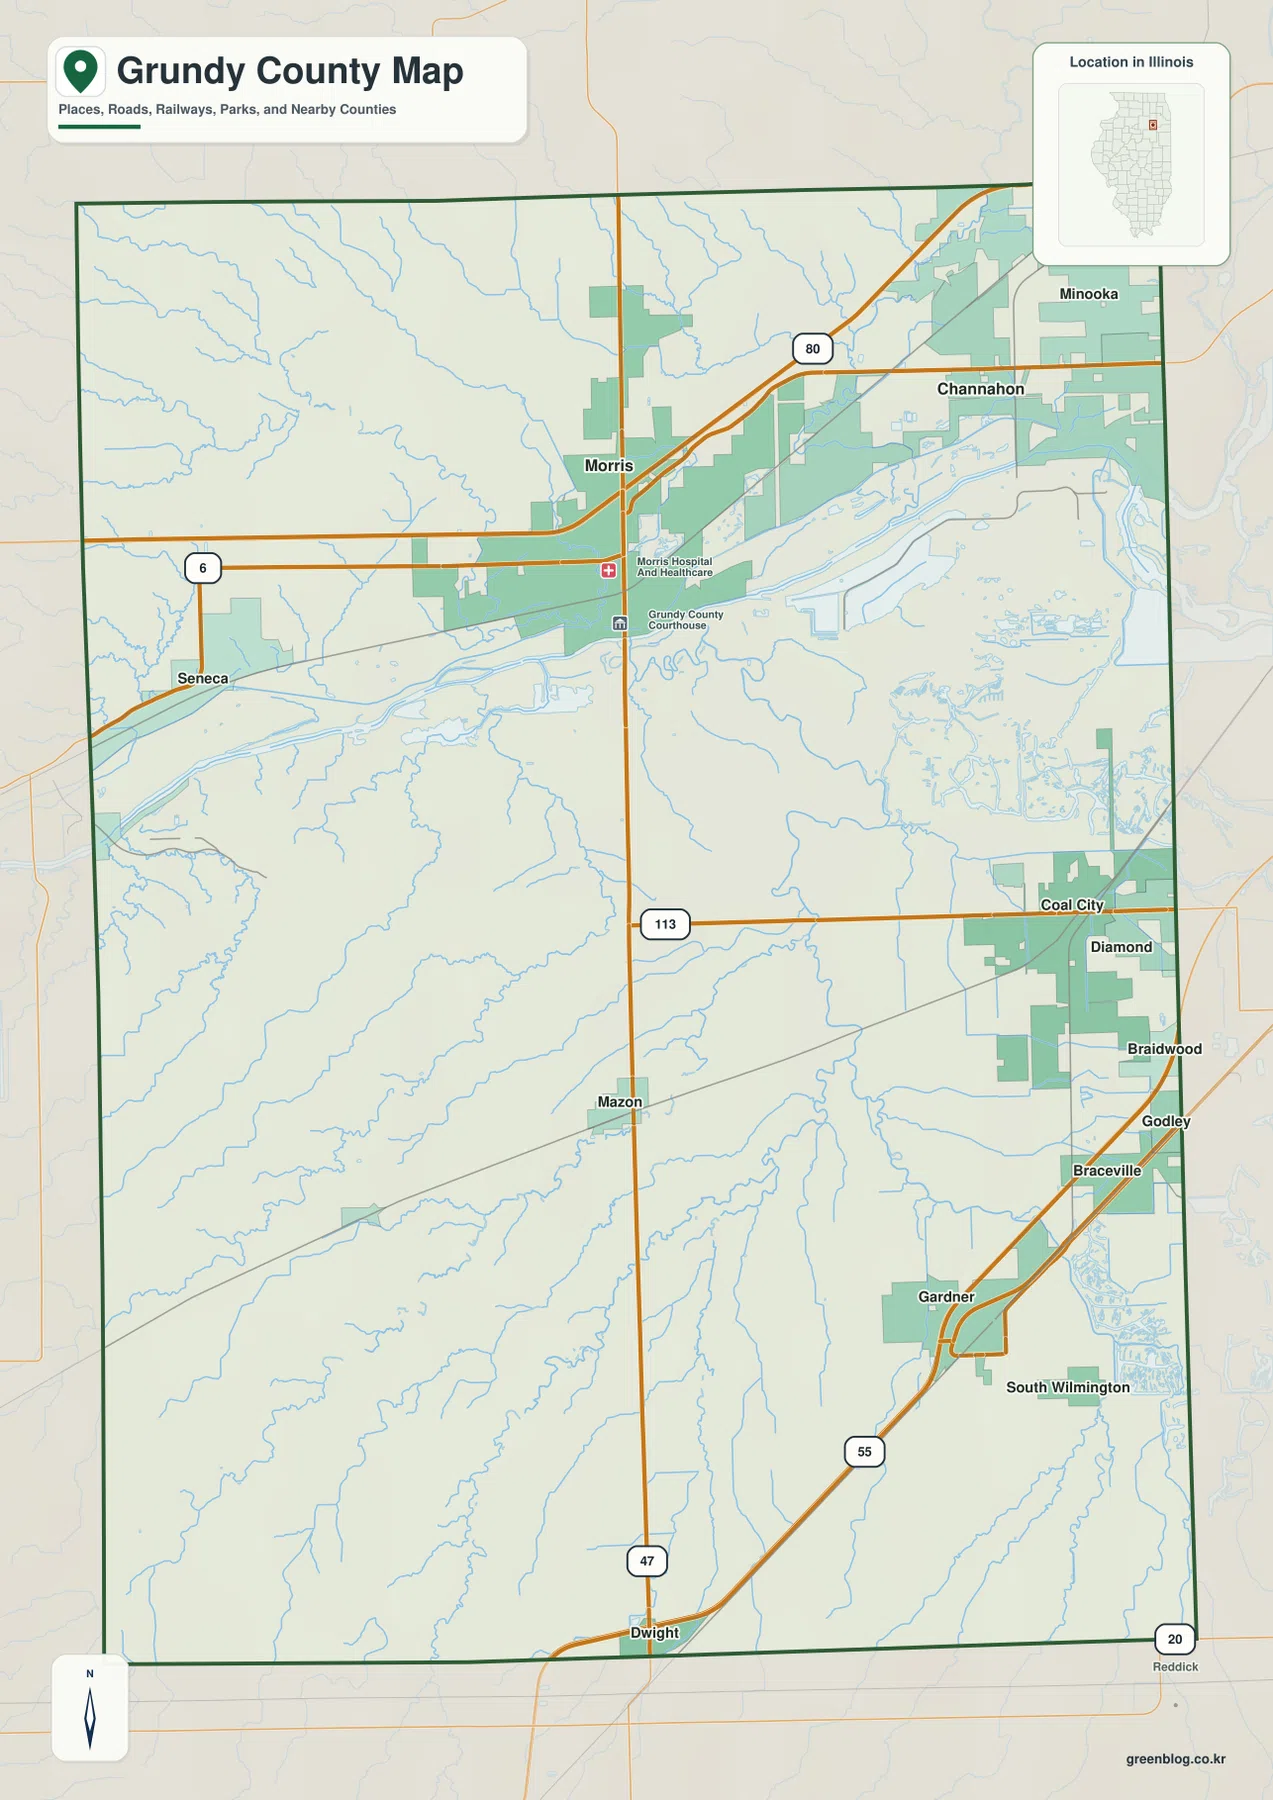
Morris sits near the north-central part of the county and is the clearest orientation point on the general map. The Grundy County Courthouse and Morris Hospital are labeled close to the city, while I-80 runs just to the north. Route 47 crosses the county from north to south through the Morris area, and Route 6 approaches from the west near Seneca. Route 113 becomes a useful east-west reference farther south, linking the central part of the map with the Coal City and Diamond side of the county.
The northeastern portion contains the densest combination of place names and major roads. Minooka and Channahon appear near I-80, and the map shows development extending along that corridor. Coal City and Diamond sit close together near the eastern boundary, with Braidwood, Godley, and Braceville appearing farther down the same side. Finding I-80 first and then following the eastern edge makes this cluster much easier to read than trying to start with every town label at once.
The southern half feels more open. Mazon is separated from the northern cluster and sits near the middle of the county’s lower half. Gardner appears farther southeast near I-55, while Dwight is shown just beyond the southern boundary and helps orient Route 47 and the interstate. South Wilmington is also marked near the southeastern side. The spacing between these places contrasts with the tighter concentration around Morris, Minooka, Coal City, and Diamond.
This map is best used as a county-level location reference rather than a legal boundary or turn-by-turn navigation product. It shows how the major communities relate to the county outline, the road network, and visible waterways. When a road number or small label is difficult to read in the browser preview, the downloadable JPG provides enough resolution to enlarge that part of the map without relying on a screen capture.
Six ranked city markers reveal an uneven settlement pattern
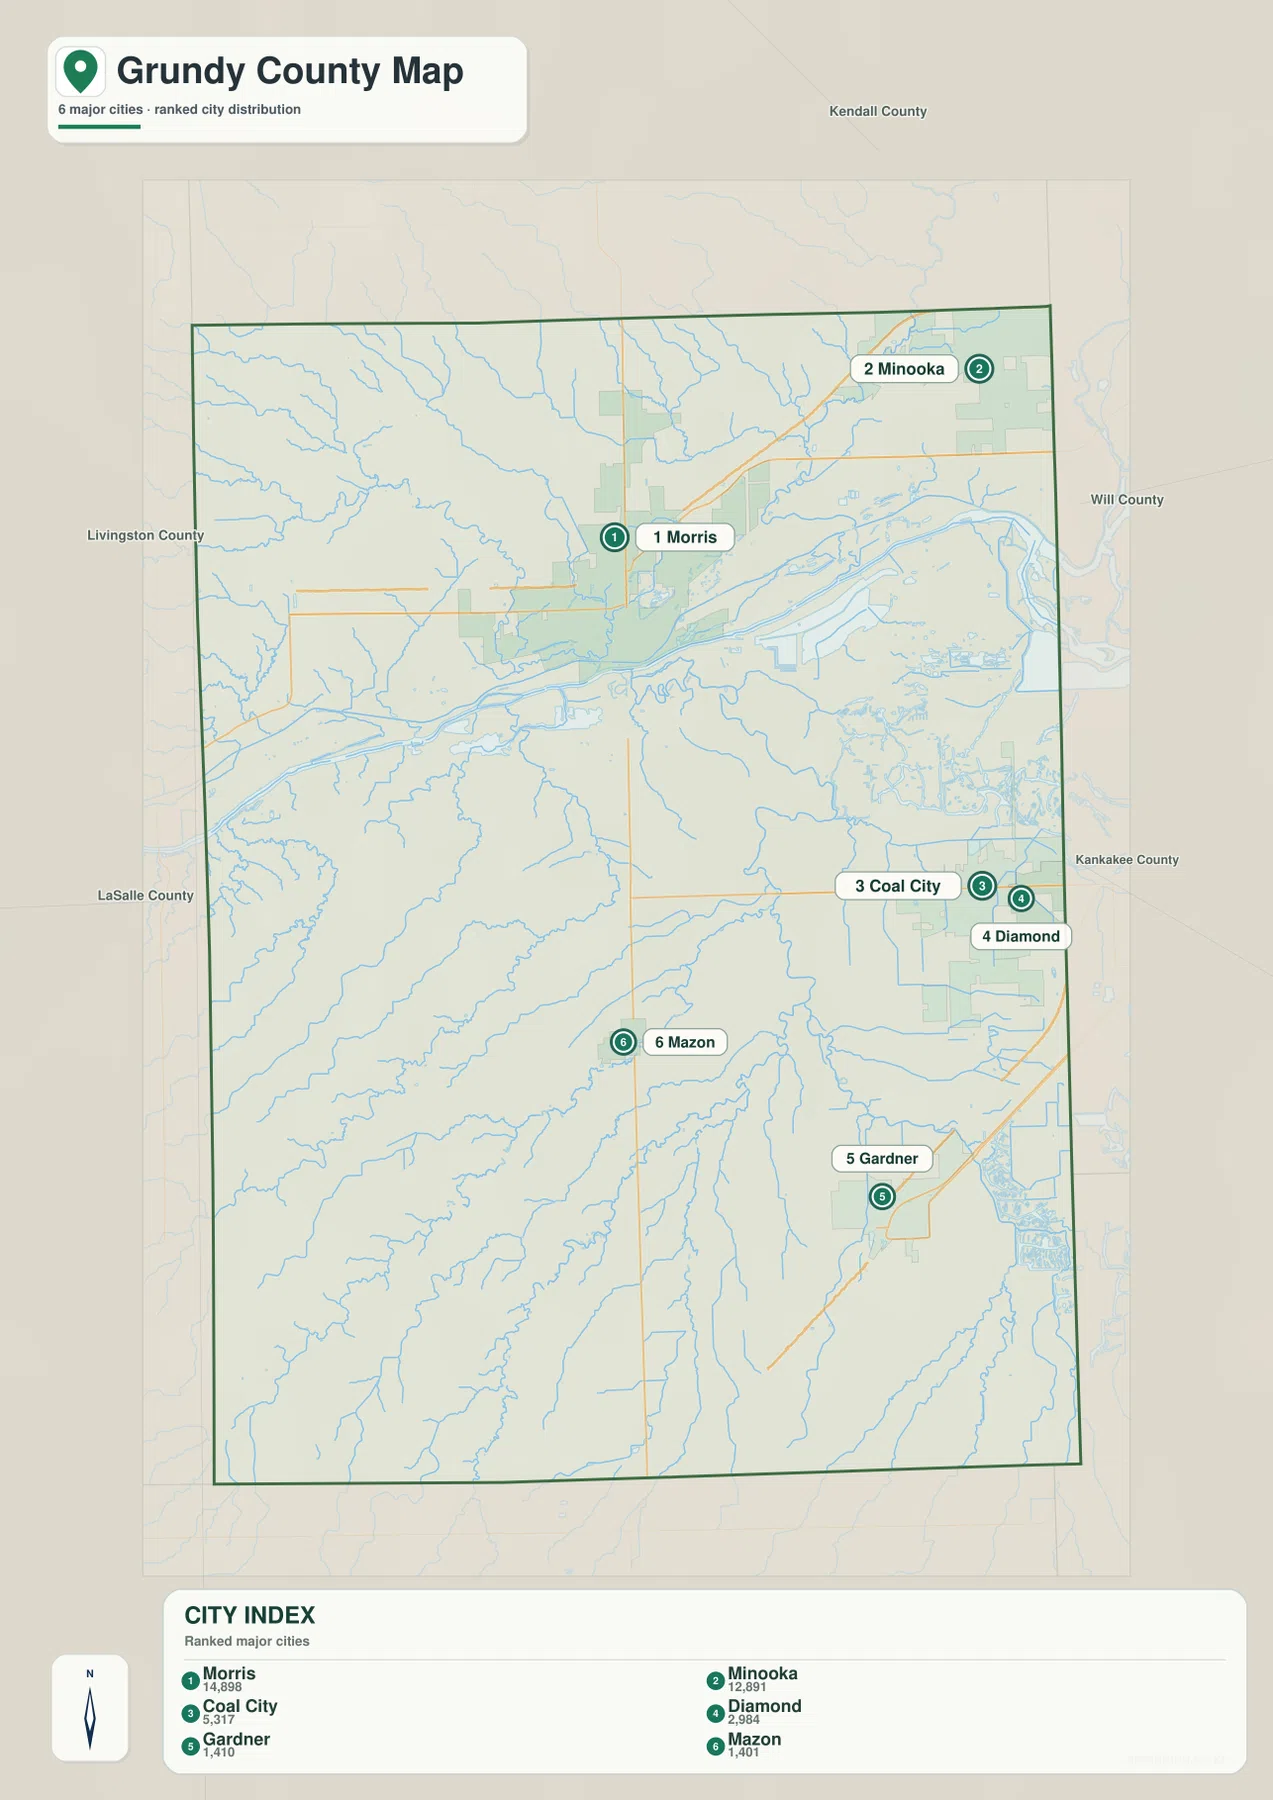
The city map removes most of the secondary place labels and concentrates on six numbered locations. In the supplied CITY INDEX, Morris is ranked first at 14,898 and Minooka second at 12,891. Coal City follows at 5,317, Diamond at 2,984, Gardner at 1,410, and Mazon at 1,401. These are the values printed on the supplied map and are used here only to describe its ranking; they should not be treated as a live population feed or assumed to match the newest official estimate.
The geography of those six markers matters more than the ranking itself. Morris and Minooka occupy the northern part of the county, with Minooka pushed toward the northeastern edge. Coal City and Diamond form a close pair on the east side. Gardner stands farther south and east, while Mazon gives the lower central county a separate reference point. The result is not a simple line of towns from north to south but a pattern that is strongest in the north and east, with wider spacing farther south.
Neighboring county labels add another layer of orientation. Kendall County appears above the map, Will County to the east, Kankakee County farther southeast, and Livingston and LaSalle counties along the western side. Those labels make it clear why Minooka and the Coal City–Diamond area feel close to the county edge while Morris remains farther inside the outline. They are also helpful when the map is used in a regional comparison rather than as a stand-alone county image.
Comparing the ranked view with the general map connects the settlement pattern to the road network. Morris and Minooka align with the I-80 side of the county. Coal City and Diamond sit near the eastern road corridors, Gardner lies close to I-55, and Mazon remains a separate south-central point. The ranked map does not try to explain every road, but it gives a cleaner way to remember where the six principal markers sit before returning to the more detailed county view.
Three major river names frame the northeastern lowlands
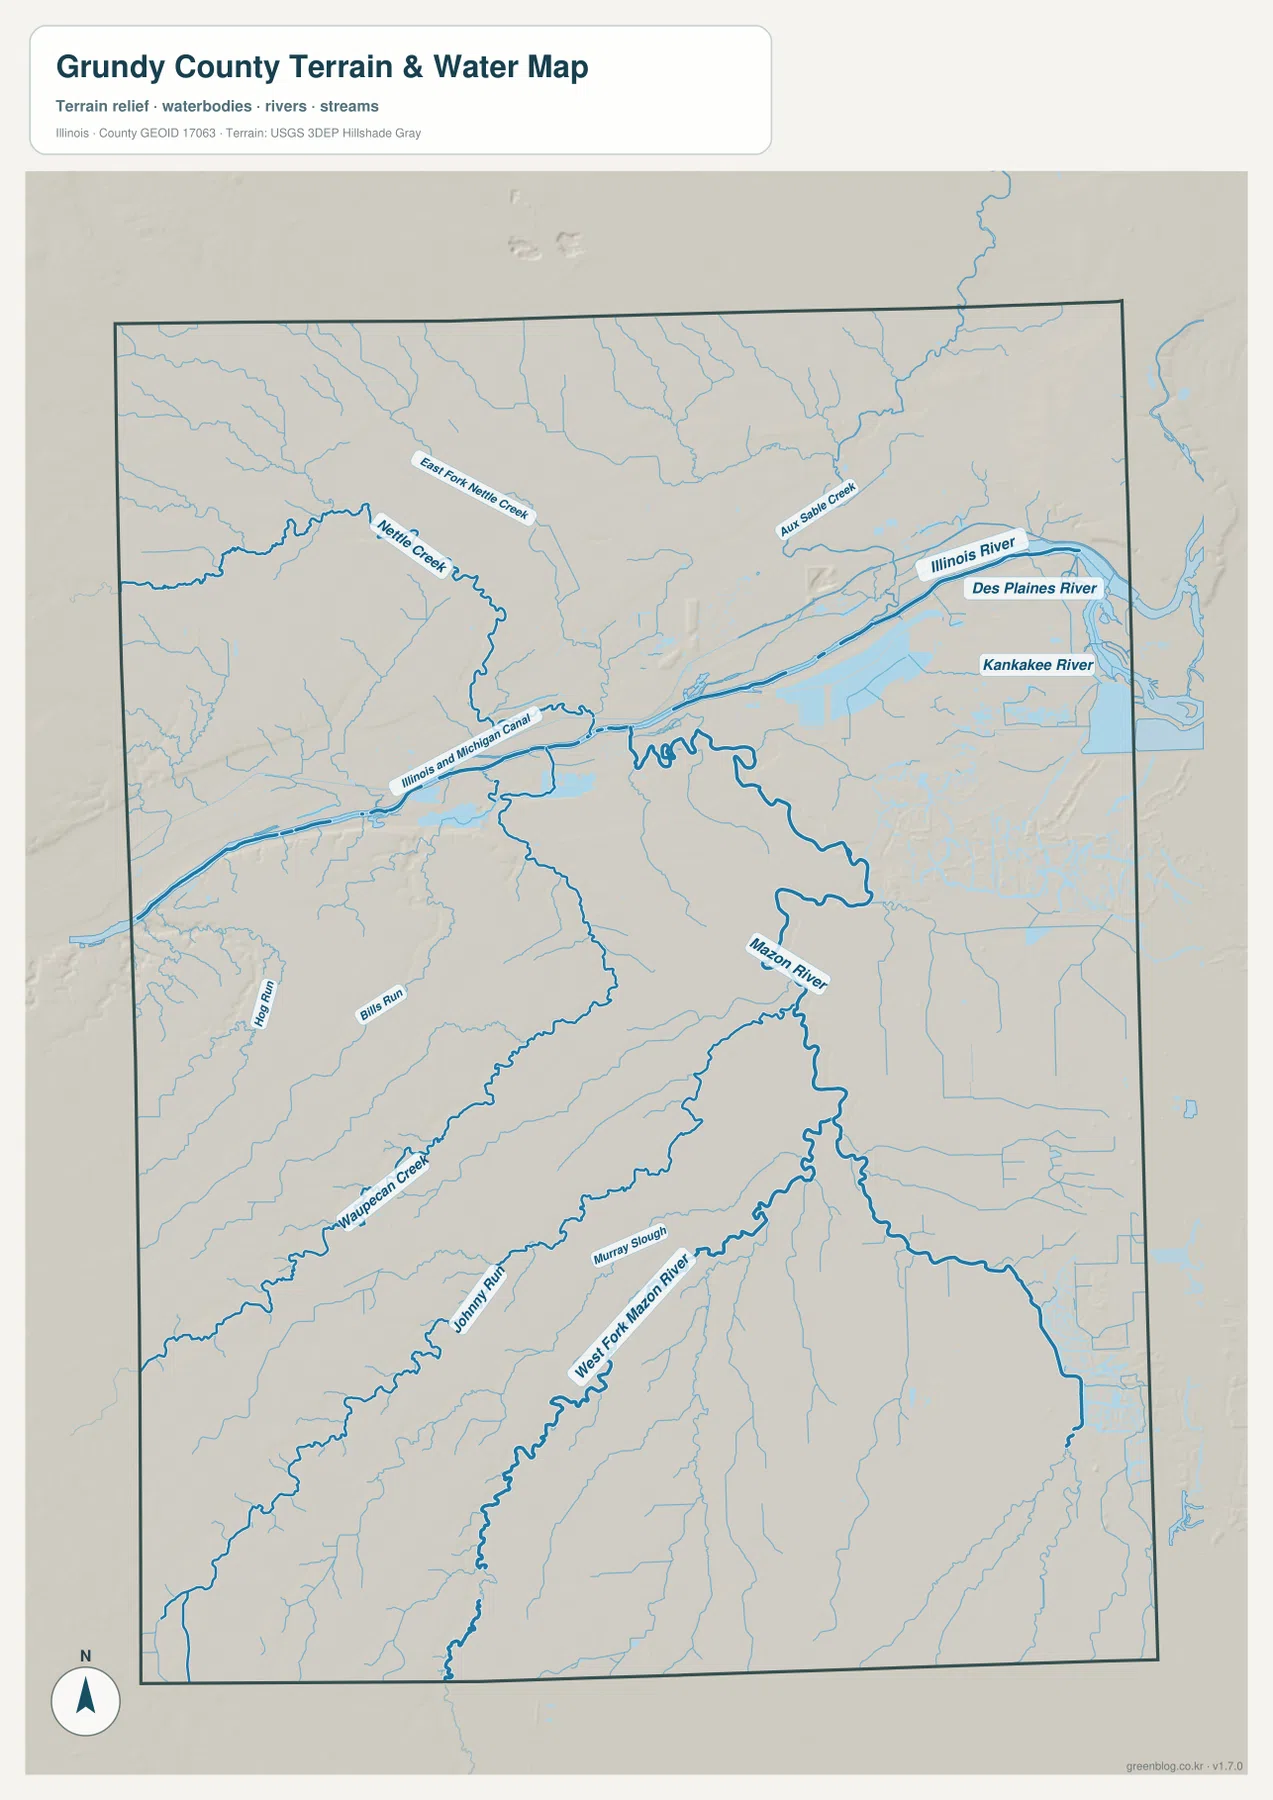
The water map changes the emphasis immediately. At the northeastern side, the Des Plaines River and Kankakee River are labeled close to their meeting area, and the Illinois River continues westward across the northern part of the county. Broad water features and low terrain make this corner visually different from the interior. The Illinois and Michigan Canal is also labeled along a similar east-west path, providing another strong reference when following the river corridor through the Morris area.
North and west of Morris, Nettle Creek and East Fork Nettle Creek form a prominent branching system. Aux Sable Creek is labeled nearer the northeastern side. These streams are much smaller than the three major rivers, but their names help explain why the detailed water layer contains far more blue lines than the general map. The water view is therefore useful when a reader needs to identify a named creek or compare a local tributary with the larger river system.
The southern half is anchored by the Mazon River. It winds through the lower central and eastern part of the county, while West Fork Mazon River and additional tributaries extend toward the southwest. Waupecan Creek, Johnny Run, and Murray Slough are among the other labels visible in that part of the supplied map. Instead of one broad river corridor, the south is characterized by a network of narrower channels and valleys that can be traced across a much wider area.
This layer should be treated as a geographic reference, not a flood, navigation, water-level, or parcel map. A river or creek line tells you where the feature is shown relative to the county and other mapped landmarks; it does not state flood probability, depth, current condition, access rights, or navigability. For those questions, current agency data is necessary. Within the purpose of this page, the value of the water map is the ability to connect named waterways with the terrain visible around them.
Relief rises away from the river corridors
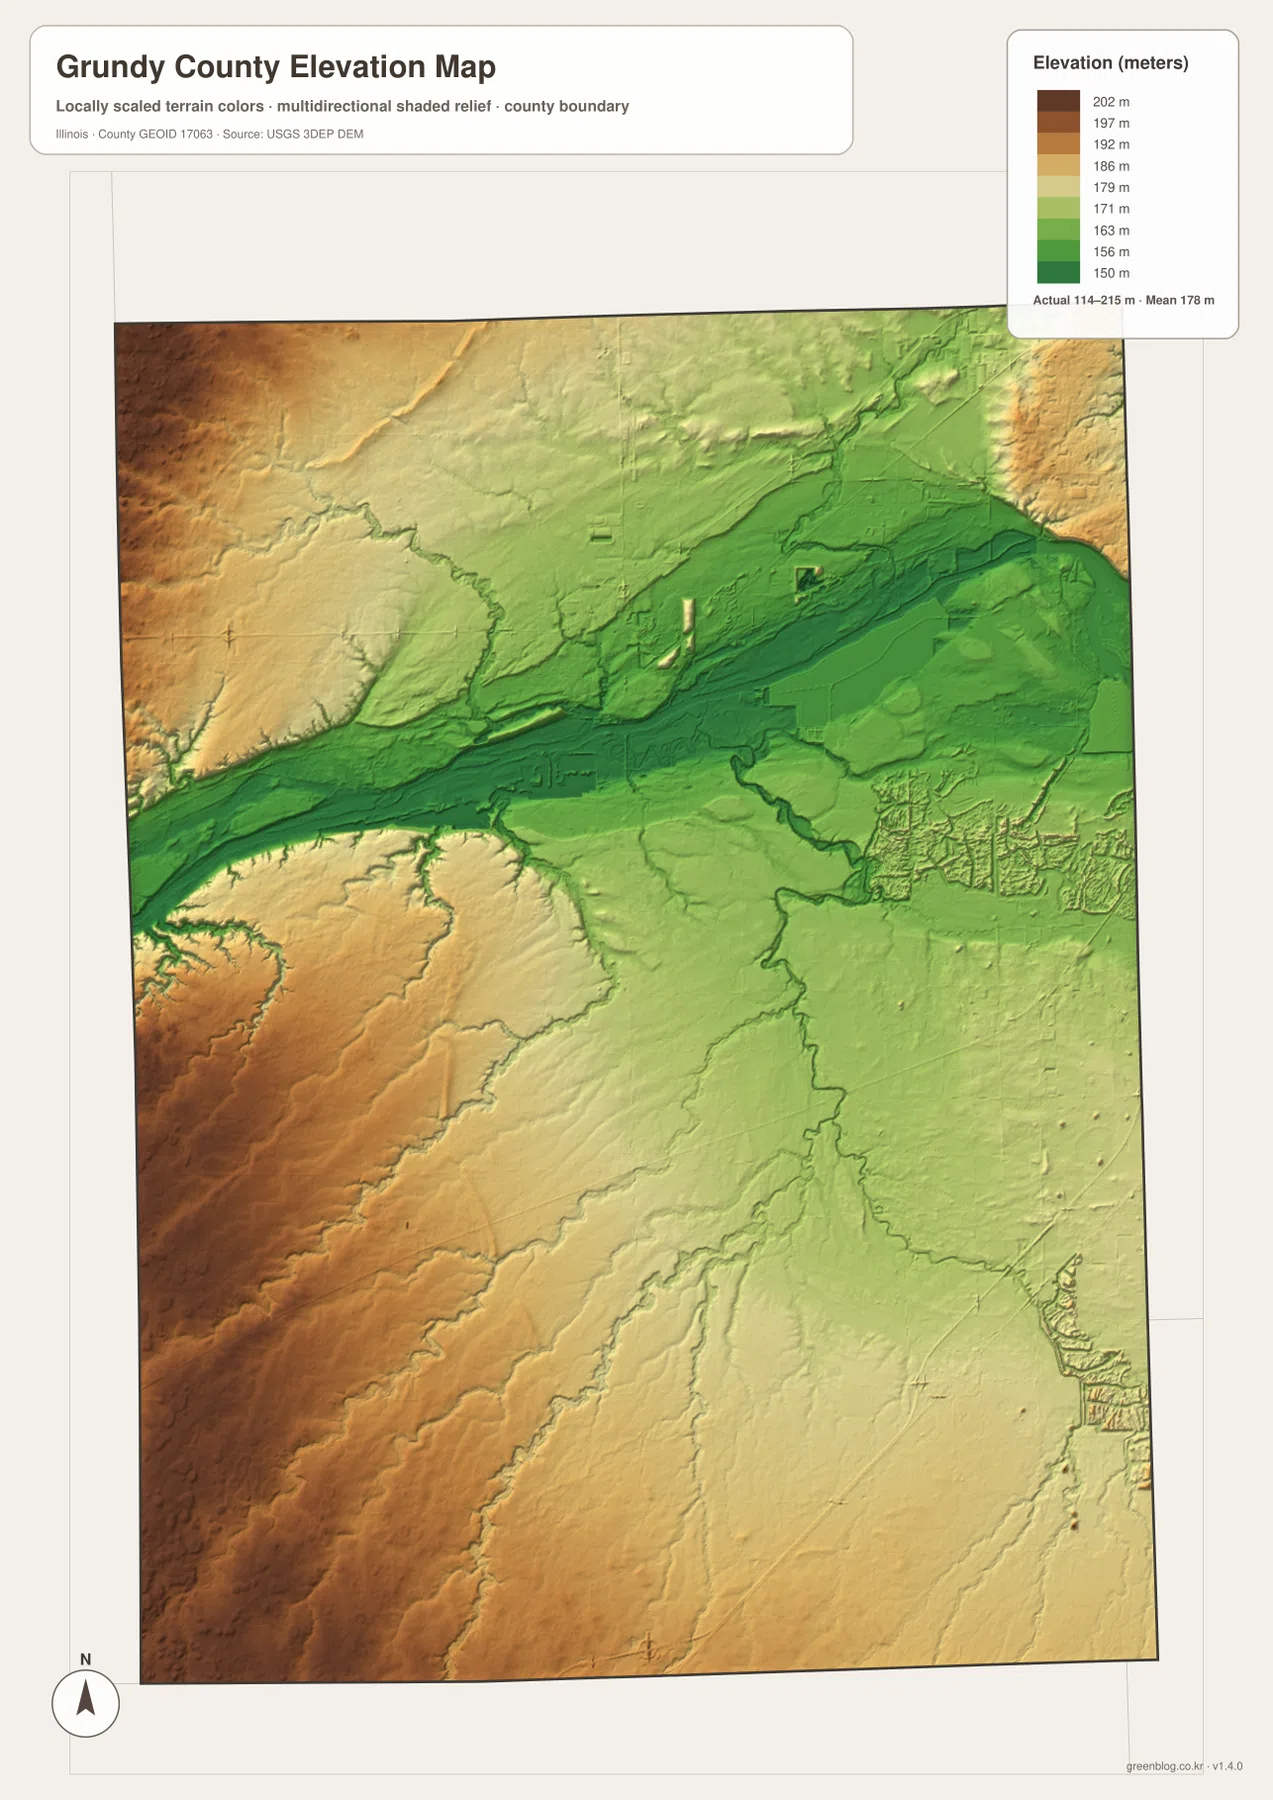
The elevation map reports an actual displayed range of 114 to 215 meters, with a mean of 178 meters. Green shades mark lower ground and yellow-to-brown colors mark higher terrain. The broadest low area appears in the northeast, matching the part of the water map where the Des Plaines, Kankakee, and Illinois river system dominates. That visual match is one of the clearest reasons to compare the water and elevation files side by side.
Higher colors occupy much of the western and southwestern side, with another higher zone toward the northwest. Narrower lower lines cut into those areas along stream valleys. The county therefore does not read as one flat surface even though large portions appear gently rolling. The contrast is strongest between the northeastern river lowlands and the higher ground away from the large channels.
The Mazon River corridor can also be followed on the relief surface. It does not create a lowland as broad as the major rivers in the northeast, but the drainage and its tributaries trace lower lines through the southern half. Moving between the water map and elevation map makes those relationships easier to see because one file supplies the names while the other emphasizes relative height.
The numbers on this map are appropriate for county-scale comparison, not site engineering. A displayed 114–215 meter range does not guarantee the precise elevation of a property, road grade, building pad, or surveyed point. Anyone who needs engineering or legal accuracy should use original elevation datasets and professional field measurements. Here, the relief image is best used to explain broad differences between river bottoms, creek valleys, and higher surrounding terrain.
Cross-reading the maps from Morris to Mazon
Morris is the simplest place to use as a cross-map anchor. On the general map it is tied to I-80, Route 47, Route 6, the courthouse, and other nearby labels. On the ranked city map it becomes marker number one. On the water map, the Illinois River and Illinois and Michigan Canal provide the strongest nearby water references, while the relief surface places the area within the lower northern terrain rather than the higher western ground. One city therefore links all four views without requiring every layer to be drawn on one crowded image.
Coal City and Diamond offer a different comparison. They appear close together on the eastern side and occupy adjacent ranks on the city map. The general map shows a denser road and settlement pattern around them than across much of the southern interior. Looking west and south on the water map brings the Mazon River system into the picture, while the elevation view places the pair outside the broadest northeastern river lowland. That combination helps distinguish the east-side communities from Morris and Minooka even when the straight-line map distance looks modest.
Mazon and Gardner make the southern pattern easier to understand. Mazon is a south-central marker that also helps locate the Mazon River system, whereas Gardner sits closer to I-55 on the southeastern side. The general map is the quickest way to compare their road positions, the water map explains the nearby creek and river network, and the elevation map shows how the southern terrain relates to higher western ground. Using the same two towns across several files is more informative than reading a long list of place names.
For a classroom handout or regional comparison, the best approach is to choose the file that matches the question. Use the general view when roads, boundaries, and multiple communities matter together. Use the ranked city map when the six main markers should remain uncluttered. Switch to the water layer for named rivers and creeks, and use the relief image when low river corridors and higher terrain are the subject. The files are designed to complement one another rather than compete for the same role.
Using the high-resolution JPG package
The WebP images in the article are optimized as browser previews, so small creek labels, road shields, and the CITY INDEX can become difficult to read on a narrow screen. The downloadable originals are 2572 × 3638 pixel portrait JPG files. They are more convenient for zooming into the Morris road network, reading minor water labels, comparing city markers, or placing a full county map into a document without enlarging a small screenshot.
The ZIP contains the same four subjects discussed above: the general county map, ranked city map, terrain-and-water map, and elevation map. They can be printed, placed in lesson materials, used in a presentation, or compared with other county maps at a similar scale. The files do not add flood zones, parcel boundaries, engineering elevations, live traffic, or road-construction status, so those topics still require the appropriate current source.
Frequently Asked Questions
Why are the largest river labels concentrated in northeastern Grundy County?
The supplied water map places the Des Plaines and Kankakee rivers near their meeting area in the northeast and shows the Illinois River continuing westward from that river system. That is why several major river names and a broad zone of low terrain appear in the same corner. The map is useful for location reference, but it does not provide flood forecasts, water levels, or navigation guidance.
Do the CITY INDEX values represent current official population counts?
They should be read only as the values printed on the supplied ranked-city map. Morris is shown at 14,898, Minooka at 12,891, Coal City at 5,317, Diamond at 2,984, Gardner at 1,410, and Mazon at 1,401. This page uses those numbers to explain the map’s ranking rather than claiming that they are the newest official population estimates.
Is the 114–215 meter elevation range accurate enough for surveying or construction?
No. The elevation file is a generalized county-scale surface meant to compare lower river corridors with higher surrounding ground. It is not a survey product and should not be used to set building elevations, road grades, drainage designs, or legal measurements. Original USGS elevation data and professional surveying are appropriate when precise site values are required.
Map File Information
The ZIP contains the Grundy County general map, ranked city map, terrain-and-water map, and elevation map as original high-resolution JPG files.
- Included Files: 4 JPG maps
- Printable Size: 2572 × 3638 pixels each
- Intended Use: Printing, education, presentations, and geographic reference
Related Maps
Sources and reference data
- Grundy County, Illinois official website – current county government and local information
- U.S. Census Bureau TIGER/Line Shapefiles – official boundary and geographic reference data
- USGS National Hydrography – original river and stream reference data
- USGS 3D Elevation Program – original elevation data for more precise analysis
Green Map creates custom-edited map images using open geographic data sources such as geoBoundaries, Natural Earth, OpenStreetMap, and government open data.
These maps are edited visual materials, not raw data files, and are provided for education, documents, presentations, and graphic reference.