UNESCO Institute for Statistics (UIS) data for 2023 show an unusually concentrated gender-parity pattern among outbound internationally mobile tertiary students studying in North America and Western Europe. Of the 183 countries and territories with an adjusted gender parity index (GPIA), 179 fall within the commonly used parity band of 0.97–1.03. More strikingly, 179 observations are exactly 1.0. The dataset is therefore dominated by parity values, with only a handful of clear exceptions.
The adjusted gender parity index compares female and male values while correcting the asymmetry of a simple female-to-male ratio. A value of 1.0 means the female and male values are equal. Values below 1 mean the female value is lower than the male value, while values above 1 mean the female value is higher. The adjustment keeps the index between 0 and 2 and makes equal-sized disparities sit at equal distances from 1.
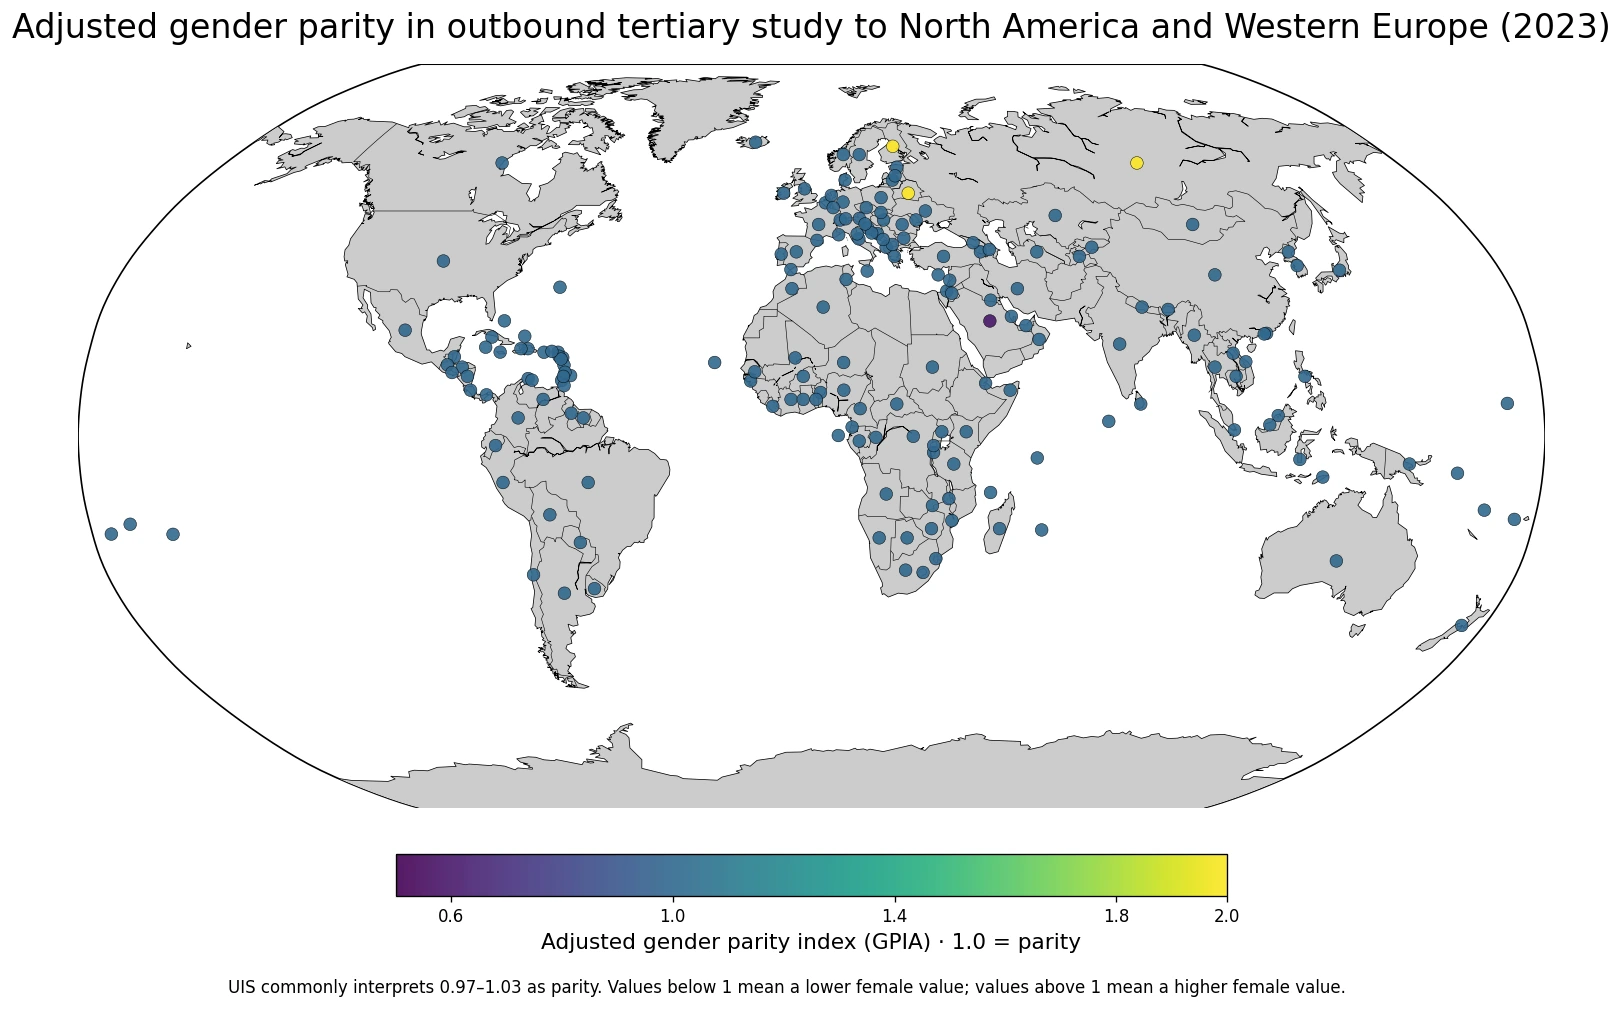
Table of Contents
179 of the 183 observations are exactly 1.0
179 of the 183 published values are exactly 1.0. That matters more than the arithmetic mean in this dataset because it shows that the distribution is not simply centered near parity; it is heavily concentrated at the parity point itself. The mean is 1.014 and the median is 1.0, but those summaries hide how many observations are identical.
A conventional country ranking adds little when most countries share the same value. Countries at 1.0 cannot be meaningfully ordered using this indicator alone, and the same GPIA can correspond to very different numbers of female and male students. The useful comparison is between the large parity group and the small set outside the parity band.
Only four observations fall outside the parity band
Using the commonly cited UIS parity band of 0.97–1.03, only 4 observations fall outside it. Saudi Arabia is at 0.59833, while Belarus, Finland, and the Russian Federation are each at 2.0. These four values stand out sharply against the 179 exact-1.0 observations.
| Country or territory | 2023 GPIA | Direction |
|---|---|---|
| Saudi Arabia | 0.59833 | female value lower than male value |
| Belarus | 2 | female value higher than male value |
| Finland | 2 | female value higher than male value |
| Russian Federation | 2 | female value higher than male value |
Saudi Arabia’s value below 1 means the female value for this indicator is lower than the male value. A value of 2.0 sits at the upper boundary of the adjusted index and signals an extreme difference in the direction of a higher female value. The GPIA does not reveal the underlying female and male student counts, so the practical size of these disparities should be checked against sex-disaggregated counts before drawing broader conclusions.
Why the adjusted index is symmetric around 1
According to the UNESCO UIS definition of adjusted parity indices, a standard gender parity index divides the female value by the male value. A simple ratio is not symmetric around 1: a female value that is half the male value gives 0.5, while a female value twice the male value gives 2.0. Those values do not express equal-sized opposite disparities at equal distances from 1.
For ratios above 1, UIS uses the inverse ratio and subtracts it from 2. The adjusted measure therefore runs from 0 to 2 and is symmetric around 1. Values such as 0.8 and 1.2 represent disparities of the same size in opposite directions, which makes the GPIA easier to compare when the goal is distance from parity.
This is not a gender-balance measure for all students studying abroad
The geographic scope of the underlying indicator is specific: it covers outbound internationally mobile tertiary students from each origin country who are studying in North America and Western Europe. It does not combine every destination region. A country can therefore have one gender pattern for study in North America and Western Europe and a different pattern across all destinations.
That distinction matters when interpreting a value of 1.0. It means parity for this particular destination-region indicator, not necessarily parity among all internationally mobile tertiary students from the country. A complete picture would require comparable indicators for other destination regions or an all-destinations series.
A value of 1.0 says nothing about the size of student mobility
GPIA is a ratio-based parity measure, not a count. Ten female and ten male students can produce the same 1.0 value as ten thousand female and ten thousand male students. The map therefore does not show which countries send the most students to North America and Western Europe.
Questions about mobility volume require the female and male counts, total outbound internationally mobile student numbers, or mobility rates. GPIA is useful for the balance between sexes, but it cannot substitute for those measures of scale.
Extreme GPIA values should be checked against the underlying counts
A boundary value such as 2.0 is visually dramatic, but parity indices can be sensitive when the underlying number of students is small. If only a small number of students from an origin country study in the destination region, a difference of a few students can generate a large ratio.
The supplied dataset contains the GPIA value but not the female and male counts used to calculate it. For that reason, this analysis does not convert the 2.0 observations into claims about how many more women than men are studying abroad, nor does it translate Saudi Arabia’s 0.59833 into a student-count gap. The index supports statements about direction and distance from parity, not the absolute number of students.
A peer example sits exactly at parity
The Republic of Korea has a 2023 GPIA of 1.0, placing it in the same large parity group as most observations in the dataset. The Democratic People’s Republic of Korea is also recorded at 1.0. These values describe the adjusted parity index only; they do not imply that the underlying student counts are similar between the two countries or to other countries at 1.0.
The strongest feature is concentration, not a long ranking
179 of the 183 observations, or 97.8%, are inside the 0.97–1.03 parity band, and 179 are exactly 1.0. That is why a map of the indicator appears visually uniform across most countries. The uniformity reflects the published data distribution rather than a failure of the map.
At the same time, a distribution this concentrated makes it especially important to inspect how the indicator was constructed and, where possible, the underlying sex-disaggregated counts. The map is useful for locating the four exceptions. Explaining why those exceptions occur would require more detailed country-level mobility data than the GPIA alone provides.
Data scope and source
The analysis uses 183 national-level 2023 observations from the UNESCO Institute for Statistics official API indicator OE.5T8.40500.GPIA. The indicator is the adjusted gender parity index for outbound internationally mobile tertiary students studying in North America and Western Europe. Countries without a supplied observation are not assigned zero.
UIS defines adjusted parity indices on a 0–2 scale centered on 1 and commonly treats 0.97–1.03 as gender parity. The index describes the direction and size of a gender difference in the underlying indicator, but it does not show the actual number of female or male students.
The main takeaway
In 2023, 179 of the 183 observations are exactly 1.0 and 179 fall within the 0.97–1.03 parity band. Saudi Arabia is the only observation below the band at 0.59833, while Belarus, Finland, and the Russian Federation are at the upper boundary of 2.0. The central story is therefore not a detailed country ranking, but an unusually strong concentration at parity with just four clearly visible exceptions.
Frequently Asked Questions
What does a GPIA of 1.0 mean?
It means the female and male values of the underlying indicator are equal. UIS commonly interprets values from 0.97 to 1.03 as gender parity.
Does a GPIA of 2.0 mean there are exactly twice as many female students?
No. The adjusted index transforms ratios above 1 to make disparities symmetric around 1. A value of 2.0 is the upper boundary; the actual female and male counts are needed to measure the numerical gap.
Does this indicator cover all students studying abroad?
No. It covers outbound internationally mobile tertiary students studying specifically in North America and Western Europe, not every destination region.
Related Maps
Green Map creates custom-edited map images using open geographic data sources such as geoBoundaries, Natural Earth, OpenStreetMap, and government open data.
These maps are edited visual materials, not raw data files, and are provided for education, documents, presentations, and graphic reference.