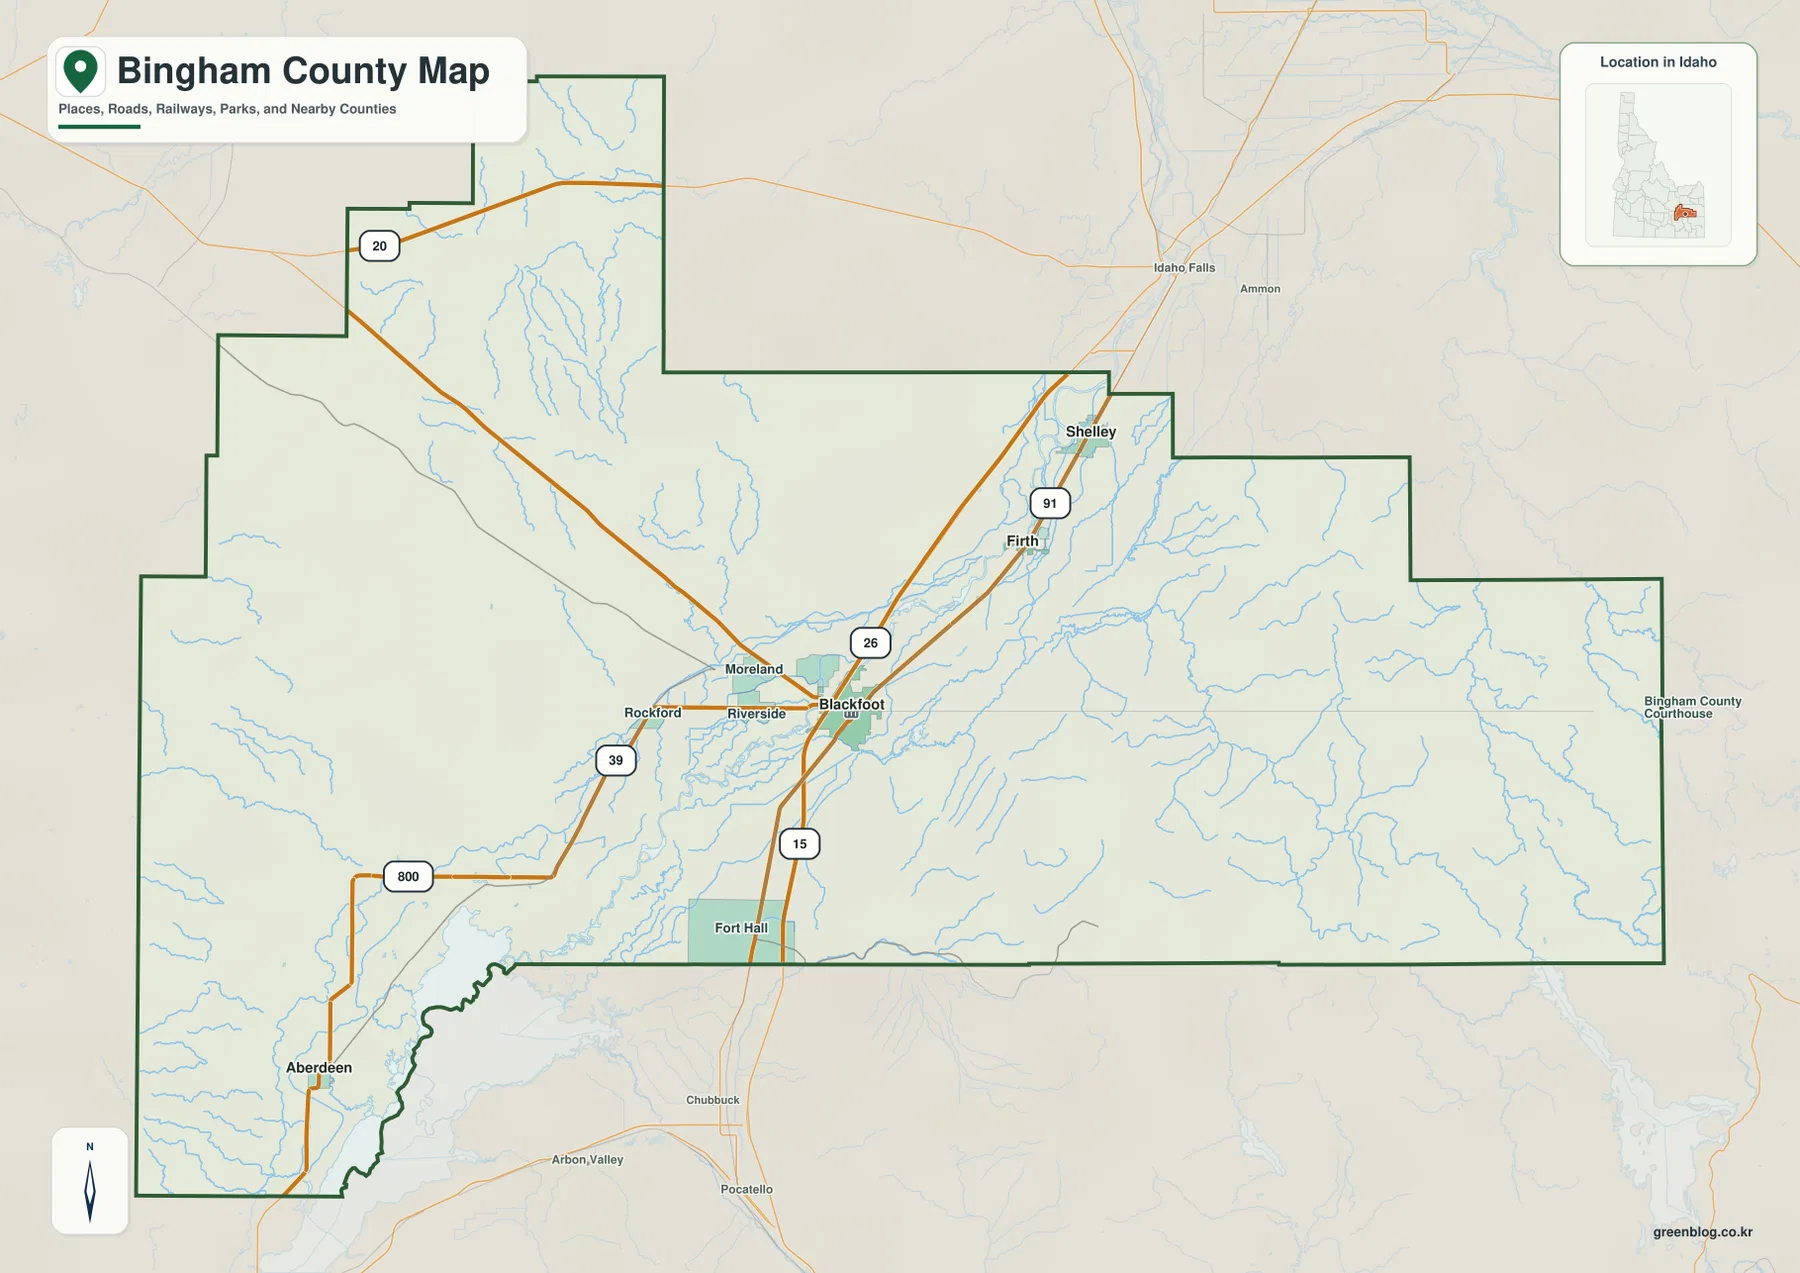
Bingham County Map files are available here as a downloadable ZIP of high-resolution A3 JPG maps, with WEBP previews on the page for quick viewing. The set covers the county boundary and roads, the main city locations, rivers and canals, and the sharp rise from the broad central plain into the eastern highlands.
Blackfoot is the best reference point for reading the county. From there, the map spreads north toward Firth and Shelley, southwest toward Aberdeen, and east into much rougher mountain terrain. The Snake River corridor and a dense irrigation network cross the lower central and western areas, while the eastern half becomes more dissected by streams and higher relief.
Table of Contents
Start with Blackfoot and the shape of Bingham County
Bingham County was created in 1885, and the county government identifies Blackfoot as the county seat. On the map, Blackfoot sits near the middle of the populated corridor and provides an easy anchor for understanding the rest of the county. Shelley and Firth are north of it, Aberdeen is far to the southwest, and the Fort Hall area appears near the southern edge.
The boundary itself is irregular rather than rectangular. Large steps along the north and east create a long county that reaches from open lower country into more rugged terrain. This shape matters when comparing the maps because a place that looks close to the center of the outline may still be far from the eastern mountain boundary or the southwestern corner.
Where the main cities sit
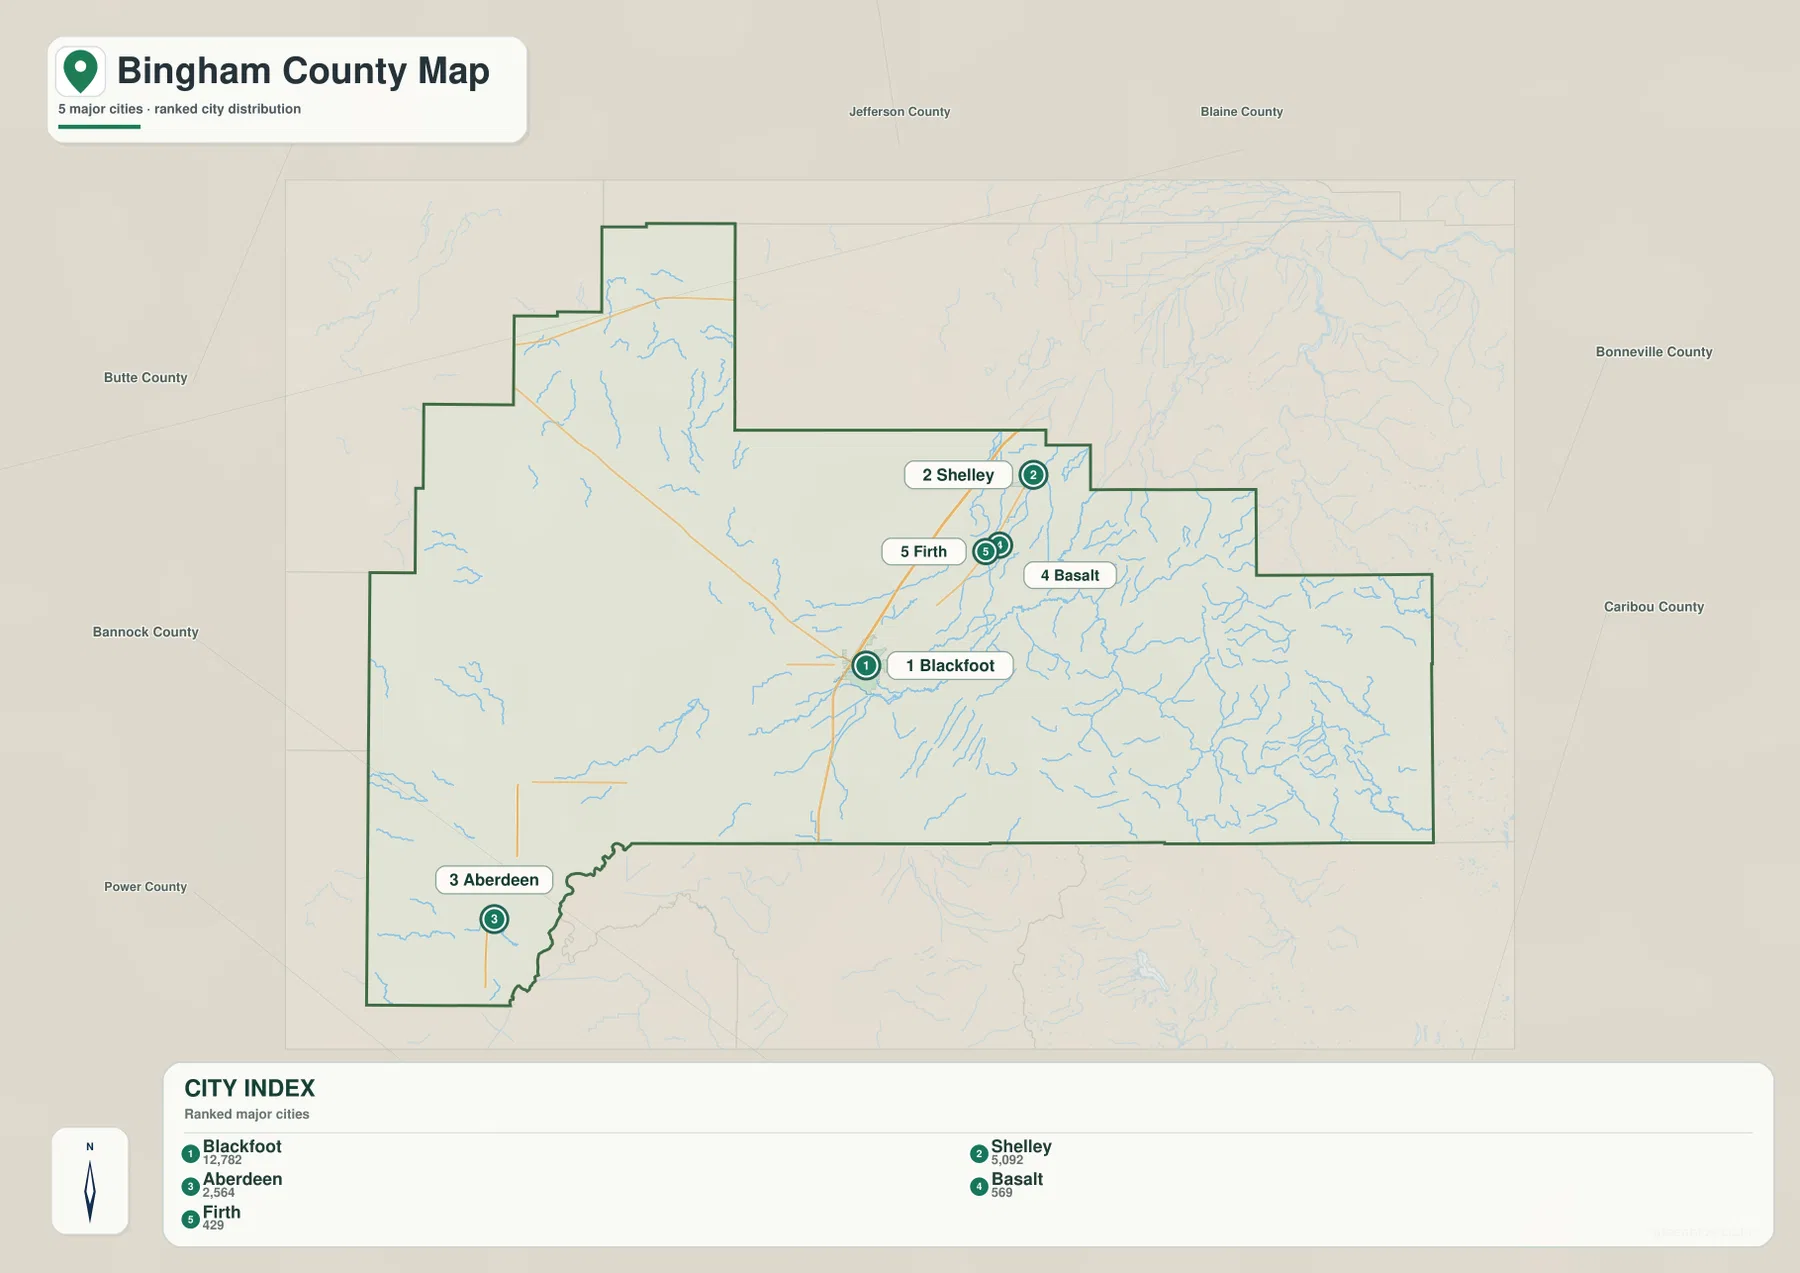
The city map strips away much of the background detail and emphasizes five places: Blackfoot, Shelley, Aberdeen, Basalt, and Firth. Blackfoot ranks first in the provided city index, while Shelley is the next largest. Firth and Basalt form a small cluster north and northeast of Blackfoot, whereas Aberdeen sits well apart in the southwest.
This distribution makes the county easier to understand than a long list of place names would. The strongest concentration is along the central-to-northern corridor, and the southwest has its own distinct center around Aberdeen. For readers comparing driving directions, school districts, service areas, or nearby communities, the city map is often the quickest view to consult first.
Roads that connect the central plain
Interstate 15 passes through the central part of the county and gives Blackfoot a strong north-south connection. US 91 also follows the populated corridor toward Firth and Shelley. US 26 crosses the Blackfoot area and continues across the county, while State Highway 39 leads toward Rockford and Aberdeen in the southwest.
These routes explain why Blackfoot works so well as the map’s reference point. Several major roads meet or pass nearby, and the surrounding smaller communities are easier to place once the central junction is located. The overview map is especially useful for seeing how the road network changes as it leaves the flatter central land and approaches the eastern highlands.
Snake River, Blackfoot River, and the canal network
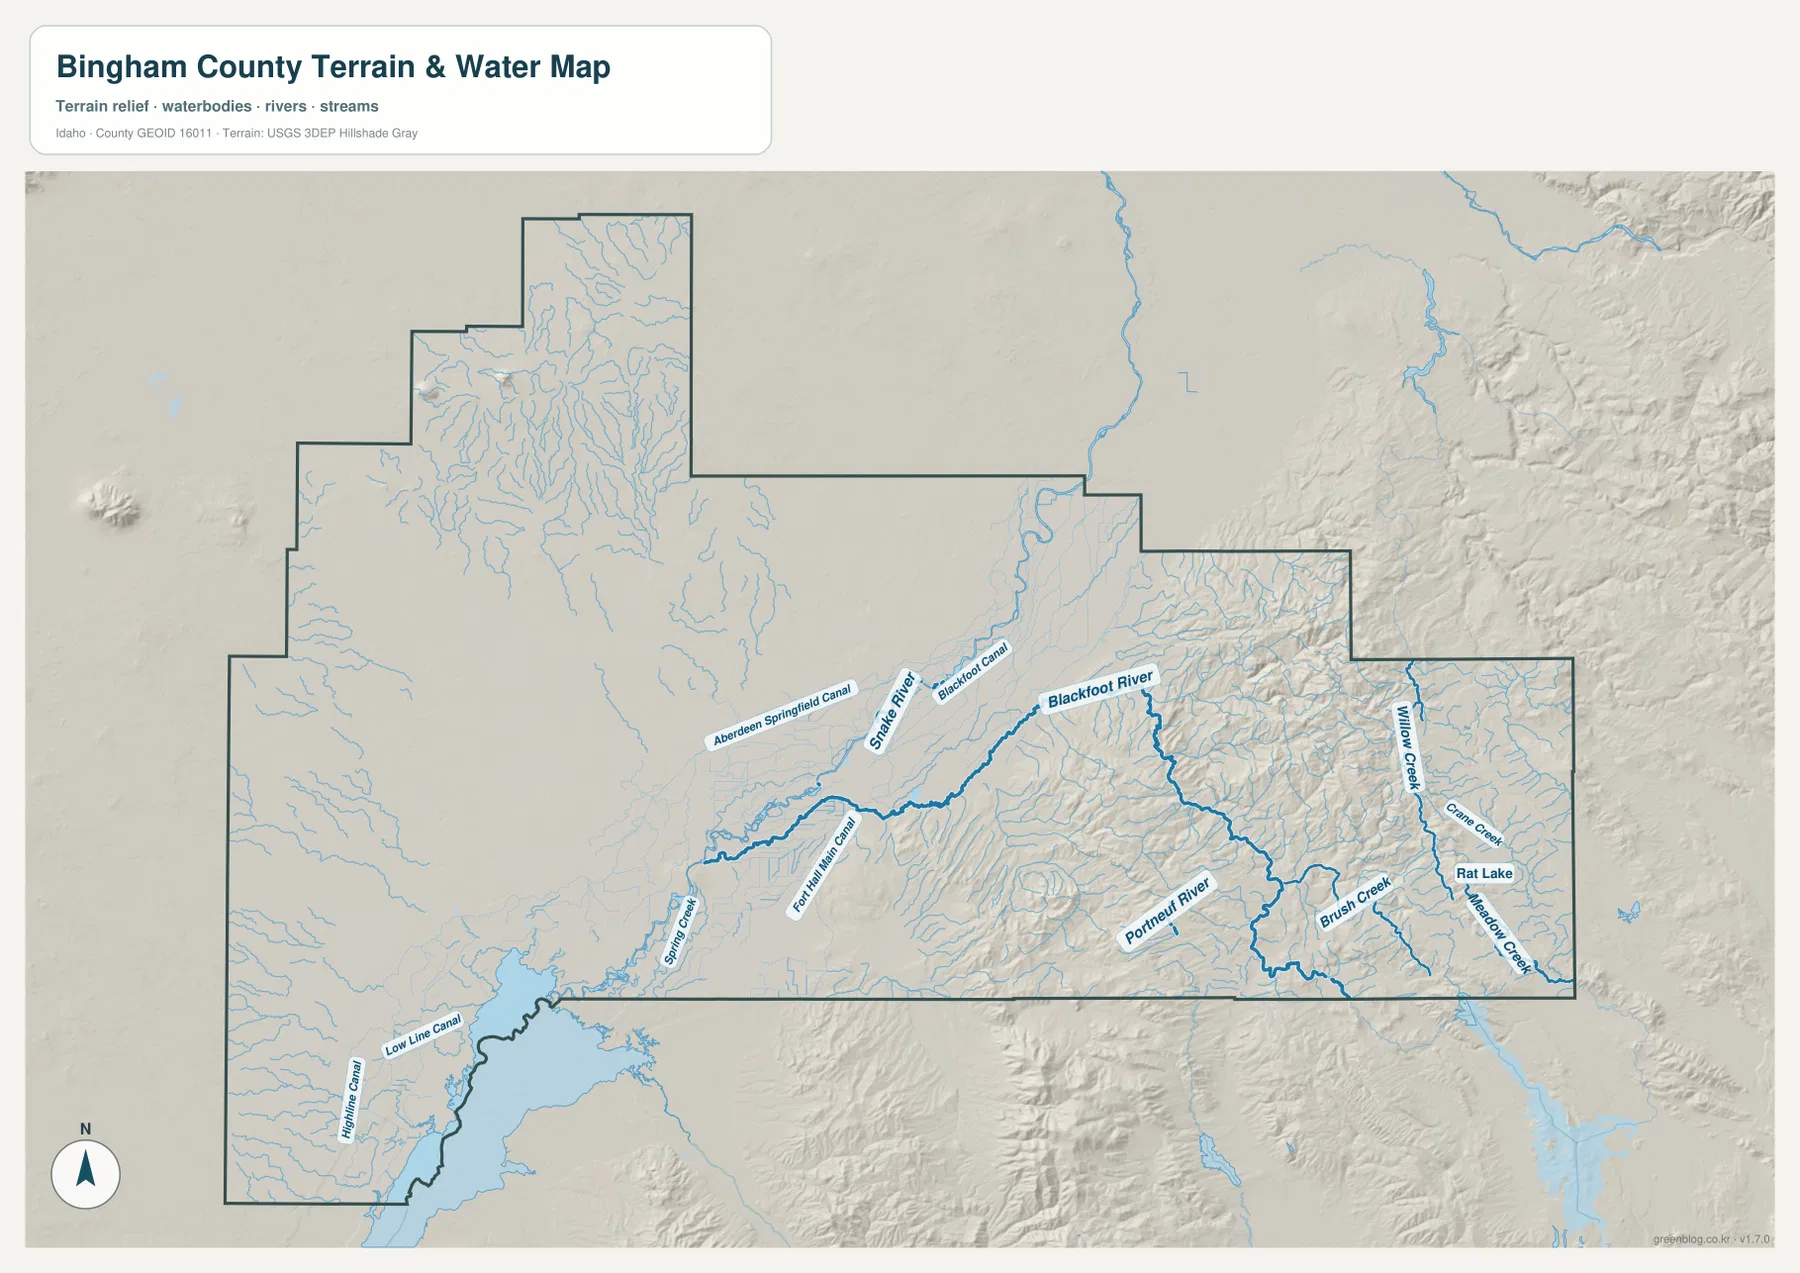
The terrain-and-water map adds one of the county’s most distinctive layers. The Snake River crosses the central part of Bingham County, and the Blackfoot River comes in from the east. Farther southeast, the Portneuf River follows a separate mountain drainage. Smaller streams become much more numerous toward the eastern side, where the land is steeper and more deeply cut.
The lower country also contains an extensive network of named canals. Aberdeen-Springfield Canal, Blackfoot Canal, Fort Hall Main Canal, Low Line Canal, and High Line Canal all appear on the map. Their presence makes the central and western plain look very different from the branching natural streams in the mountains. These lines are water features shown on the map; they should not be read as property, zoning, or ownership boundaries.
Willow Creek and Brush Creek are among the labeled eastern tributaries, and Rat Lake appears near the eastern side. Looking at the water map together with the city map helps explain why the central plain contains the larger towns while the eastern portion is dominated by headwater streams and rougher terrain.
The eastern half rises far above the central plain
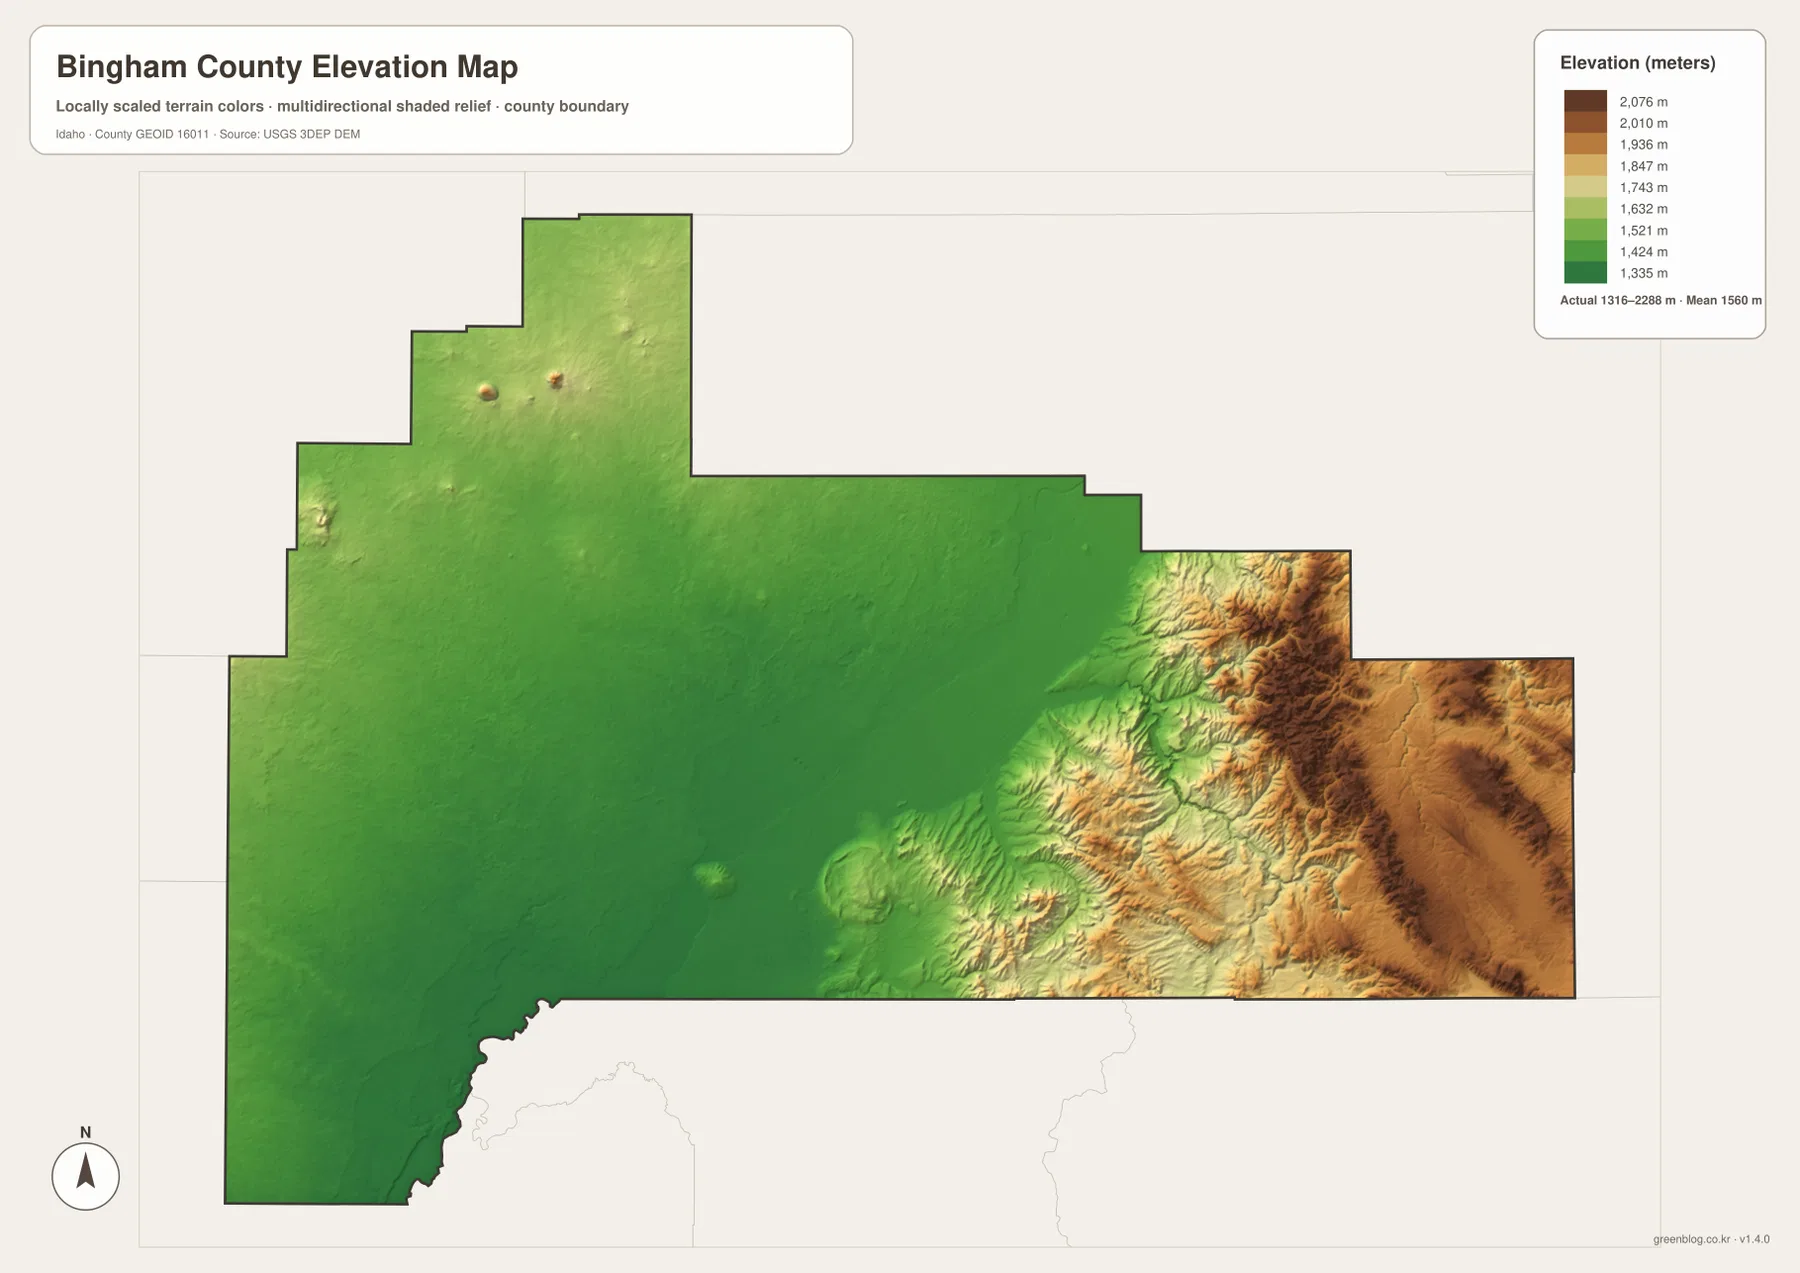
The elevation map makes the county’s east-west contrast unmistakable. Most of the central and western area is shown in lower green tones, forming a broad plain around Blackfoot and the Snake River corridor. East of that plain, the colors shift quickly into yellow, tan, and brown as ridges and mountain valleys gain elevation.
The map reports an actual elevation range of roughly 1,316 to 2,288 meters, with a mean near 1,560 meters. The legend is most useful for regional comparison rather than for surveying an individual point. It shows that the eastern boundary area is substantially higher than the Blackfoot plain, while a few isolated raised features also stand out in the northwestern part of the county.
How the four views work together
Each map answers a different practical question without requiring specialized GIS software. The county overview is best for roads and general orientation. The city view makes the main communities easy to compare. The terrain-and-water map is the clearest source for rivers, canals, tributaries, and relief, while the elevation map gives the fastest visual comparison between the lower plain and the high eastern side.
Using the maps together is helpful for classroom work, local research, travel planning, presentations, and county-to-county comparisons. A reader can locate Blackfoot on the city map, follow nearby roads on the overview, identify the Snake and Blackfoot rivers on the water map, and then check how the surrounding land changes in elevation. That sequence turns the same county into a much more complete geographic picture.
Download the high-resolution Bingham County maps
The WEBP images above are designed for fast viewing in a browser. For printing or larger-format work, use the ZIP below. It contains the county overview, city map, terrain-and-water map, and elevation map as high-resolution A3 JPG files.
Frequently Asked Questions
Where is Blackfoot on the Bingham County map?
Blackfoot is near the center of the main populated plain, close to I-15, US 26, and US 91. It is the county seat and a useful reference point for finding Shelley and Firth to the north and Aberdeen to the southwest.
Which water features are most visible?
The Snake River and Blackfoot River are the most prominent named rivers on the map. The Portneuf River, Willow Creek, Brush Creek, Rat Lake, and several major irrigation canals are also labeled, giving a clear contrast between the central plain and the eastern mountain drainages.
What does the elevation map show?
It shows a broad lower area across the central and western county and much higher terrain to the east. The map is best for comparing regional height differences rather than replacing a survey or site-specific elevation measurement.
Map File Information
Download the high-resolution A3 JPG maps for Blackfoot, major towns, roads, the Snake and Blackfoot rivers, canals, and county elevation in one ZIP archive.
- Included Files: county overview, city map, terrain and water map, elevation map
- File Type: JPG files in a ZIP archive
Related Maps
Sources and references
- Bingham County official website — About Bingham County
- U.S. Census Bureau TIGER/Line Shapefiles
- USGS National Hydrography
- USGS 3D Elevation Program
Green Map creates custom-edited map images using open geographic data sources such as geoBoundaries, Natural Earth, OpenStreetMap, and government open data.
These maps are edited visual materials, not raw data files, and are provided for education, documents, presentations, and graphic reference.