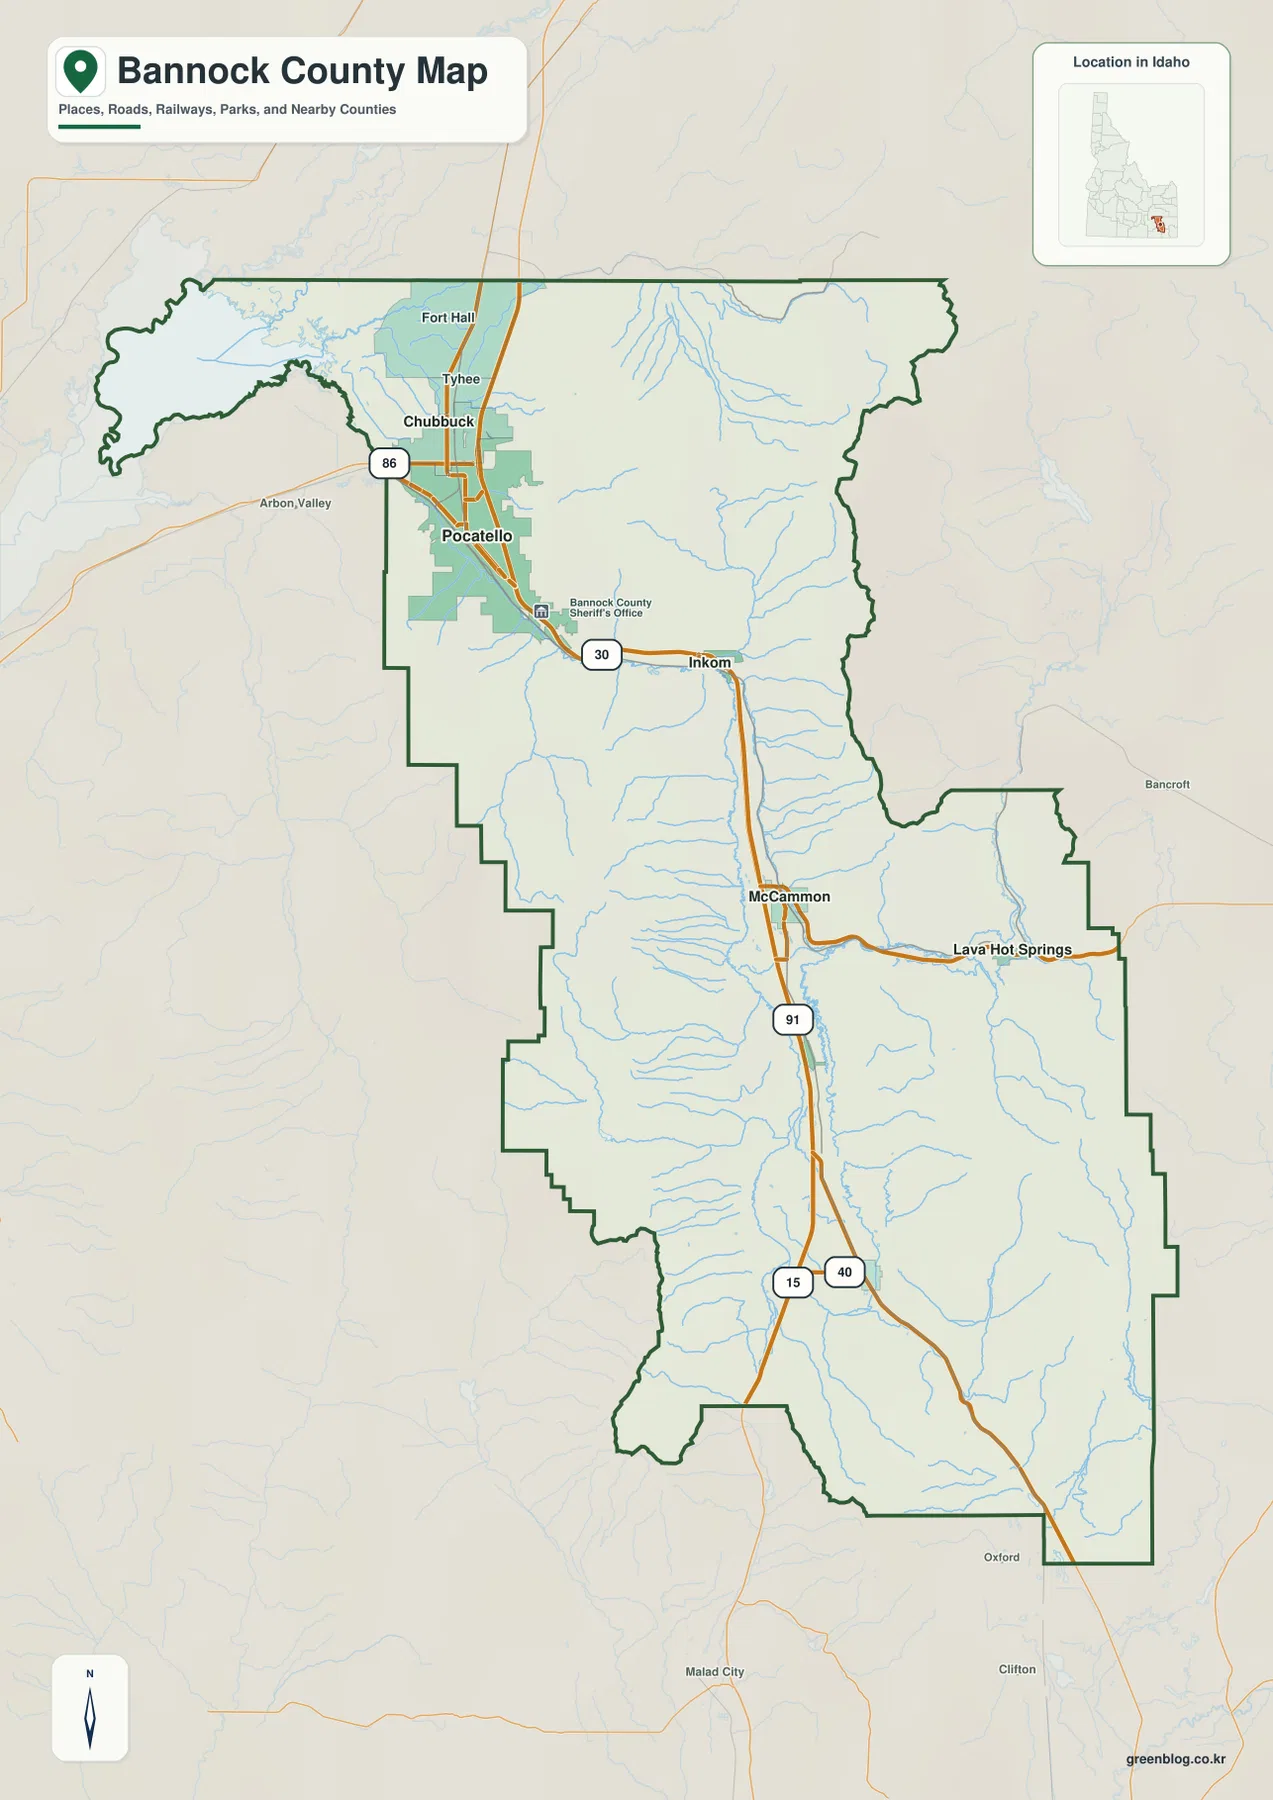
Bannock County stretches from the Pocatello–Chubbuck urban area into a long series of valleys and mountain blocks in southeastern Idaho. The maps on this page let you compare the county boundary, major roads and settlements, the Portneuf River system, and large changes in elevation. You can review each map as a WEBP image on the page, then download the same subjects as high-resolution A3 JPG files in one ZIP when you need a printable copy.
The county’s layout is easiest to understand by following the north-to-south sequence of places. Pocatello and Chubbuck form the largest cluster near the northern part of the county, Inkom and McCammon continue along the main valley corridor, and smaller communities such as Arimo and Downey appear farther south. The terrain and elevation maps add a second layer of information by showing how those settled valleys sit between much higher ridges.
Table of Contents
The county boundary wraps around a long road-and-valley corridor
The general county map places Pocatello and Chubbuck near the northern end of the main developed corridor. Several numbered highways converge around this area, including I-86, I-15, US 30, and US 91 as shown on the map. From Pocatello the road network continues southeast toward Inkom and then south toward McCammon before extending through the narrower middle of the county. This makes the map useful for seeing the county as a connected sequence of valleys rather than a simple rectangular area.
The outer boundary is notably irregular. The western side steps in and out around the middle and southern sections, while the eastern side expands and contracts around several mountain areas. Labels such as Fort Hall and Tyhee appear north of the Pocatello area, and Lava Hot Springs is shown east of McCammon along an east-west road connection. These labels provide helpful orientation even when your main goal is simply to locate the county within southeastern Idaho.
This map is best treated as a regional reference. It shows where the county boundary, communities, roads, and streams sit relative to one another, but it is not a parcel map or a legal survey. For a first look at Bannock County, however, it gives the clearest overview of how the urban north and the longer southern section fit together.
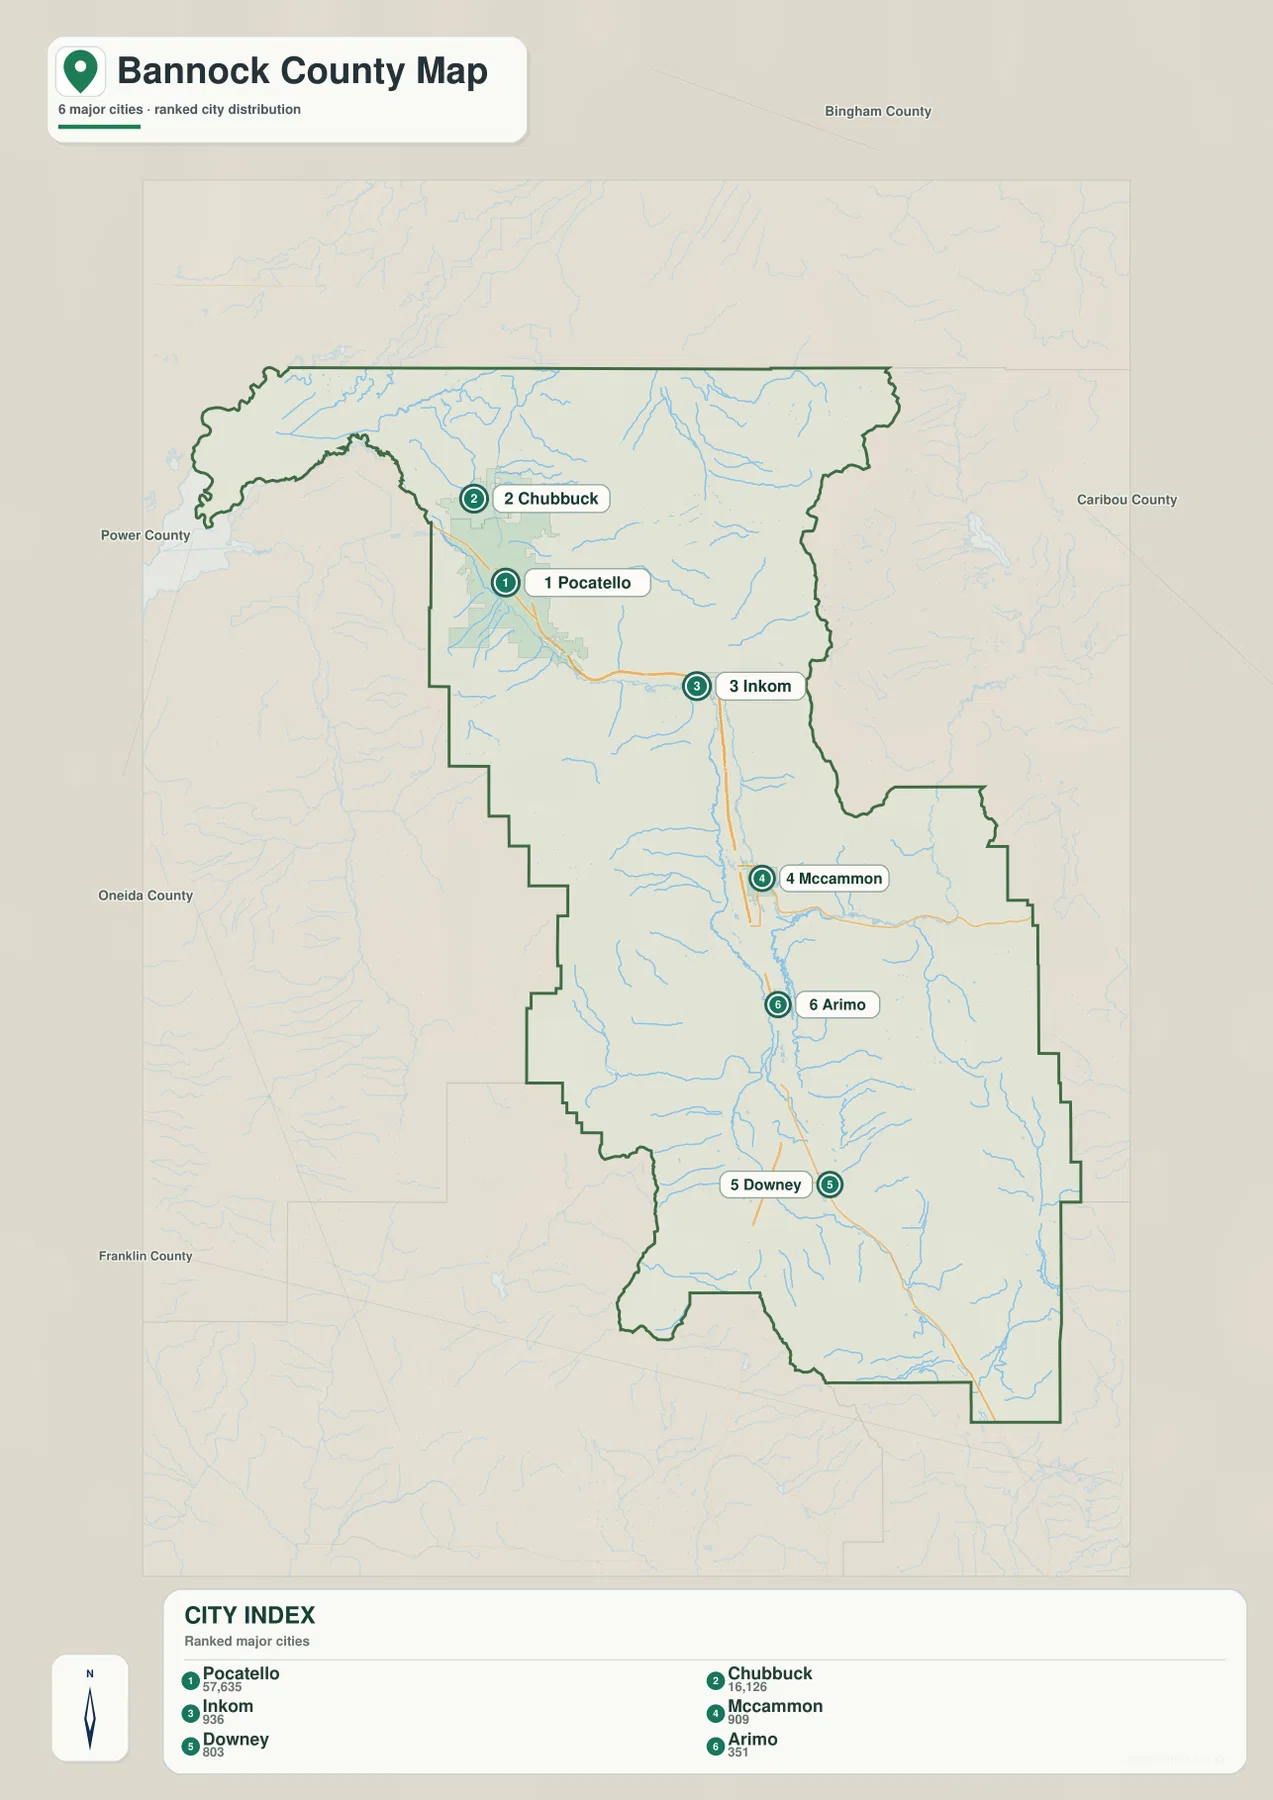
Six ranked cities show how strongly settlement is concentrated in the north
The city map ranks six communities and makes the settlement pattern much easier to compare. Pocatello is marked first and Chubbuck second, with the two cities positioned close together near the northern part of the county. Inkom is third and appears farther southeast, while McCammon is fourth in the central-southern corridor. Downey and Arimo are shown farther south as the fifth and sixth entries.
What matters most on this map is not the ranking by itself but the spacing between the labels. Pocatello and Chubbuck form a tight pair, while the remaining cities are separated by larger stretches of valley and mountain terrain. Inkom sits between the northern urban area and McCammon, and Arimo and Downey occupy the broader southern section. That arrangement explains why a single county-wide map can feel very different depending on whether you are looking at the Pocatello area or the communities south of McCammon.
Use this city map for geographic comparison rather than travel-time measurement. It is well suited to classroom work, county profiles, or planning a reading of the other maps because it tells you where the named communities are before you start comparing rivers and elevation.
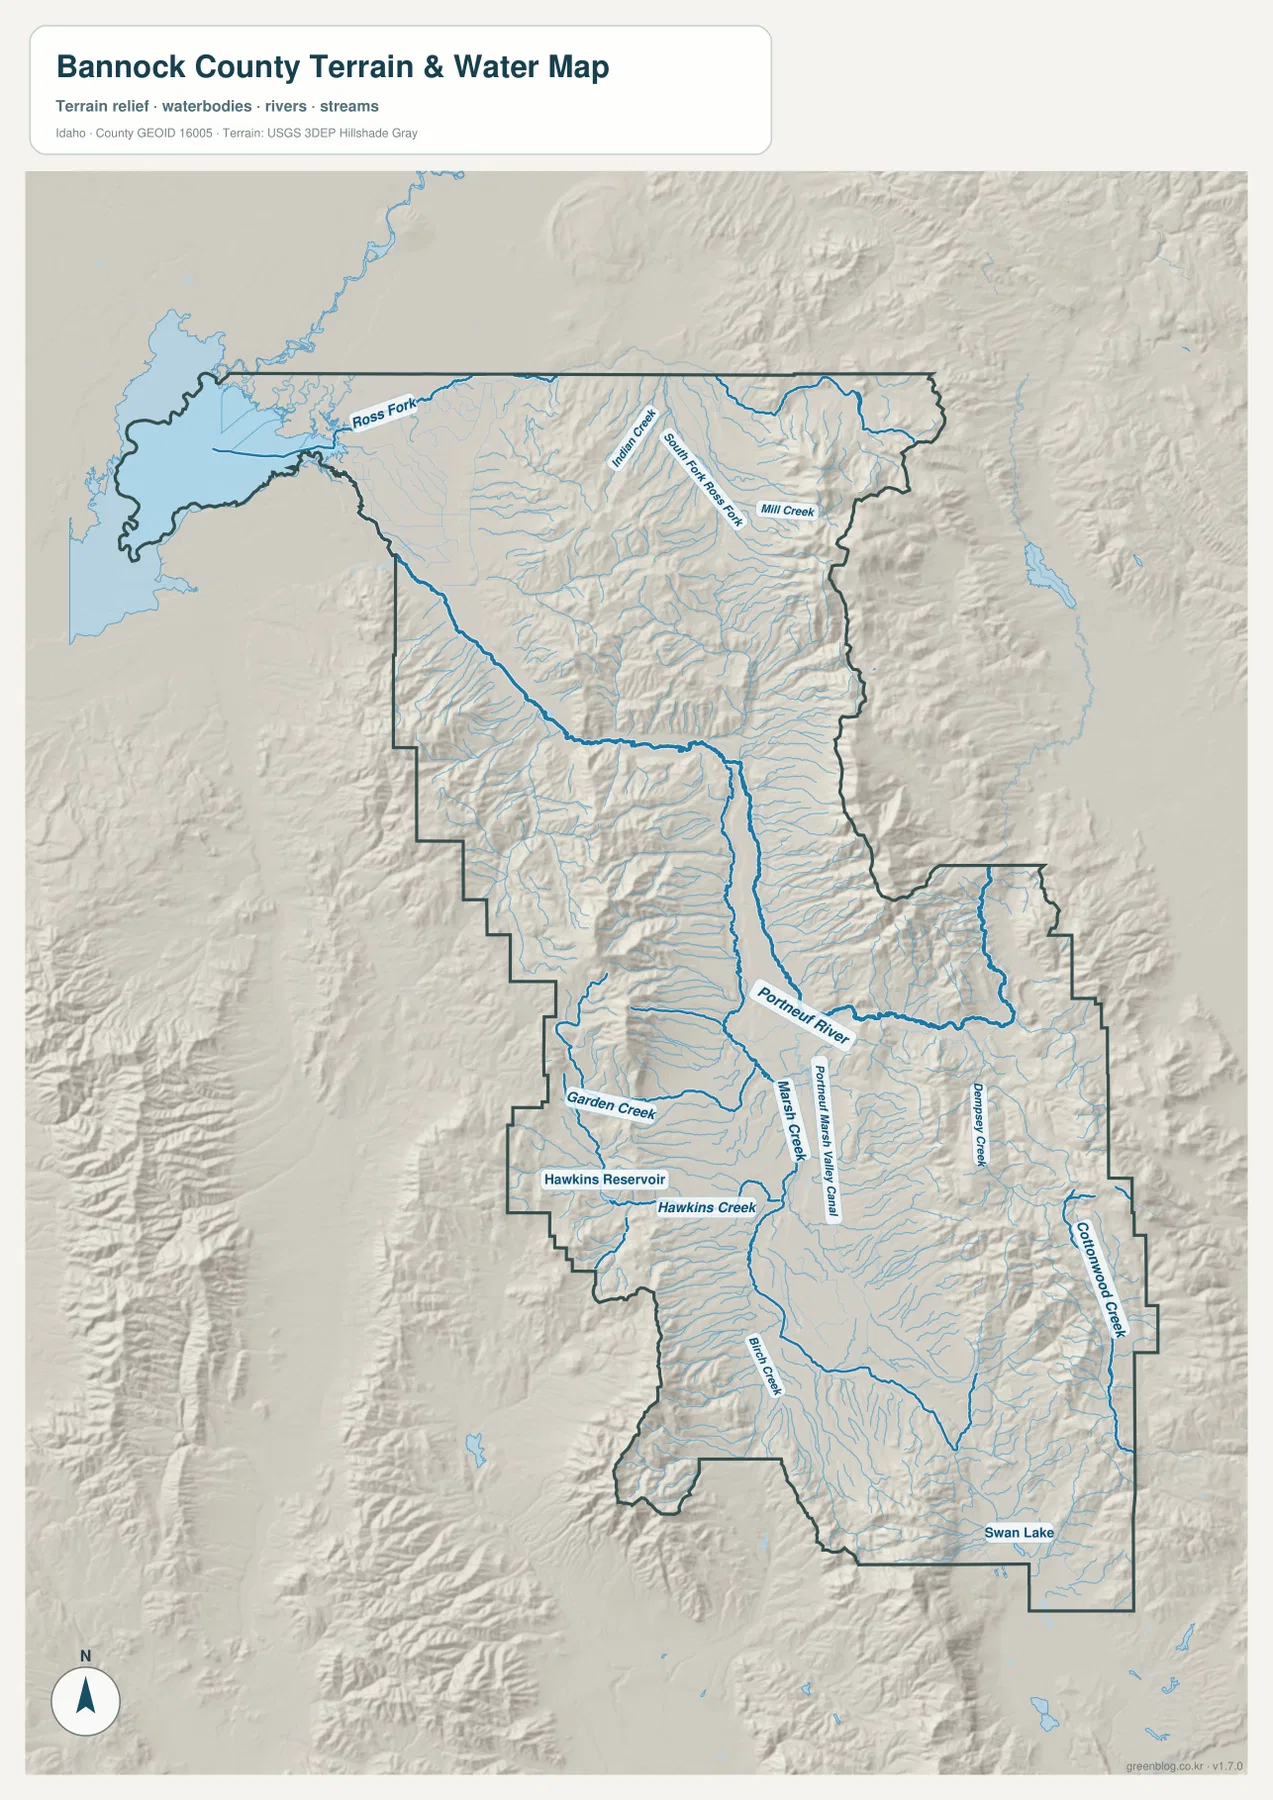
Portneuf River and Marsh Creek connect the central valleys
The terrain-and-water map shifts attention from roads and cities to rivers, creeks, reservoirs, and relief. Portneuf River is one of the most prominent labeled waterways through the middle of the county. Marsh Creek runs along the long valley farther south, and the Portneuf Marsh Valley Canal is also labeled nearby. Together these features make the central valley system easy to trace across the map.
Northern Bannock County contains a different set of labeled streams, including Ross Fork, South Fork Ross Fork, Indian Creek, and Mill Creek. West of the central-southern valley, Garden Creek and Hawkins Creek are shown near Hawkins Reservoir. Farther east and southeast, Dempsey Creek and Cottonwood Creek appear among the mountain slopes, while Birch Creek and Swan Lake are labeled close to the southern end of the county.
The shaded relief is important because it shows why many of the streams occupy narrow valleys between higher ground. The water map should not be used as a flood-zone, legal-boundary, or navigation product. Its strength is regional context: it lets you compare named waterways with nearby ridges and valley bottoms and then carry that information over to the elevation map.
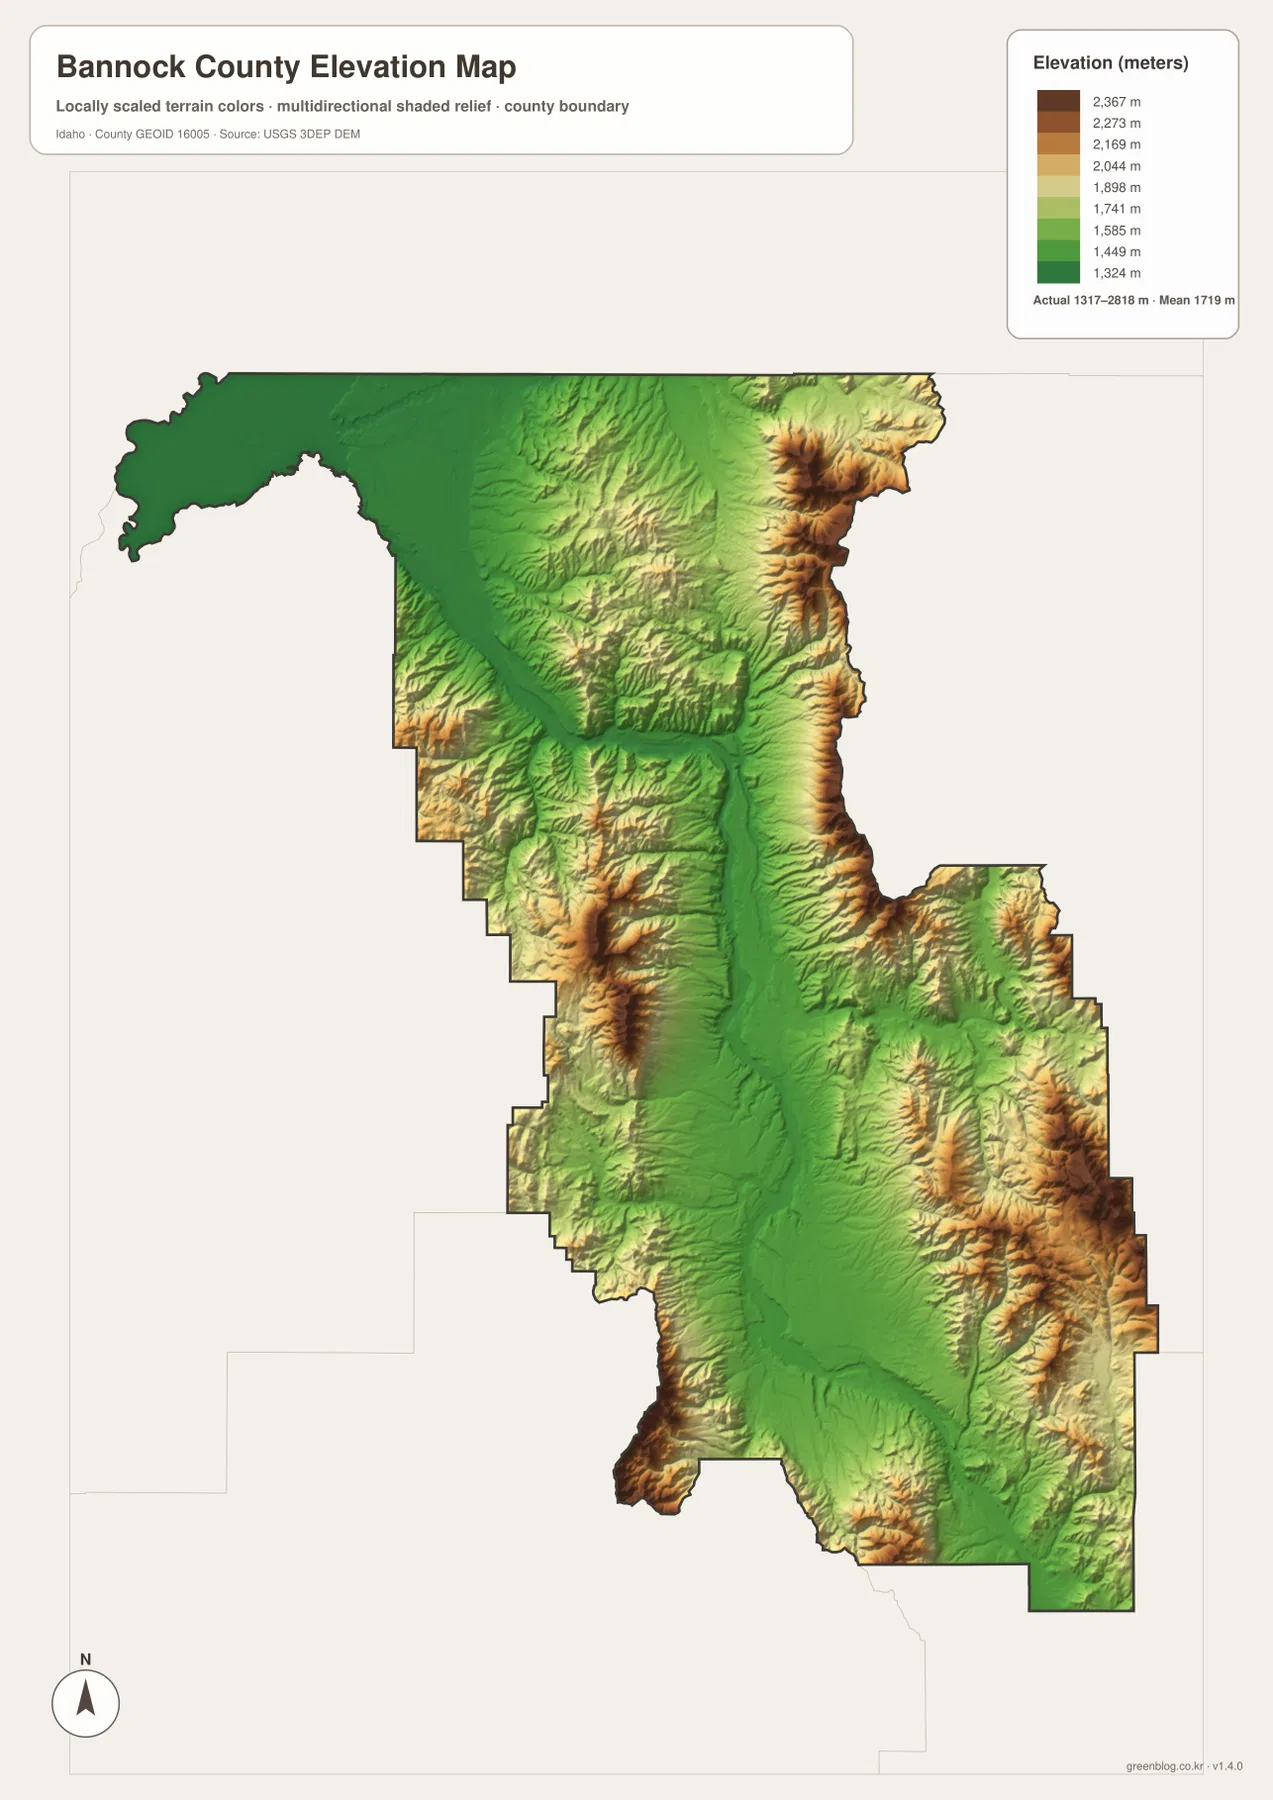
Elevation separates the low valley floors from the surrounding mountain blocks
The elevation map makes the county’s topographic contrast immediately visible. Green areas mark lower terrain through the main valleys, while yellow, tan, and brown colors climb across the ridges on the eastern and western sides. The northeast corner and several southeastern mountain areas stand out as especially high relative to the central valley corridor.
A note on the map reports an actual elevation range of about 1,317 to 2,818 meters and a mean elevation of about 1,719 meters. Those figures are useful at the county scale, but the image is not intended to replace a survey or a site-specific elevation measurement. Its purpose is to show the overall pattern: a long lower corridor bordered by much higher terrain, with additional ridges breaking up the southern part of the county.
Comparing this map with the water map is especially useful. Streams that seemed like isolated blue lines become easier to place once the valley floors and surrounding slopes are visible. The same comparison also helps explain why the major city and road corridor occupies a relatively narrow path through the county.
Choose the map that matches the question you are trying to answer
For a quick orientation, start with the county map because it combines boundaries, place names, roads, and streams. Move to the city map when you want to compare where Pocatello, Chubbuck, Inkom, McCammon, Arimo, and Downey sit within the county. The terrain-and-water map is better for following Portneuf River, Marsh Creek, Hawkins Reservoir, and the smaller tributaries, while the elevation map is the clearest choice for comparing valley floors with surrounding mountains.
Using two maps together often works better than trying to make one map answer every question. For example, the city map shows the settlement sequence, while the elevation map explains the broad terrain around that sequence. The water map adds another layer by placing streams and reservoirs in the same valleys. In a report or lesson, this lets you select only the images that support the topic instead of repeating the same county overview several times.
The WEBP images on this page are convenient for quick viewing. When you need a larger file for print, slides, or a document, use the download box below to get the four A3 JPG maps in a single ZIP archive.
Frequently Asked Questions
What is included in the Bannock County download?
The ZIP contains four separate high-resolution A3 JPG files: the general county map, ranked city map, terrain-and-water map, and elevation map. They match the four subjects previewed on this page.
Which map is best for comparing Pocatello with the smaller cities?
Use the city map first. It places Pocatello and Chubbuck close together in the north and shows Inkom, McCammon, Arimo, and Downey progressively farther south. The general county map can then add roads and boundary context.
Can the elevation map be used for engineering or survey measurements?
No. It is a county-scale reference for comparing lower valleys with higher mountain terrain. Site-specific engineering, construction, or survey work should use the original elevation data and appropriate professional measurements.
Map File Information
The four maps shown on this page are bundled as high-resolution A3 JPG files. The ZIP contains the county map, city map, terrain-and-water map, and elevation map as separate files for printing or document use.
- Included Files: county map, city map, terrain-and-water map, elevation map
Related Maps
Sources and Reference Links
- Bannock County official website – county information and departments
- U.S. Census Bureau TIGER/Line Shapefiles – boundary, road, and place reference data
- USGS National Hydrography – waterway and hydrography reference data
- USGS 3D Elevation Program – elevation and terrain reference data
Green Map creates custom-edited map images using open geographic data sources such as geoBoundaries, Natural Earth, OpenStreetMap, and government open data.
These maps are edited visual materials, not raw data files, and are provided for education, documents, presentations, and graphic reference.