South Central Connecticut Planning Region stretches from the Long Island Sound shoreline around New Haven, West Haven, and Milford northward through North Haven and Wallingford to Meriden. The supplied map set is built around that contrast between a broad coastal section and a long inland extension. One map shows the boundary, settlements, highways, and selected landmarks; a second ranks five labeled population centers; the third focuses on rivers, coastal water, and shaded terrain. High-resolution JPG versions of all three maps are available in the download box later on the page.
The identity data bundled with this task assigns the region state FIPS 09 and county-equivalent FIPS 170. Connecticut planning regions can be used as county-equivalent geography in current federal mapping and statistics, so the boundary on this page should not be assumed to match an older historic county map. The article follows the supplied South Central Connecticut Planning Region outline and does not add places or administrative claims that are not supported by the package.
The shape is easy to recognize once the coast is found. New Haven and West Haven sit near the middle of the shoreline, Milford City (balance) and Woodmont lie farther southwest, and East Haven begins the eastward chain toward Branford Center, Guilford Center, and Madison Center. North Haven and Wallingford Center form a north-south sequence above New Haven, with Meriden occupying the long northern tip. That geometry makes the region feel both coastal and strongly inland at the same time.
Table of Contents
I-95 defines the coast while I-91 leads inland toward Meriden
New Haven is the simplest reference point on the general map because two major highways meet around the city. I-95 runs east-west along the coast, while I-91 heads north through the interior. Following I-95 west places West Haven first and then Milford City (balance) and Woodmont. Following it east places East Haven, Branford Center, Guilford Center, and Madison Center in sequence. Following I-91 north shifts the map away from the shoreline toward North Haven, Wallingford Center, and eventually Meriden.
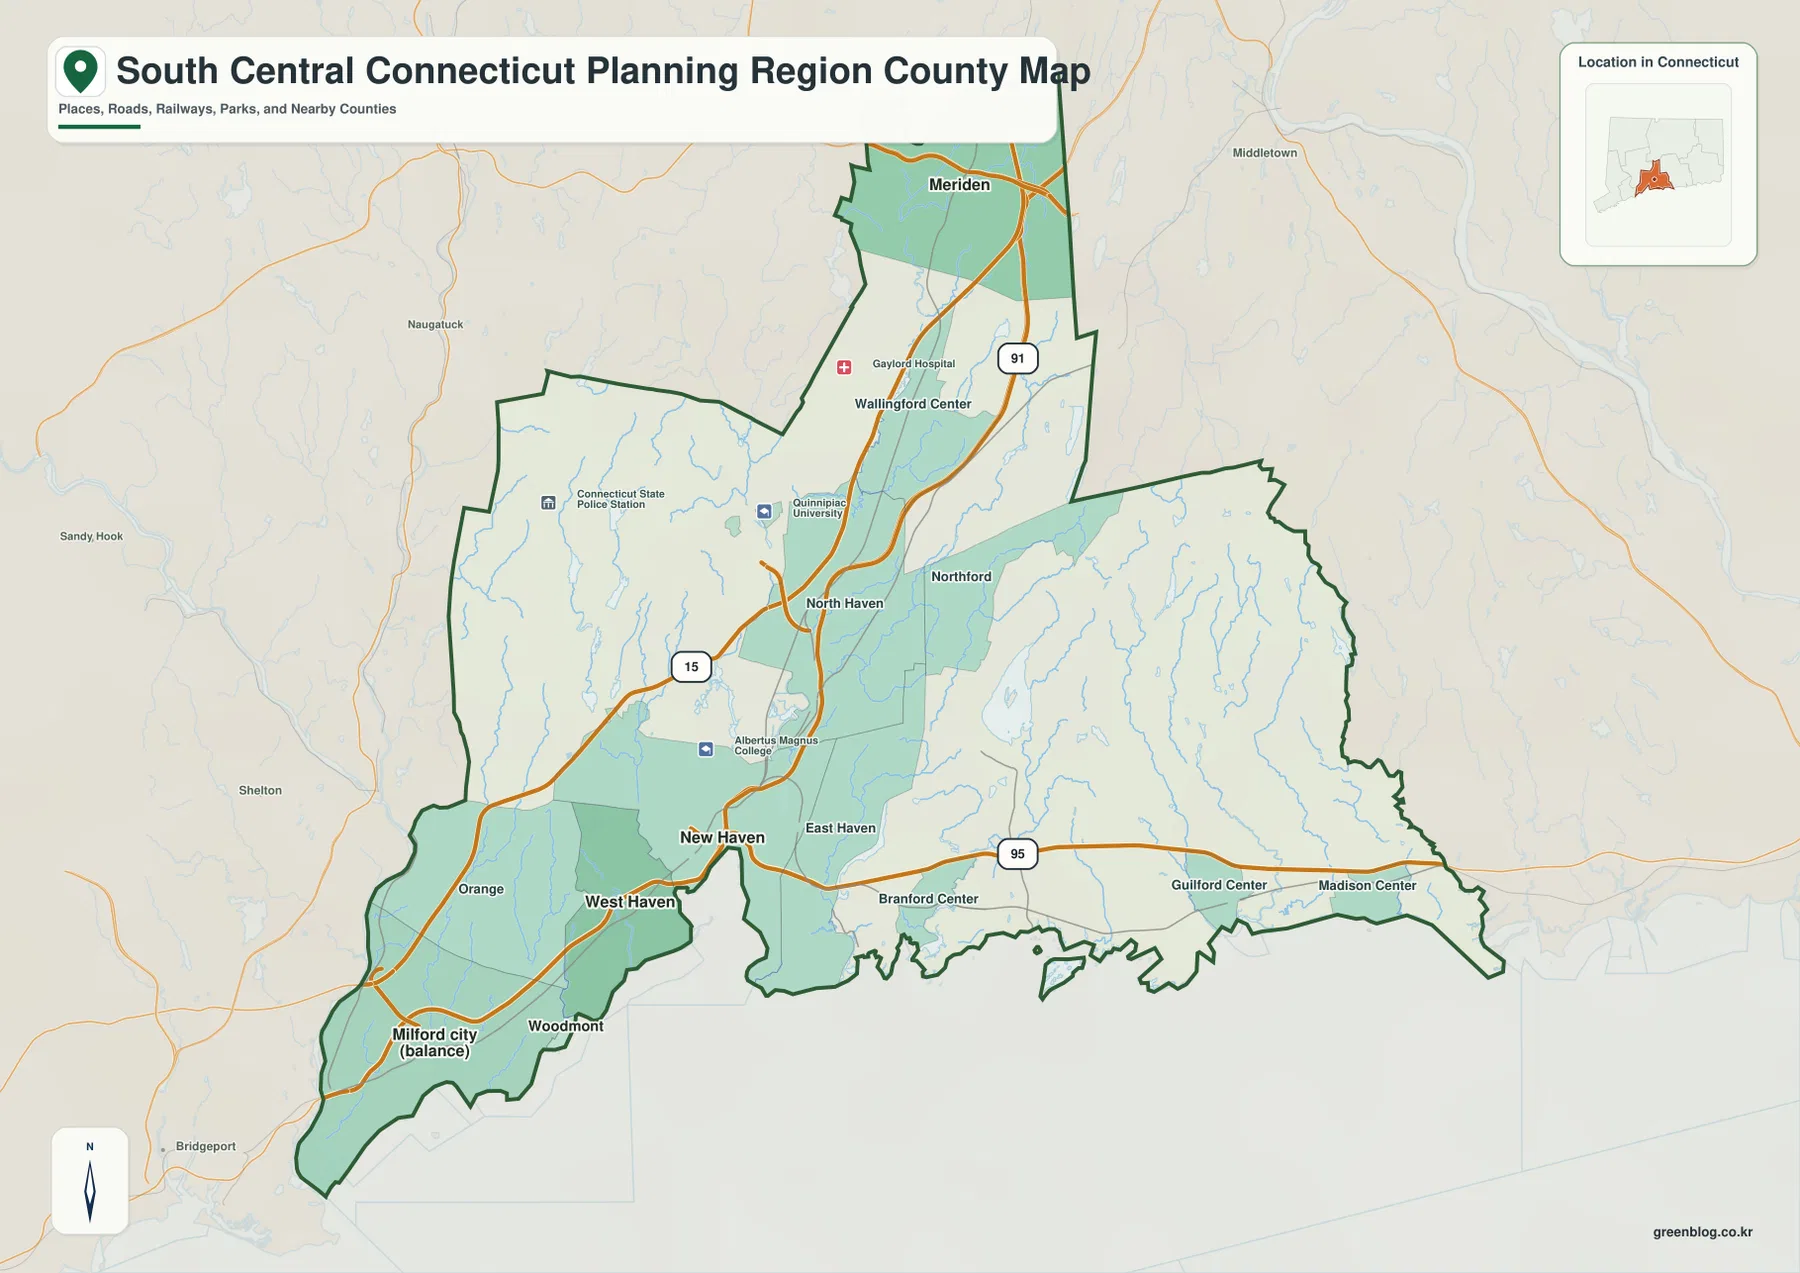
North Haven sits close to I-91 and serves as the first clear inland reference above New Haven. Wallingford Center is farther north, and Gaylord Hospital is marked nearby. Quinnipiac University and Albertus Magnus College are also labeled in the central portion of the map, while a Connecticut State Police Station marker appears farther west. These are useful orientation points on the image, but they should not be read as boundaries or as a complete inventory of institutions in the planning region.
Meriden is near the northern end of the region and is visually separated from the coastal cities by the long Wallingford corridor. I-91 is the strongest continuous guide through that section. The map makes an important point that the name “South Central” can otherwise hide: the region is not only the New Haven shoreline. Its boundary extends well inland, so readers looking only at the coast would miss a large part of the planning-region shape.
Route 15 provides another useful inland reference west and northwest of New Haven. It crosses the central-western area and helps show how Orange and nearby inland areas relate to the coastal I-95 corridor. Comparing Route 15 with I-95 is especially useful around New Haven, West Haven, and Milford because the two roads serve different bands of the region. The map does not show current congestion, closures, or travel times, so live transportation information is still needed for actual driving.
The eastern shoreline reads as a string of separate centers rather than one continuous city. East Haven lies immediately east of New Haven, followed by Branford Center, Guilford Center, and Madison Center. I-95 ties them together, while smaller roads and streams fill the interior. The boundary map is intended for regional orientation, not for parcel ownership, zoning, or precise municipal boundary work; those tasks require the relevant local records and official GIS sources.
The ranked city index contrasts New Haven with Meriden and the western shore
The supplied city-index map contains five ranked points. New Haven is number 1 with the printed value 134,349; Meriden is number 2 with 60,545; West Haven is number 3 with 55,351; Milford City (balance) is number 4 with 51,023; and Woodmont is number 5 with 1,661. The image does not state the statistical year for those values, so this page treats them as the map’s own index figures rather than claiming they are current population estimates.
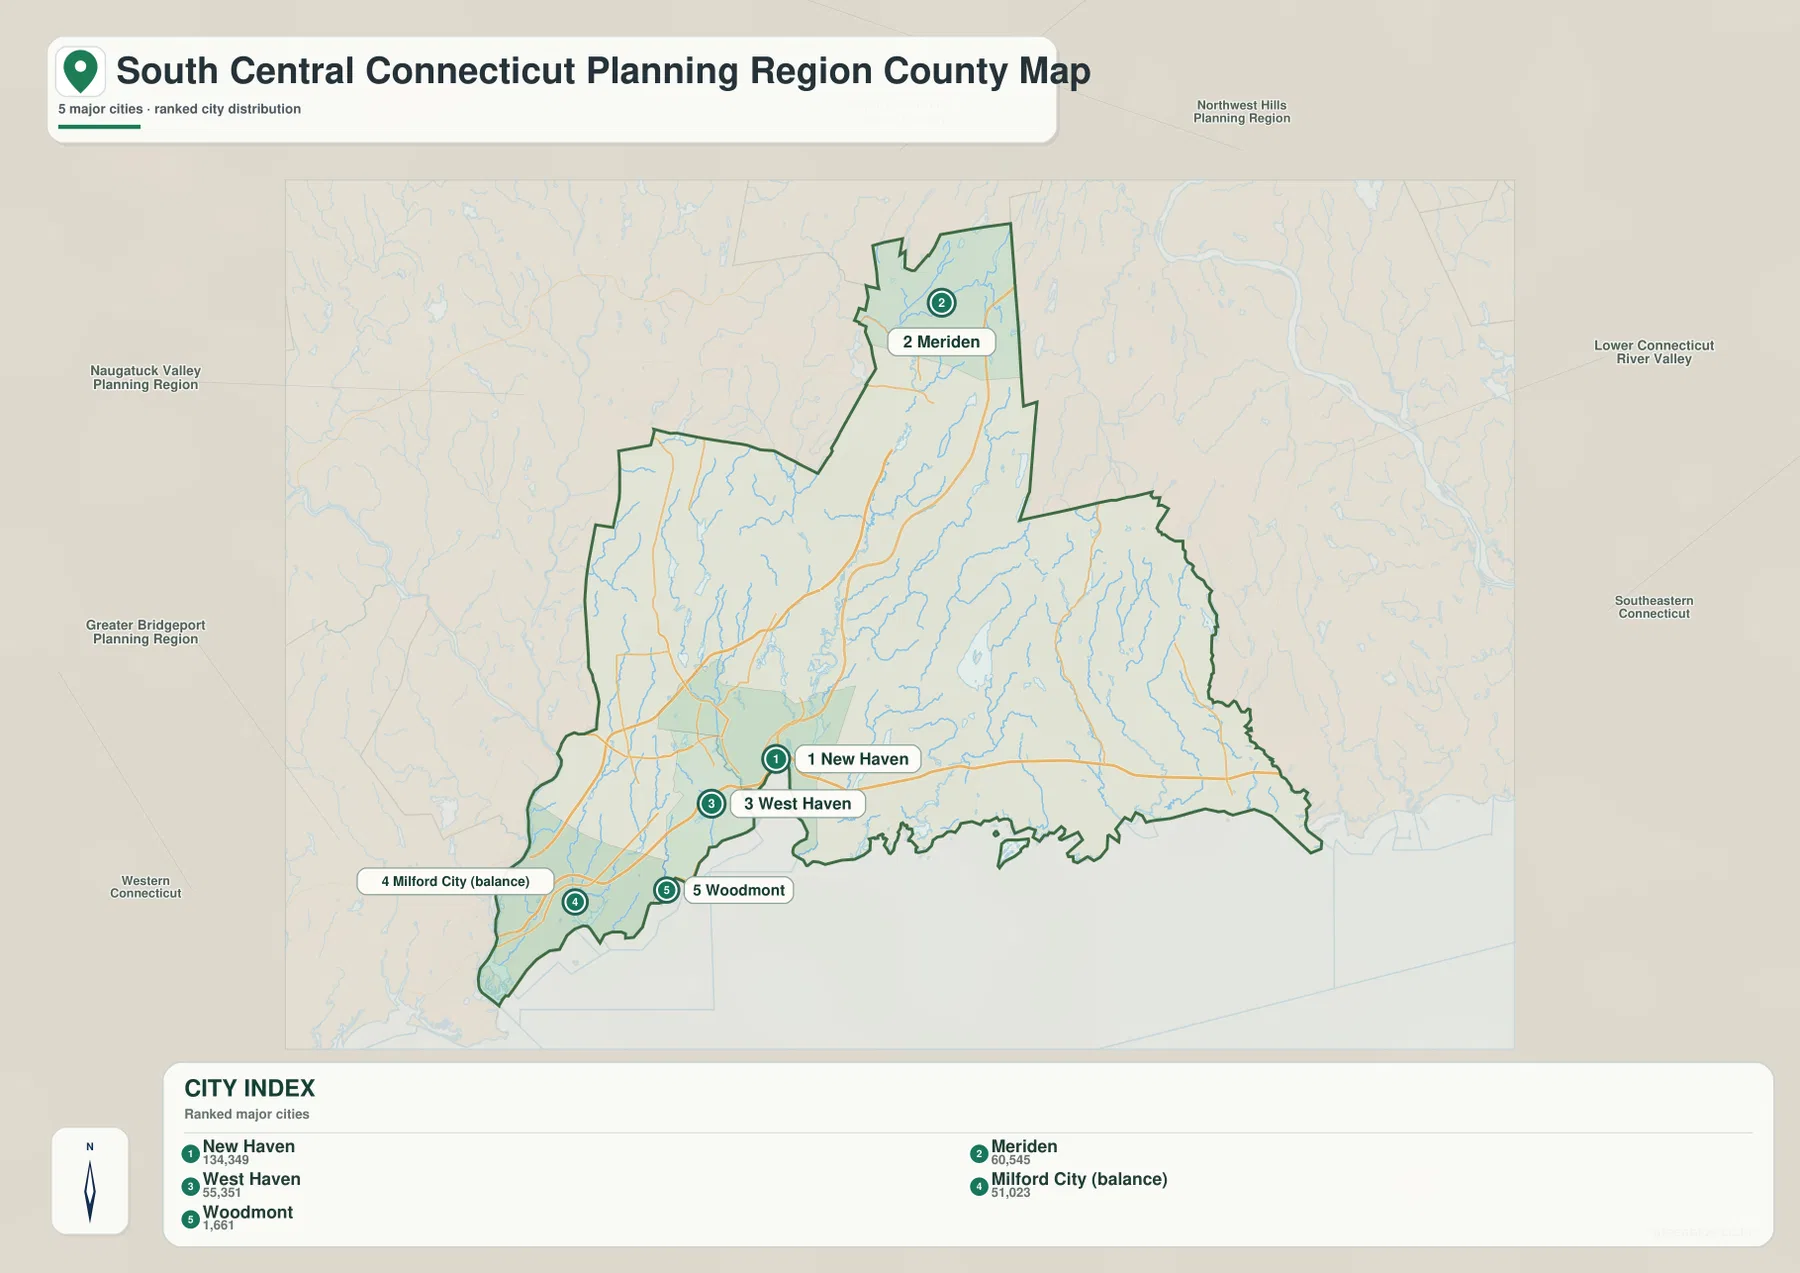
The placement of those five points is more revealing than the numbers alone. New Haven and West Haven are close together along the central coast. Milford City (balance) and Woodmont continue the sequence southwestward. Meriden is the outlier, well to the north at the end of the inland extension. That layout captures the region’s two strongest settlement patterns: a cluster along the shoreline and a separate northern center connected through the Wallingford corridor.
New Haven’s top rank also matches the road map’s structure. It sits where the two most obvious highway directions meet, with I-95 crossing the coast and I-91 turning north. East Haven and Branford Center are visible on the general map but do not appear as ranked points in the city index. This is a reminder that the city-index layer is selective; it is not a complete list of every municipality, neighborhood, or settlement inside the boundary.
The label “Milford City (balance)” should be read exactly as it appears on the supplied map. This article does not replace that wording with another administrative category because the package does not provide a separate definition. Woodmont likewise appears with a much smaller printed value, but the ranking should not be expanded into a broader statement about economic importance, administrative role, or quality of life. The map is comparing selected population-center values and locations, not every dimension of the communities.
Planning-region names around the outside of the boundary add statewide context. Naugatuck Valley, Greater Bridgeport, Western Connecticut, Northwest Hills, Lower Connecticut River Valley, and Southeastern Connecticut are printed beyond the subject region. Those labels make it easier to see where South Central sits between the Bridgeport side of the state and the lower Connecticut River area, while the Meriden extension reaches toward the interior. They are context labels, not member places within South Central.
Short coastal rivers descend toward Long Island Sound while the Quinnipiac reaches far inland
The terrain-and-water map is dominated by the Long Island Sound shoreline and a series of rivers flowing south toward it. From west to east, named features include the Wepawaug River, West River, Quinnipiac River, Farm River, Branford River, East River, Neck River, and Hammonasset River. Shaded terrain sits behind the blue water network, making it easier to see the low valleys that guide the streams from the interior to the coast.
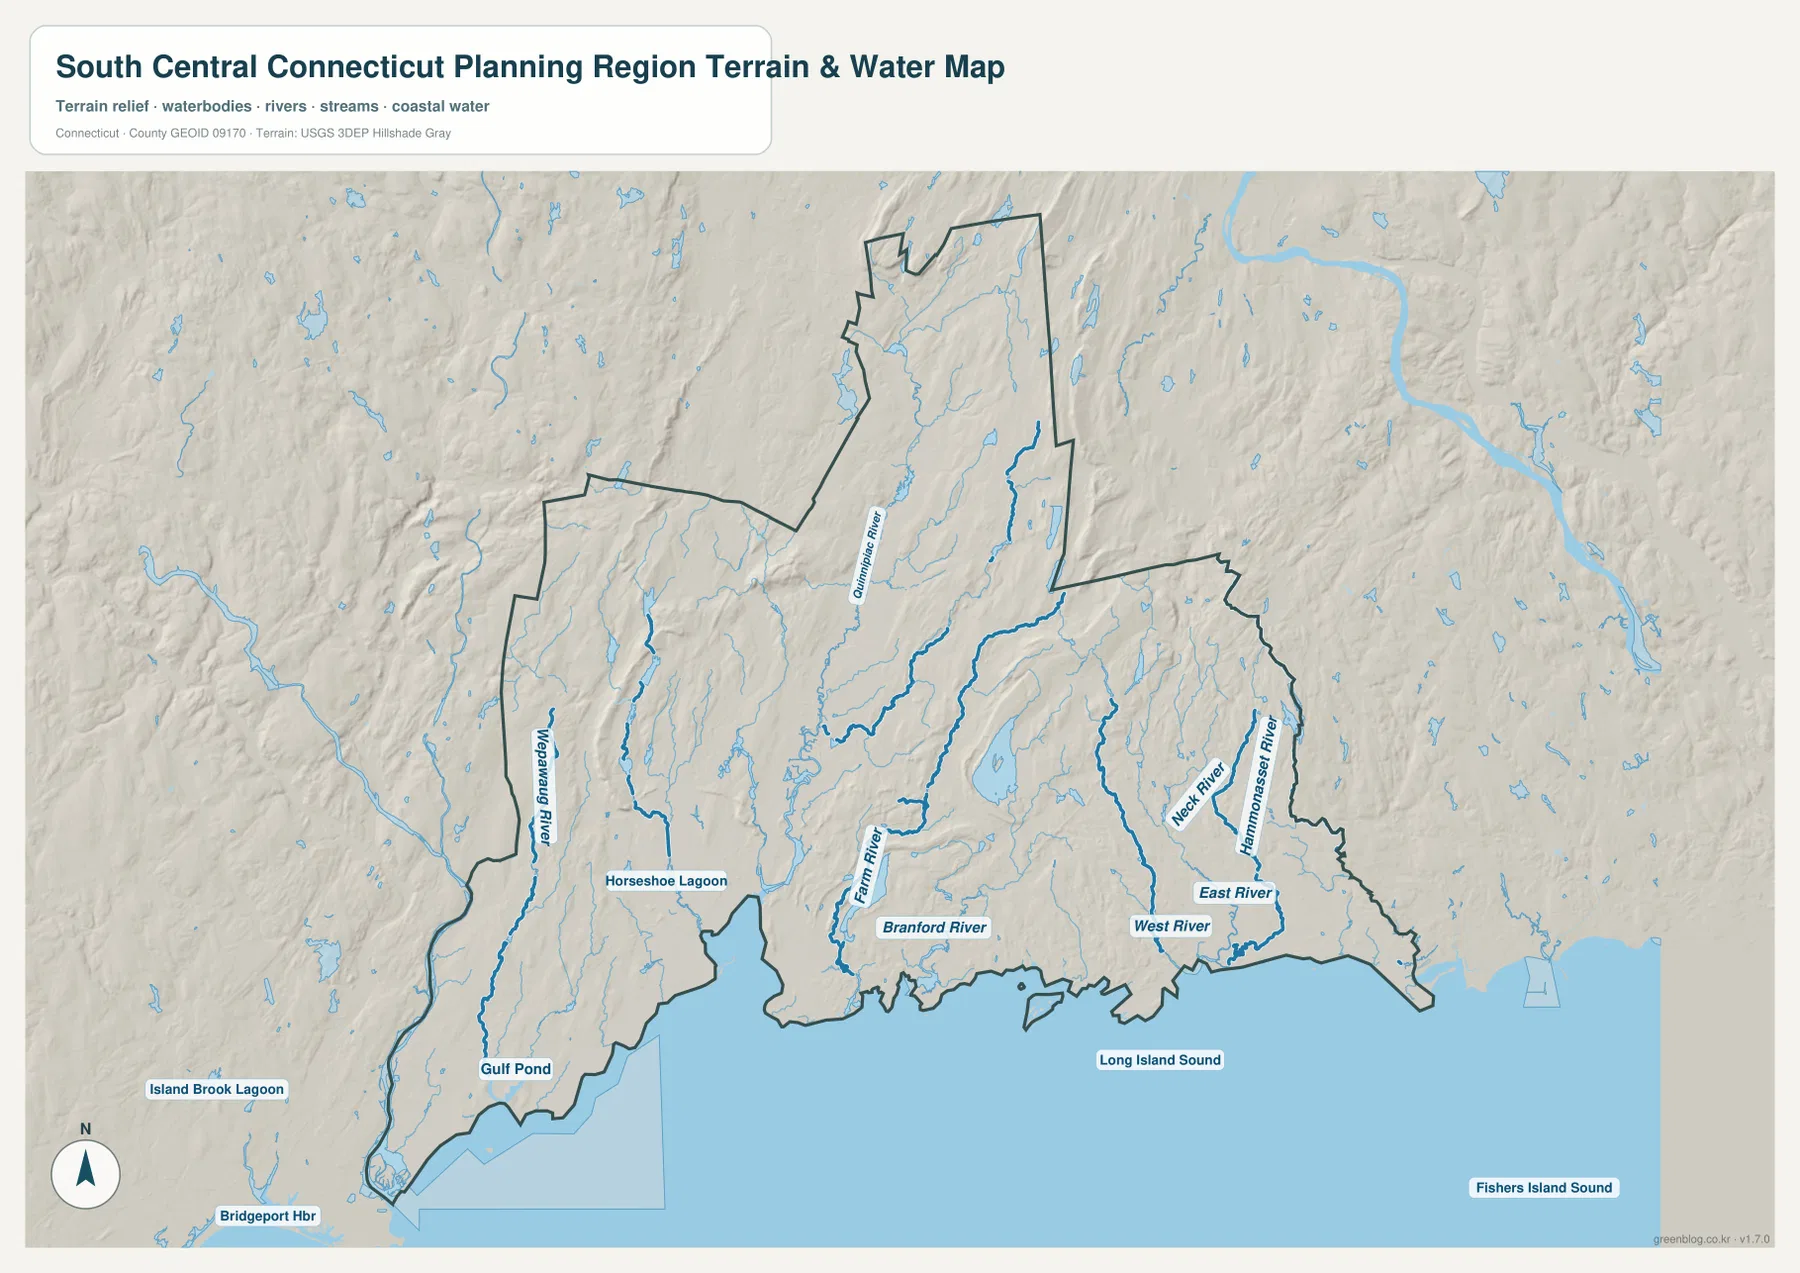
On the western side, the Wepawaug River runs toward the coast, and Horseshoe Lagoon and Gulf Pond are labeled nearby. Island Brook Lagoon and Bridgeport Hbr appear farther west beyond the planning-region boundary, so they are best used as outside orientation references. The shoreline itself is irregular, with inlets and projecting land rather than a straight edge. That detail helps explain why the western coastal towns occupy a more complex physical setting than a simple line along the Sound.
Around New Haven, the West River and Quinnipiac River approach the coast from different inland directions. The Quinnipiac is especially important for understanding the north-south shape of the region because it extends well into the interior. Comparing the road and water maps shows I-91 and the Quinnipiac passing through the same broad corridor without following the same line. That relationship helps connect the New Haven coast with the North Haven and Wallingford side of the map without suggesting that the river itself is a highway boundary.
East of New Haven, the Farm River and Branford River reach the coast relatively close to each other. Farther east, the East River and Neck River drain through the central-eastern section, while the Hammonasset River is clearly labeled near the region’s eastern edge. Returning to the road map adds the settlement context: Branford Center, Guilford Center, and Madison Center occupy the same general coastal band crossed by those shorter rivers.
The shaded relief indicates rolling terrain behind the coast rather than an entirely flat coastal plain. The effect becomes more noticeable inland, where streams cut through low ridges and valleys. This is enough to understand broad terrain differences, but it is not a survey-grade elevation surface. Exact elevations, slopes, and engineering measurements require authoritative elevation products such as the USGS 3D Elevation Program.
The water map is also not a flood-insurance, navigation, shoreline-rights, or parcel-boundary product. Its blue lines and areas show the general location of rivers, streams, ponds, lagoons, and coastal water. Flood probability, water depth, legal shoreline limits, and navigational conditions are outside the scope of this image and should be checked through the appropriate current government sources.
Reading the coast first and the Meriden extension second makes the region easier to understand
The three maps work best when the coast and inland extension are treated as two connected parts of one planning region. Along the south, New Haven, West Haven, Milford, Woodmont, East Haven, Branford, Guilford, and Madison form a broad coastal band. North Haven and Wallingford narrow that shape into a corridor, and Meriden sits at the top. The water map reinforces the same arrangement by showing several short coastal rivers and the longer Quinnipiac River extending far inland.
For general orientation, start with I-95 and I-91 on the boundary map. Use I-95 to place Milford on the west and Madison on the east, then use I-91 to move north through North Haven and Wallingford toward Meriden. The city index can then be used to compare the spacing of New Haven, West Haven, Milford, Woodmont, and Meriden. Finally, the water map explains how the Quinnipiac, West, Branford, and other rivers fit between those road and settlement references.
If the shoreline is the main interest, begin with Long Island Sound instead. Trace the named rivers from the Wepawaug on the west to the Hammonasset on the east, then switch back to the road map to identify the nearest labeled communities. Around New Haven, the most useful comparison is between the West River and Quinnipiac River on the water map and I-95 and I-91 on the road map. That combination gives a clear picture of how the central coast opens into the inland corridor.
The download archive contains the boundary-and-road map, the ranked city-index map, and the terrain-and-water map as three JPG files. Each original is 3638 by 2572 pixels in a landscape layout. Those files retain more detail than the smaller WebP previews, which is helpful when road numbers, city labels, and river names need to remain clear in printed handouts, presentations, or personal reference copies.
Older Connecticut maps may organize the same general area under historic county names rather than planning-region boundaries. Before comparing area, population, or any other statistics, check whether both sources use the same geography and time period. This page follows the South Central Connecticut Planning Region boundary identified in the supplied package, so its outline should not be substituted for a different historical administrative system.
Frequently Asked Questions
Are the five values in the city index current population estimates?
This page does not claim that. The supplied city-index map prints New Haven 134,349, Meriden 60,545, West Haven 55,351, Milford City (balance) 51,023, and Woodmont 1,661, but it does not show the statistical year for those figures. They are therefore described here as the values used by the supplied map. Check an official Census source when a current population estimate is required.
Why are Long Island Sound and Meriden both part of the same map?
Because the supplied South Central Connecticut Planning Region boundary extends from the shoreline northward through North Haven and Wallingford to Meriden. The general map shows I-91 running through that inland corridor, while the city index places Meriden well north of the four coastal or near-coastal ranked points. That long north-south shape is one of the region’s clearest geographic features.
Can the water map be used for flood risk or exact shoreline boundaries?
No. The water map is a regional reference showing the general locations of the Quinnipiac River, West River, Branford River, Hammonasset River, Long Island Sound, and other mapped waters. It does not establish flood probability, water depth, navigation conditions, parcel lines, or legal shoreline limits. Those decisions require current authoritative government or survey sources.
Sources and reference material
- U.S. Census Bureau TIGER/Line Shapefiles: boundary and geographic reference data.
- USGS National Hydrography: official river, stream, and water reference data.
- USGS 3D Elevation Program: authoritative elevation resources when precise height information is needed.
Map File Information
Download the South Central Connecticut Planning Region boundary-and-road map, ranked city-index map, and terrain-and-water map as three high-resolution JPG files in one ZIP archive.
- Included Files: 3 maps
- File Type: JPG files in a ZIP archive
Related Maps
Green Map creates custom-edited map images using open geographic data sources such as geoBoundaries, Natural Earth, OpenStreetMap, and government open data.
These maps are edited visual materials, not raw data files, and are provided for education, documents, presentations, and graphic reference.