Northeastern Connecticut Planning Region covers a broad inland section of the state where small towns, river valleys, and a few stronger road corridors are spread across a large outline. This page uses three supplied maps to make that geography easier to follow: a boundary-and-road map, a city-index map centered on Danielson, and a terrain-and-water map. The WebP images are intended for quick viewing in the article, while the download box later on the page provides the matching high-resolution JPG files for printing, classroom work, presentations, or closer inspection.
The official name deserves a short explanation because Connecticut no longer uses its historic counties as the primary county-equivalent geography in current federal statistical products. The U.S. Census Bureau recognizes the state’s planning regions as county equivalents, and the supplied identity file assigns Northeastern Connecticut Planning Region state FIPS 09 and county-equivalent FIPS 150. NECCOG, the regional council of governments, serves sixteen member towns: Ashford, Brooklyn, Canterbury, Chaplin, Eastford, Hampton, Killingly, Plainfield, Pomfret, Putnam, Scotland, Sterling, Thompson, Union, Voluntown, and Woodstock.
On the map, the region is widest across much of its northern half and becomes more irregular farther south. Putnam and the I-395 corridor stand out on the eastern side, Danielson sits farther south near the center-east, and Plainfield Village, Wauregan, and Moosup continue toward the lower part of the region. The west has fewer large settlement labels and a denser spread of small roads and streams. That contrast is one of the most useful things to notice before looking at individual route numbers or water names.
Table of Contents
I-395 ties Putnam, Danielson, and Plainfield into the clearest road corridor
The general boundary map gives the eastern side of the planning region the strongest visual road structure. I-395 runs north-south near Putnam, Danielson, Wauregan, Moosup, and Plainfield Village, creating an easy reference line for reading the rest of the map. Route 12 follows the same broad side of the region and helps connect several of those communities. Quinebaug Valley Community College is labeled near Danielson, giving another recognizable point in the middle of the eastern corridor.
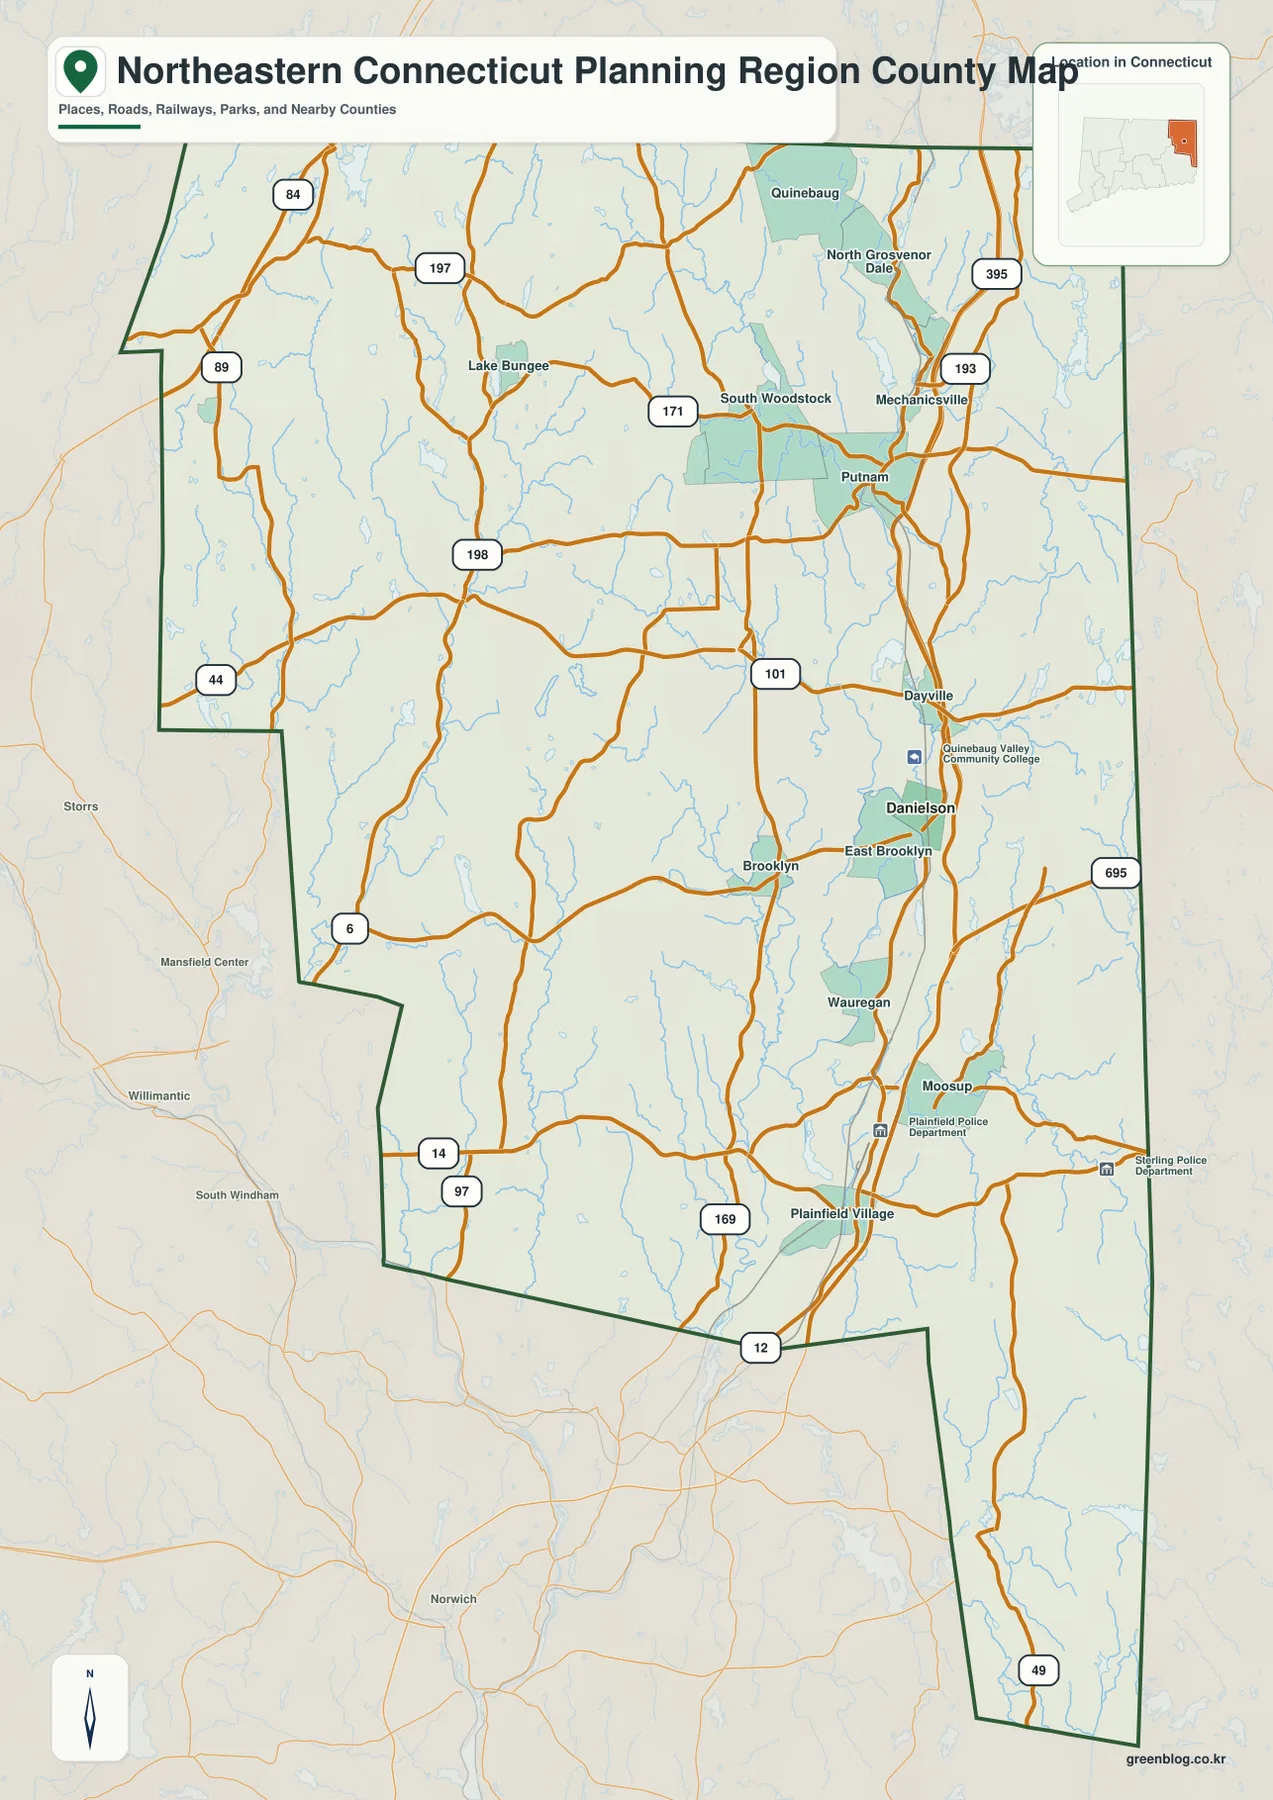
Around Putnam, Routes 44 and 171 provide important east-west references, while roads such as 193, 197, and 198 branch through the northern section around Thompson and Woodstock. South Woodstock, Lake Bungee, North Grosvenor Dale, Mechanicville, and Quinebaug are all visible in this part of the map. Rather than trying to memorize every numbered route, it is more useful to treat I-395 as the main vertical guide and then watch how the smaller roads fan westward into the broader rural interior.
The pattern changes south of Danielson. East Brooklyn and Brooklyn appear to the west, while Wauregan and Moosup remain closer to the eastern road corridor. Plainfield Village sits near several routes in the lower section, including roads labeled 14, 97, and 169. The map also shows Route 49 near the southeastern edge. These places are separated by enough distance that the region does not read as one continuous city. Instead, it looks like a chain of town centers and villages connected by state roads and the interstate.
The north has its own cluster of named places. Putnam is a strong orientation point, but North Grosvenor Dale, Mechanicville, South Woodstock, Lake Bungee, and Quinebaug help show how the settlement pattern extends across the upper half of the boundary. The west and northwest show fewer prominent town labels, so roads, streams, and the shape of the boundary become more important there. That difference fits the character of a planning region that combines multiple municipalities rather than a single dominant city government.
Several labels outside the dark boundary provide regional context. Storrs, Mansfield Center, Willimantic, and South Windham appear to the west or southwest, helping readers understand where the planning region sits within eastern Connecticut. Those outside labels should not be mistaken for member communities. The same caution applies to legal use: this map is intended for general location and regional comparison, not parcel ownership, zoning, property-line determination, or other land-record decisions.
Danielson is the only ranked place in the supplied city index
The city-index map is intentionally much simpler than the boundary map. It highlights Danielson as the only ranked place and prints the value 4,209 beside the label. Because no other city markers are included in this supplied index, the page should not turn it into a full population ranking for the planning region. Its real strength is positional: Danielson provides one clear point from which to judge the size and shape of the entire region.
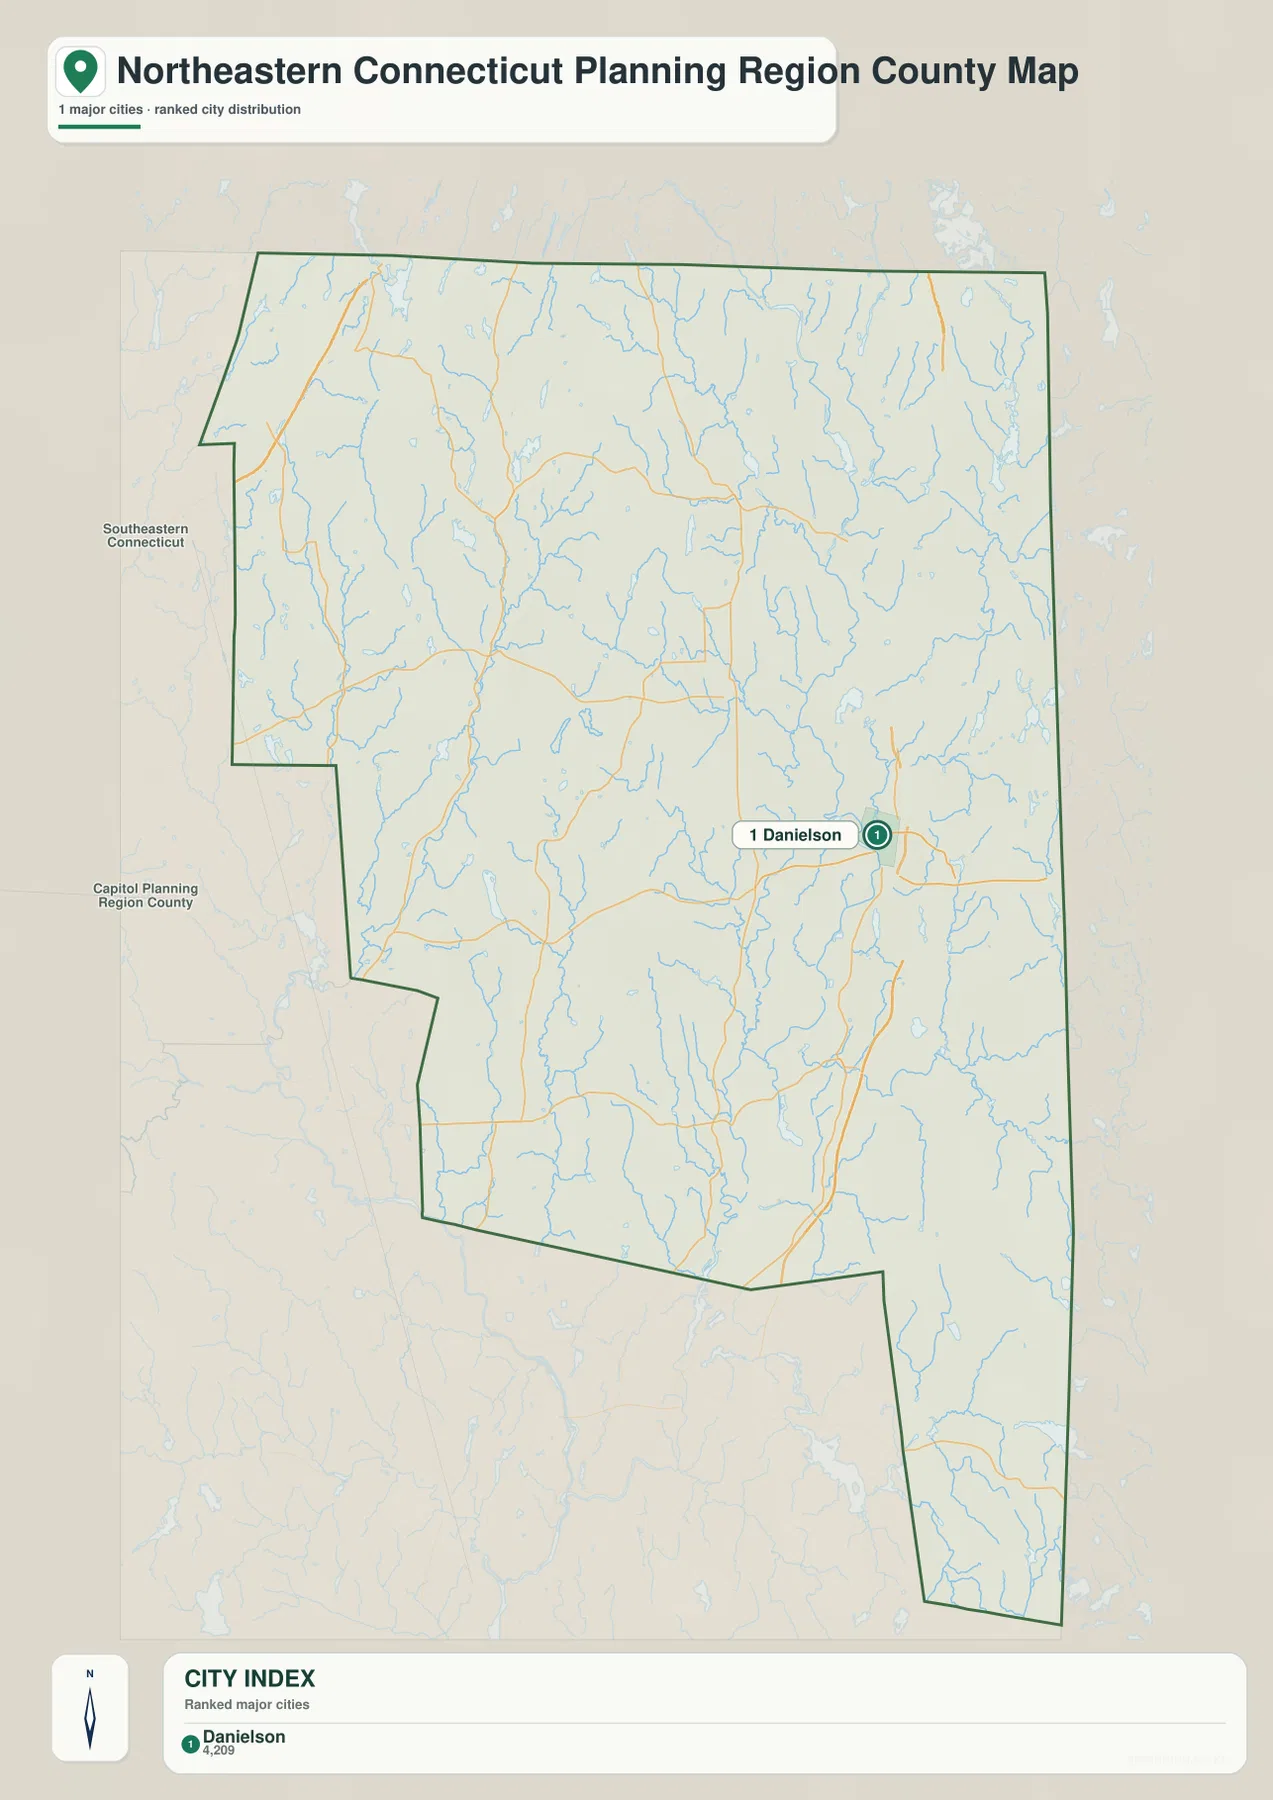
Danielson lies east of the geographic middle, close to the north-south transportation corridor seen on the general map. Putnam is farther north, while Wauregan, Moosup, and Plainfield Village extend southward. Brooklyn and East Brooklyn sit to the west. When the two maps are viewed together, Danielson becomes a useful hinge between the northern Putnam area and the lower Plainfield side of the region, even though it is not meant to represent every municipality or settlement.
The city-index map also shows neighboring planning-region labels around the outside of the boundary, including Southeastern Connecticut and the Capitol area. Those labels help place the region in a statewide frame without adding a large number of town names. The dark outline remains the important reference. A place printed outside that outline is there for orientation and should not automatically be treated as part of Northeastern Connecticut Planning Region.
This simplified map is especially useful after the more detailed boundary map has become visually crowded. A reader can first learn the road network, then return to the city index and ask one straightforward question: where is Danielson inside the overall shape? From there, Putnam can be placed to the north and Plainfield to the south using the road map. That sequence is often easier for students and casual map users than starting with a long list of sixteen member towns.
The distinction between the NECCOG membership list and the city index is important. NECCOG identifies sixteen member towns, while the supplied city map happens to rank only Danielson. Those are different kinds of information. The first describes the municipalities that make up the regional organization; the second is a visual index created for this map set. Keeping those roles separate avoids the misleading impression that Danielson is the only meaningful settlement in the region.
The Quinebaug River and West Thompson Lake organize the water map
The terrain-and-water map shifts attention away from roads and toward the valleys that shape the region. The Quinebaug River is the most prominent watercourse on the eastern side, passing through the West Thompson Lake area and continuing south toward Putnam, Danielson, and the lower part of the planning region. Shaded relief shows a rolling landscape rather than a flat plain, with smaller streams dropping through ridges and low valleys toward the larger rivers.
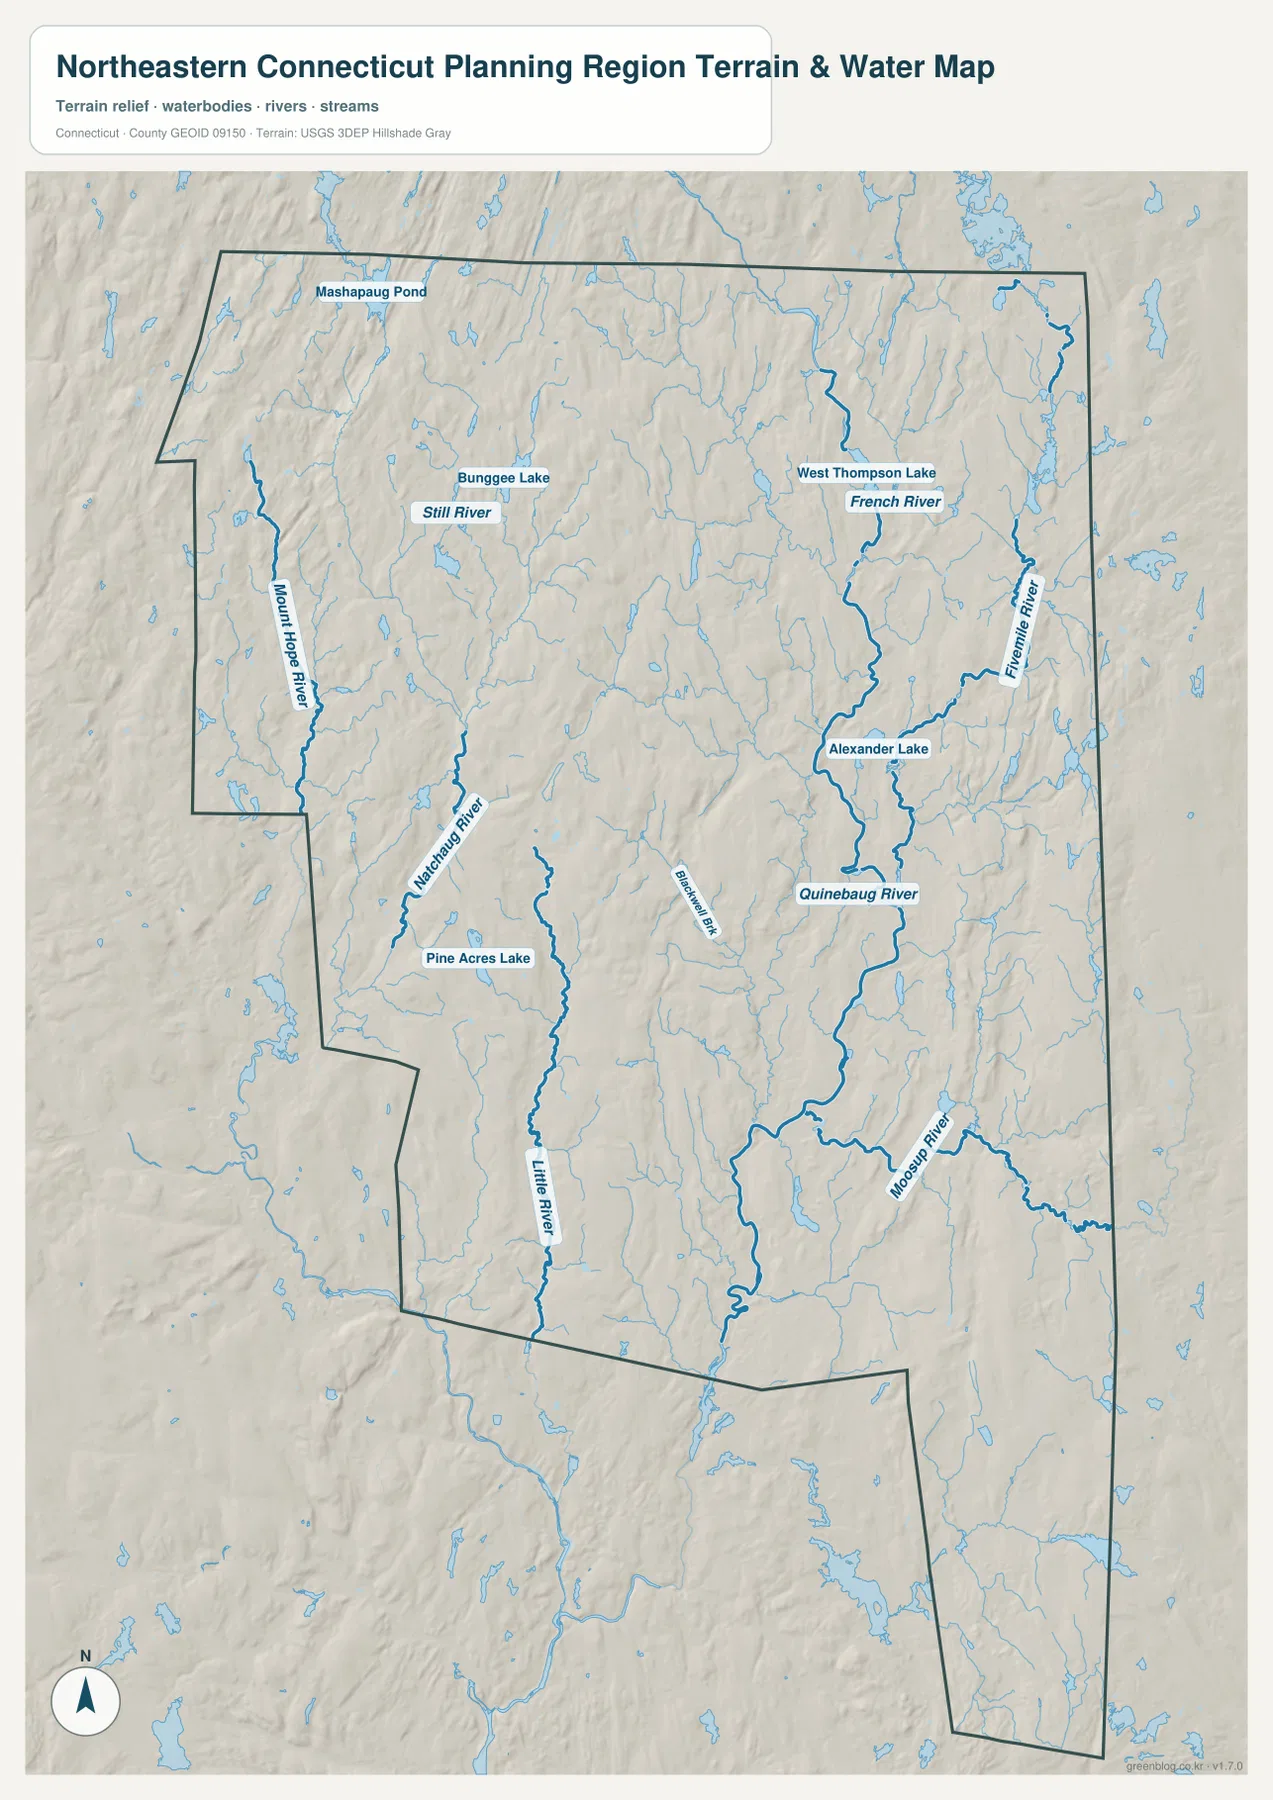
West Thompson Lake is one of the easiest water features to identify in the northeast. The U.S. Army Corps of Engineers describes it as a reservoir on the Quinebaug River north of Putnam, and its official recreation page also discusses the Quinebaug River Water Trail. On the supplied map, the French River appears near the lake area, while the Five Mile River runs farther east. Alexander Lake is labeled close to the Quinebaug system as well. Together, these features show that the northeastern corner contains several connected water bodies rather than a single isolated river.
The western half has a different set of named waterways. The Natchaug River and Mount Hope River are prominent, Mashapaug Pond appears near the northwest, and Bungee Lake lies farther east in the northern interior. The Still River is labeled near that area, and Pine Acres Lake appears closer to the Natchaug River. These features are easy to overlook on the road map because settlement labels and highways take priority there. On the water map they become central, revealing how broadly the drainage network extends away from the I-395 corridor.
Farther south, the Moosup River approaches the Quinebaug system from the east, while the Little River runs through the central-southern part of the map. Smaller names such as Blackwell Brook are also visible. The streams do not form a simple set of parallel lines; they bend through the rolling terrain and join larger channels at different points. That helps explain why local roads often curve and why settlement patterns follow valleys rather than a strict grid.
This water layer is a regional reference map, not a flood-insurance, navigation, water-depth, or property-boundary product. A blue line confirms the mapped presence and general course of a river or stream, but it does not show flood probability or legal riparian limits. Flood-risk questions require current FEMA or state and local sources. Likewise, anyone who needs exact elevation for engineering, construction, or a parcel should use authoritative elevation data rather than estimating height from shaded relief.
The relief background is most useful for understanding broad terrain. It makes the numerous low ridges and valleys visible and gives the rivers a physical setting that a plain boundary map cannot provide. The western and northern sections often appear more broken and stream-rich, while the eastern Quinebaug corridor offers a clearer continuous reference. That does not mean every river valley is flat or every ridge is high; the map is generalized for regional reading, not a contour survey.
Using all three maps reveals a region of river valleys, small centers, and broad town landscapes
Taken together, the maps show why Northeastern Connecticut Planning Region cannot be summarized by Putnam or Danielson alone. The eastern side has the strongest road-and-river pairing, with I-395 and the Quinebaug corridor linking several named places. The north spreads across Woodstock, Thompson, Union, and nearby lake country. The west is less dominated by large settlement labels and shows more streams and rolling terrain. The south narrows and continues toward Plainfield, Sterling, and Voluntown territory.
For a general orientation task, start with the boundary map and locate I-395, Putnam, and Danielson. Next, use the city index to fix Danielson’s position inside the outline. Finally, switch to the water map to see where the Quinebaug River, West Thompson Lake, Natchaug River, and Moosup River sit relative to those road references. If your interest begins with rivers or outdoor geography, reverse the order and use the road map only after you have identified the watershed features.
The downloadable JPGs are better suited to printing and close viewing than the WebP previews embedded in the article. Each supplied original is 2572 by 3638 pixels, large enough to preserve more detail in road numbers, place labels, and water names when the image is enlarged. They can be useful in lessons, presentations, local-reference handouts, or personal map collections. For driving directions, construction, emergency routing, or real-time road conditions, use a dedicated current navigation or government source instead.
It is also worth checking the date and geography of any outside document before comparing it with this page. Older Connecticut material may be organized around historic counties, while newer federal datasets can use planning regions as county equivalents. The boundary in this package is specifically identified as Northeastern Connecticut Planning Region, FIPS 09150. That context matters when a historical county name and a modern planning-region name seem to describe overlapping parts of the state.
Frequently Asked Questions
Why is Northeastern Connecticut shown as a planning region instead of a traditional county?
Connecticut’s planning regions are used as county-equivalent geography in current U.S. Census Bureau products. Northeastern Connecticut Planning Region therefore appears at the county level in many modern federal datasets even though it is not a conventional county government. The supplied package identifies it with state FIPS 09 and county-equivalent FIPS 150, so this page follows the planning-region boundary rather than a historic county outline.
Why does the city-index map show only Danielson?
That is how the supplied city-index file is structured. Danielson is the only ranked point on that specific map, while the general boundary map contains many other towns and villages such as Putnam, Plainfield Village, Brooklyn, Wauregan, Moosup, and North Grosvenor Dale. The city index should therefore be read as a simplified location aid, not as a complete municipal list or a claim that Danielson is the region’s only important settlement.
Can the terrain-and-water map be used for flood risk or exact elevation?
No. It is designed to show the general positions of rivers, lakes, streams, and broad terrain relief. Flood-risk decisions should rely on current FEMA, state, or local flood mapping, and exact elevation work should use authoritative survey or USGS elevation data. Property boundaries and zoning should also be checked through the relevant town or state records rather than inferred from this regional map.
Sources and reference material
- Northeastern Connecticut Council of Governments (NECCOG): regional organization and member-town information.
- U.S. Census Bureau QuickFacts – Northeastern Connecticut Planning Region: current county-equivalent statistics and regional identification.
- U.S. Census Bureau TIGER/Line Shapefiles: boundary and geographic reference data.
- USGS National Hydrography: official river and stream reference data.
- U.S. Army Corps of Engineers – West Thompson Lake: official information about West Thompson Lake and the Quinebaug River setting.
Map File Information
Download the Northeastern Connecticut Planning Region boundary and road map, Danielson city-index map, and terrain-and-water map as three high-resolution JPG files in one ZIP archive.
- Included Files: 3 maps
- File Type: JPG files in a ZIP archive
Related Maps
Green Map creates custom-edited map images using open geographic data sources such as geoBoundaries, Natural Earth, OpenStreetMap, and government open data.
These maps are edited visual materials, not raw data files, and are provided for education, documents, presentations, and graphic reference.