Naugatuck Valley Planning Region occupies a long, irregular part of west-central Connecticut, with Waterbury near the middle, Bristol toward the northeast, and Naugatuck, Ansonia, Derby, and Shelton extending south through the lower valley. The maps on this page are designed to make that shape easier to understand. They show the planning-region boundary, major roads and population centers, and the river-and-terrain setting that gives the valley its name. The on-page images are lightweight WebP previews, while the download box below provides the matching high-resolution JPG files for printing or closer study.
The name can be confusing if you are expecting one of Connecticut’s historic counties. For federal statistical geography, the U.S. Census Bureau now treats Connecticut’s nine Councils of Governments and planning regions as county-equivalent areas. Naugatuck Valley is therefore mapped at the county level in current Census products even though it is a planning region rather than a conventional county government. The Naugatuck Valley Council of Governments lists nineteen member municipalities, so the boundary brings together several distinct cities and towns rather than one continuous urban area.
Its outline helps explain why a single city name does not describe the whole region. Bristol forms a northeastern extension; Waterbury and Naugatuck occupy the central corridor; the boundary then narrows toward Ansonia, Derby, and Shelton in the south. To the west are broad town areas around Bethlehem, Watertown, and Woodbury, while Cheshire reaches the eastern side. Reading those places together with the highways and rivers provides a much clearer picture than looking at the boundary alone.
Table of Contents
Waterbury anchors the road network inside an unusually shaped boundary
The general county-equivalent map places Waterbury at the region’s most obvious road junction. Route 8 runs north-south through the central valley, while I-84 crosses the Waterbury area from east to west. Other numbered roads branch toward Watertown, Woodbury, Cheshire, Bristol, and the lower valley. This makes the map useful when you want to understand the region as a connected set of towns rather than as a list of municipality names. Waterbury also appears with landmarks such as Naugatuck Valley Community College and Post University, which help orient the central urban area.
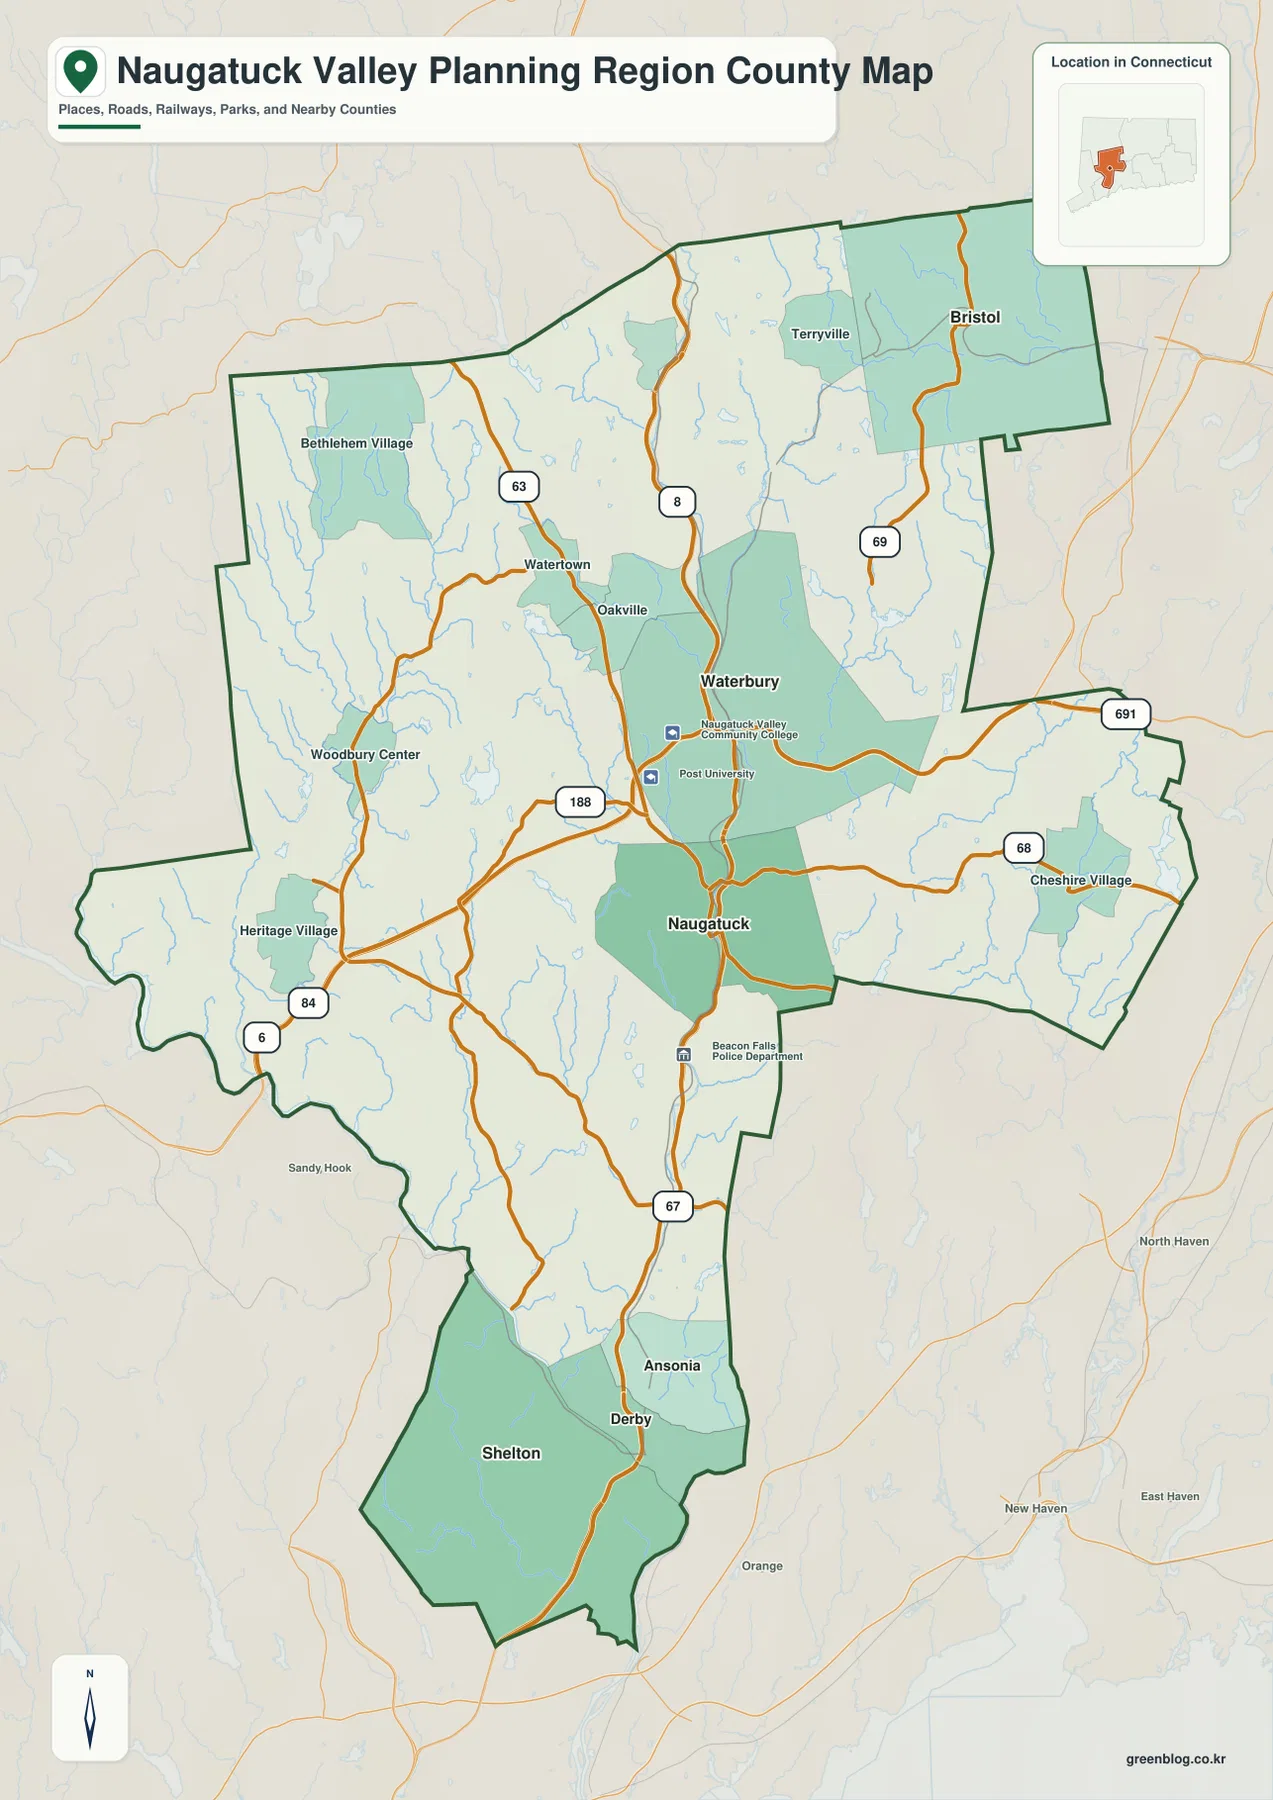
Several route numbers stand out on the map. Route 8 is the clearest north-south line, passing the Waterbury area and continuing through Naugatuck toward the lower valley. I-84 gives Waterbury its strongest east-west connection, while Routes 63, 69, 188, 67, 68, 84, 6, and 691 show how surrounding towns connect to the central corridor. These roads are not presented as a turn-by-turn navigation product. Their value here is to show the relative direction of movement and why some communities that look far apart on the outline still belong to the same regional system.
The western side looks less urban on the map. Bethlehem Village and Woodbury Center are spaced well apart, and the landscape is crossed by many small streams. Watertown and Oakville sit much closer to Waterbury, creating a transition between the central city and the broader western town areas. On the east, Cheshire Village appears beyond Waterbury, while Bristol and Terryville occupy the northeastern extension. The contrast is useful: the Naugatuck Valley Planning Region contains both densely connected city corridors and larger town landscapes where settlements are farther apart.
The southern end changes again. Naugatuck sits immediately below Waterbury, but farther south the region narrows around Ansonia and Derby before widening toward Shelton. The boundary’s irregular form is not an error in the map; it reflects the municipalities that make up the planning region. Nearby communities outside the dark outline are shown faintly for orientation, so it is important to distinguish the planning-region edge from ordinary map background. This map should not be used to determine parcel ownership, zoning, or legal property boundaries.
Six major cities reveal three different population clusters
The city-index map simplifies the region by highlighting six larger cities rather than labeling every member municipality. In the supplied index, Waterbury ranks first, Bristol second, Shelton third, Naugatuck fourth, Ansonia fifth, and Derby sixth. That ranking is most useful as a location guide. It shows one large central city, a separate northern center at Bristol, and a compact lower-valley group around Shelton, Ansonia, and Derby. The pattern immediately explains why the planning region feels more like several connected subareas than a single metropolitan core.
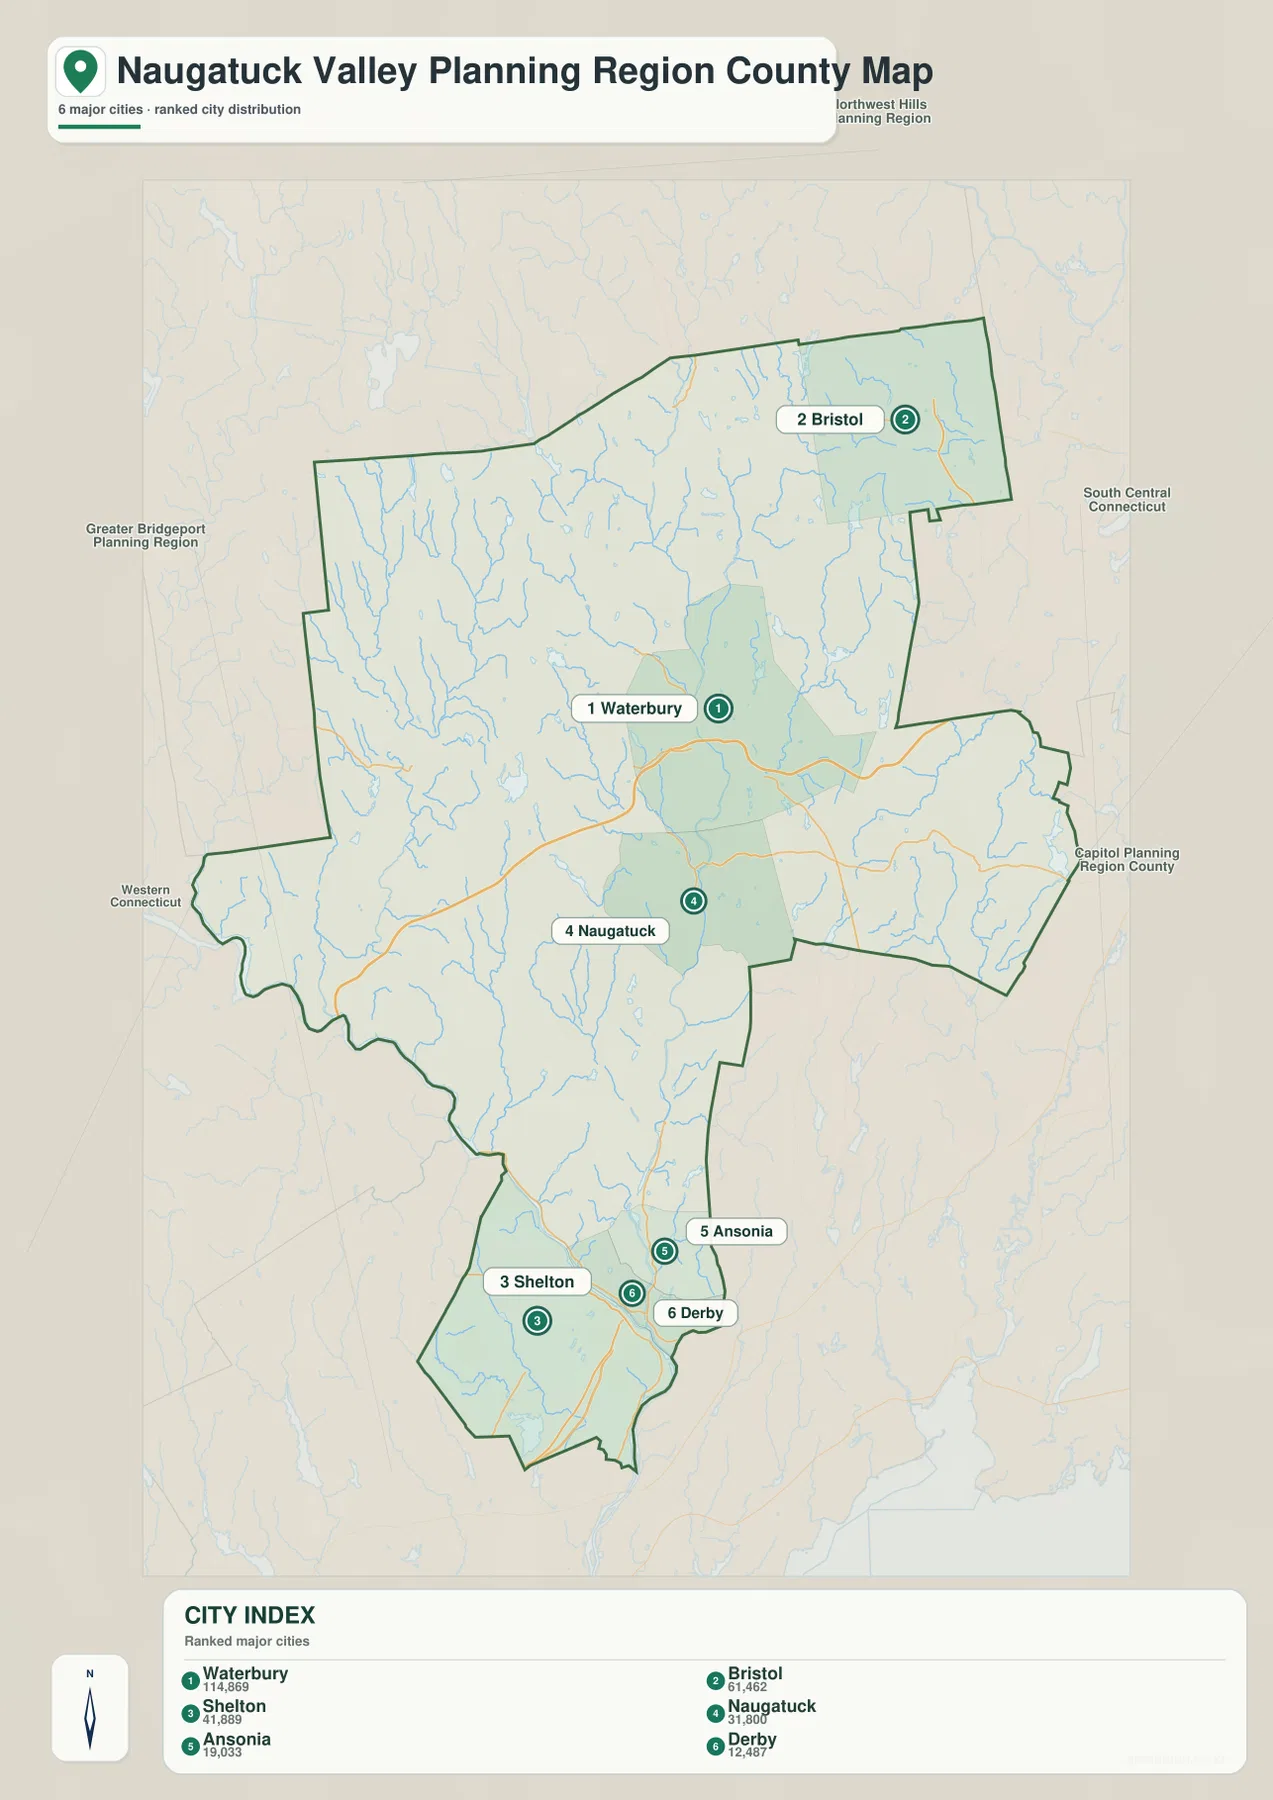
Waterbury is slightly north of the geographic middle and functions as the strongest visual reference point. Naugatuck lies directly to its south, so the two cities line up along the central valley corridor. Bristol is farther northeast and separated by a broad area of smaller towns and streams. At the opposite end, Ansonia and Derby are close together, with Shelton spreading across the southwestern side of the lower valley. These distances on the map are geographic relationships, not travel-time estimates, because road conditions and actual routes may produce very different driving times.
The labels around the outside add another layer of context. Northwest Hills lies to the north and northwest, Western Connecticut to the west, Greater Bridgeport toward the southwest, South Central Connecticut toward the southeast, and the Capitol planning area to the east and northeast. Those neighboring regions help explain the different outward connections of the Naugatuck Valley. Shelton and Derby are close to the Bridgeport and New Haven directions, Bristol is oriented more toward central Connecticut, and Waterbury stands between those ends.
It is also important not to treat the six numbered cities as the full membership of the region. NVCOG identifies nineteen municipalities: Ansonia, Beacon Falls, Bethlehem, Bristol, Cheshire, Derby, Middlebury, Naugatuck, Oxford, Plymouth, Prospect, Seymour, Shelton, Southbury, Thomaston, Waterbury, Watertown, Wolcott, and Woodbury. Several of those towns are visually important on the boundary and water maps even though they are not part of the six-city ranking. The city index is therefore a quick population-center view, not a complete municipal reference map.
The Naugatuck River links the central valley while smaller watersheds spread into the hills
The terrain-and-water map explains the physical setting behind the settlement pattern. The Naugatuck River runs through the central portion of the planning region and continues south, while numerous tributaries descend from the surrounding hills. Shaded relief shows that much of the region is rolling rather than flat. The river valley provides a lower corridor through the middle, but the western and eastern sides rise into a more broken landscape of ridges, small valleys, ponds, and reservoirs.
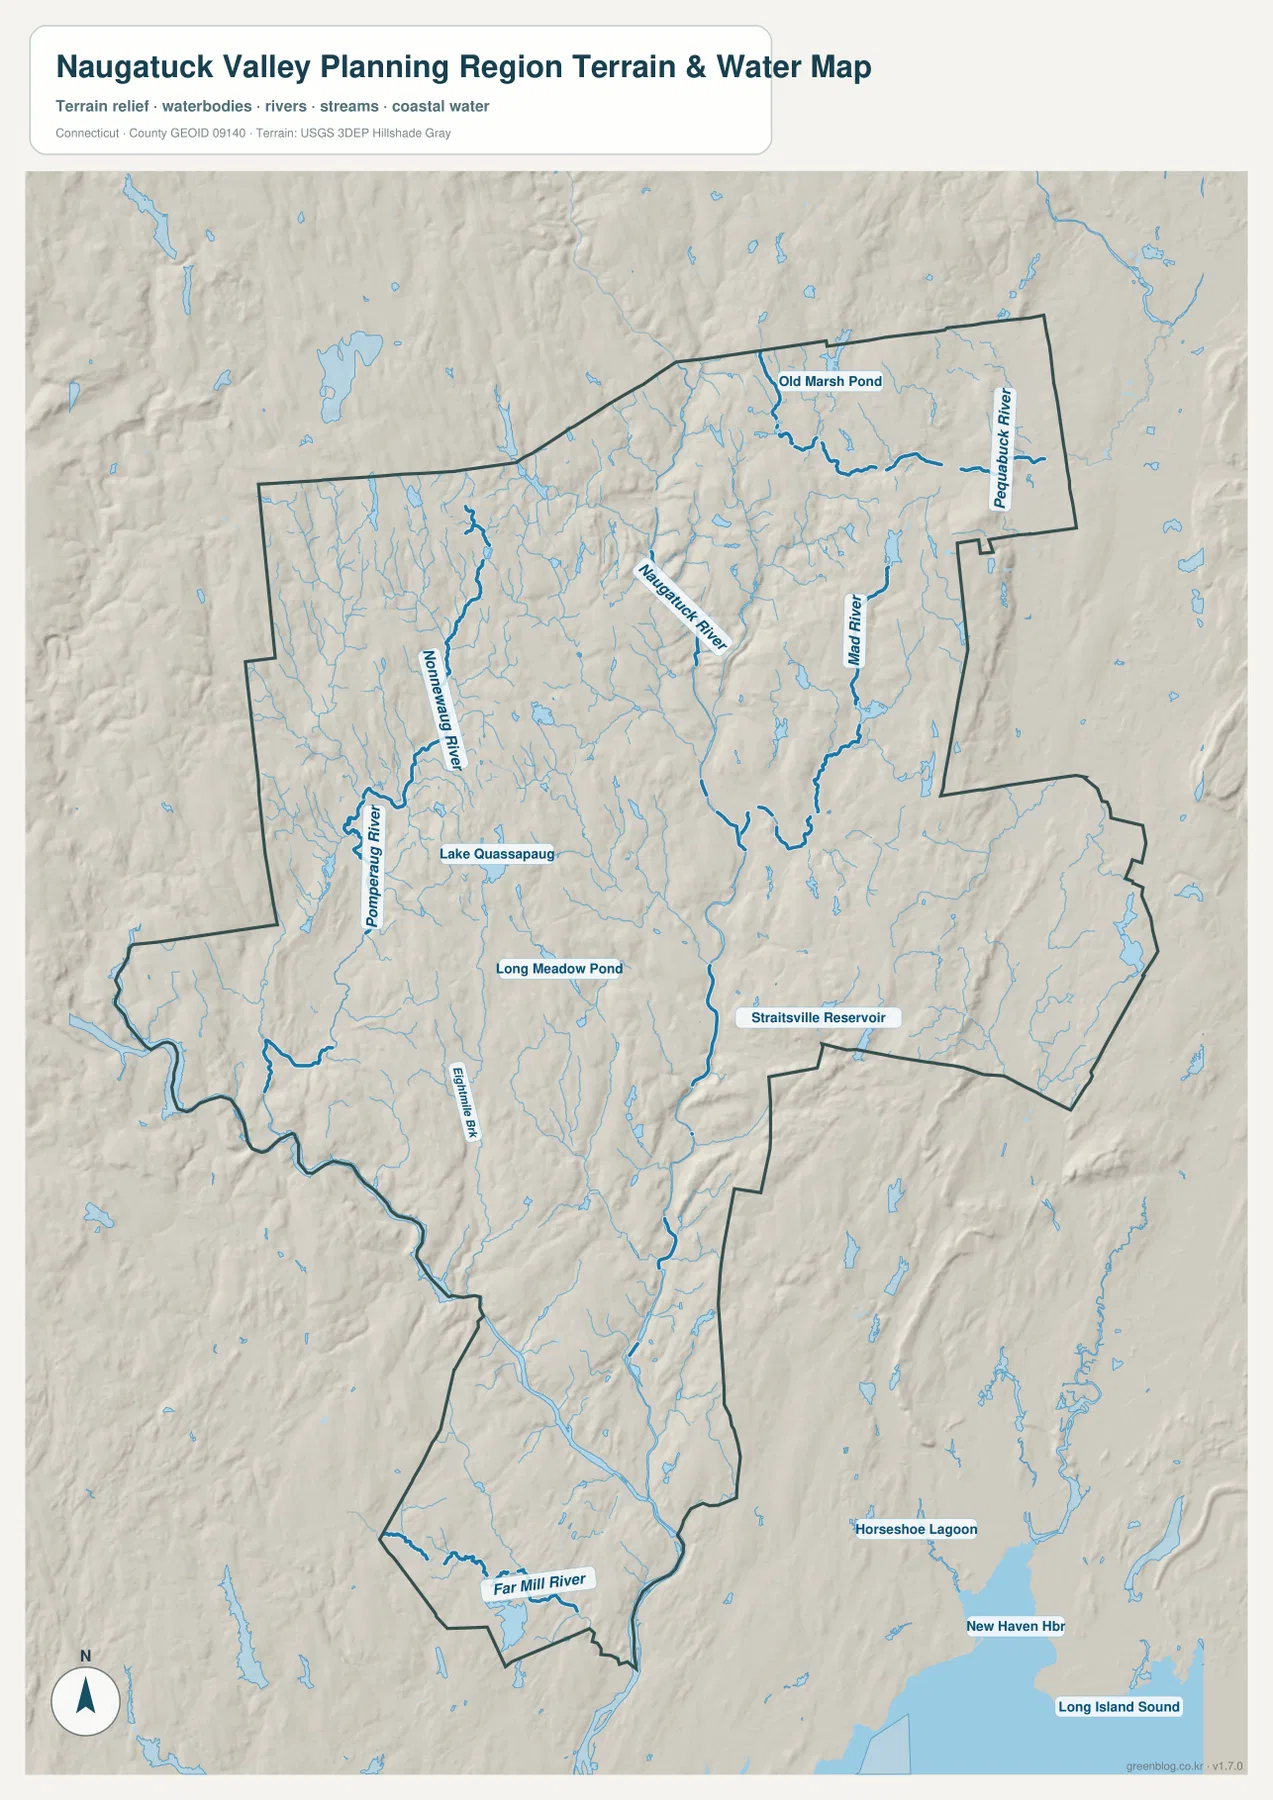
Several named waterways help separate the region into local drainage areas. The Pequabuck River and Old Marsh Pond appear near the Bristol side. The Mad River occupies the east-central area, while the Nonewaug River and Pomperaug River are visible across the west. Lake Quassapaug and Long Meadow Pond sit among the western hills, and Straitsville Reservoir appears farther east of the central valley. Farther south, Eastman Brook and the Far Mill River are labeled near the lower end of the planning region. Together, these features show why the landscape cannot be reduced to the Naugatuck River alone.
The water map also includes outside reference features near the bottom right, including New Haven Harbor and Long Island Sound. Those labels do not mean the planning region reaches the coast. They are there to show where the southern end sits in relation to Connecticut’s shoreline. Horseshoe Lagoon is likewise outside the main boundary. Keeping the dark regional outline in view prevents a common mistake: assuming every named water feature on the page belongs to Naugatuck Valley itself.
Shaded relief is helpful for recognizing broad changes in terrain, but it should not be treated as survey-grade elevation information. The map shows hill-and-valley form at a regional scale, not exact ground height for a parcel, construction site, or engineering project. For precise elevation work, the USGS 3D Elevation Program or another authoritative elevation dataset is a better source. Here, the relief is meant to help explain why rivers follow certain corridors and why roads and settlements often occupy lower, more connected parts of the landscape.
Choosing the right file depends on what you want to compare
If your goal is to locate municipalities and trace major travel corridors, start with the boundary-and-road image. It contains the most labels for roads, towns, and nearby places. If you want a quicker sense of where the largest urban centers are concentrated, the city-index image removes much of that detail and puts the six highlighted cities in the foreground. For rivers, ponds, reservoirs, and the shape of the surrounding hills, the terrain-and-water image is the better starting point. Using all three together gives a more complete regional view without forcing one map to carry every kind of information.
The JPG files in the download archive are 2572 by 3638 pixels each, providing more detail than the scaled previews used in the article. That makes them better suited to A3-format printing, classroom handouts, presentations, and personal reference. If you only need to check a city or river name, the WebP preview may be enough. If you need sharper text or want to crop part of the region for a project, use the original JPG instead of saving the smaller browser image.
These maps are general reference products. Road alignments, labels, and other features can change, and the images do not replace current navigation, flood-hazard, zoning, parcel, or emergency-management information. For a trip, verify the latest route with a navigation service. For legal or property questions, use the relevant municipal records. For statistical boundaries, the Census Bureau’s current TIGER/Line products are the appropriate reference. That distinction keeps the downloadable maps useful without asking them to serve purposes for which they were not designed.
Frequently Asked Questions
Why is Naugatuck Valley shown as a county-equivalent planning region?
The U.S. Census Bureau adopted Connecticut’s nine Councils of Governments and planning regions as county-equivalent geographic units for statistical purposes. That change means current Census datasets can list Naugatuck Valley Planning Region in the same geographic level where other states usually show counties. It is still a planning region made up of member municipalities, so the term should not be interpreted as a conventional county government.
How are Waterbury, Naugatuck, Ansonia, Derby, and Shelton arranged on the map?
Waterbury is the main central city. Naugatuck lies directly south of it along the valley, and Ansonia and Derby form a close pair farther south. Shelton occupies a broader area to their west and southwest. Looking at Route 8 and the Naugatuck River together makes the north-south relationship especially clear, although the communities are separate centers rather than one continuous city.
Can the terrain-and-water map be used for flood risk or property-boundary decisions?
No. It is a regional reference map for rivers, streams, ponds, reservoirs, and broad terrain. Flood risk requires current FEMA and local flood information, while parcel boundaries and ownership should be checked with the relevant municipal GIS or land records. The map is best used to understand how the Naugatuck River and surrounding watersheds fit into the shape of the planning region.
Map File Information
Download the Naugatuck Valley Planning Region boundary-and-roads map, major-city map, and terrain-and-water map together as high-resolution JPG files in one ZIP archive.
- Included Files: Use only the versions confirmed in the article and supplied images
- File Type: Use the confirmed download contents
- Intended Use: Printing, education, presentations, and map-based projects
Related Maps
Sources and references
- Naugatuck Valley Council of Governments – Our Towns for the planning region’s nineteen member municipalities.
- U.S. Census Bureau – Change to County-Equivalents in Connecticut for the county-equivalent geography change.
- U.S. Census Bureau – TIGER/Line Shapefiles for current boundary and geographic reference data.
- USGS National Hydrography for river and stream reference data.
Green Map creates custom-edited map images using open geographic data sources such as geoBoundaries, Natural Earth, OpenStreetMap, and government open data.
These maps are edited visual materials, not raw data files, and are provided for education, documents, presentations, and graphic reference.