A country can have a high urban share without having fast urban population growth, and the reverse can also be true. World Bank indicator SP.URB.GROW measures the annual rate of change in the population classified as urban. The verified dataset supplied for this article contains 217 countries and separately reported economies, and every retained observation is dated 2025. The median country/economy rate is 1.26% and the simple unweighted mean is 1.52%. Urban population growth is positive in 184 observations and negative in 33. The unweighted mean describes the distribution of country rows; it is not the population-weighted growth rate of the world’s urban population.
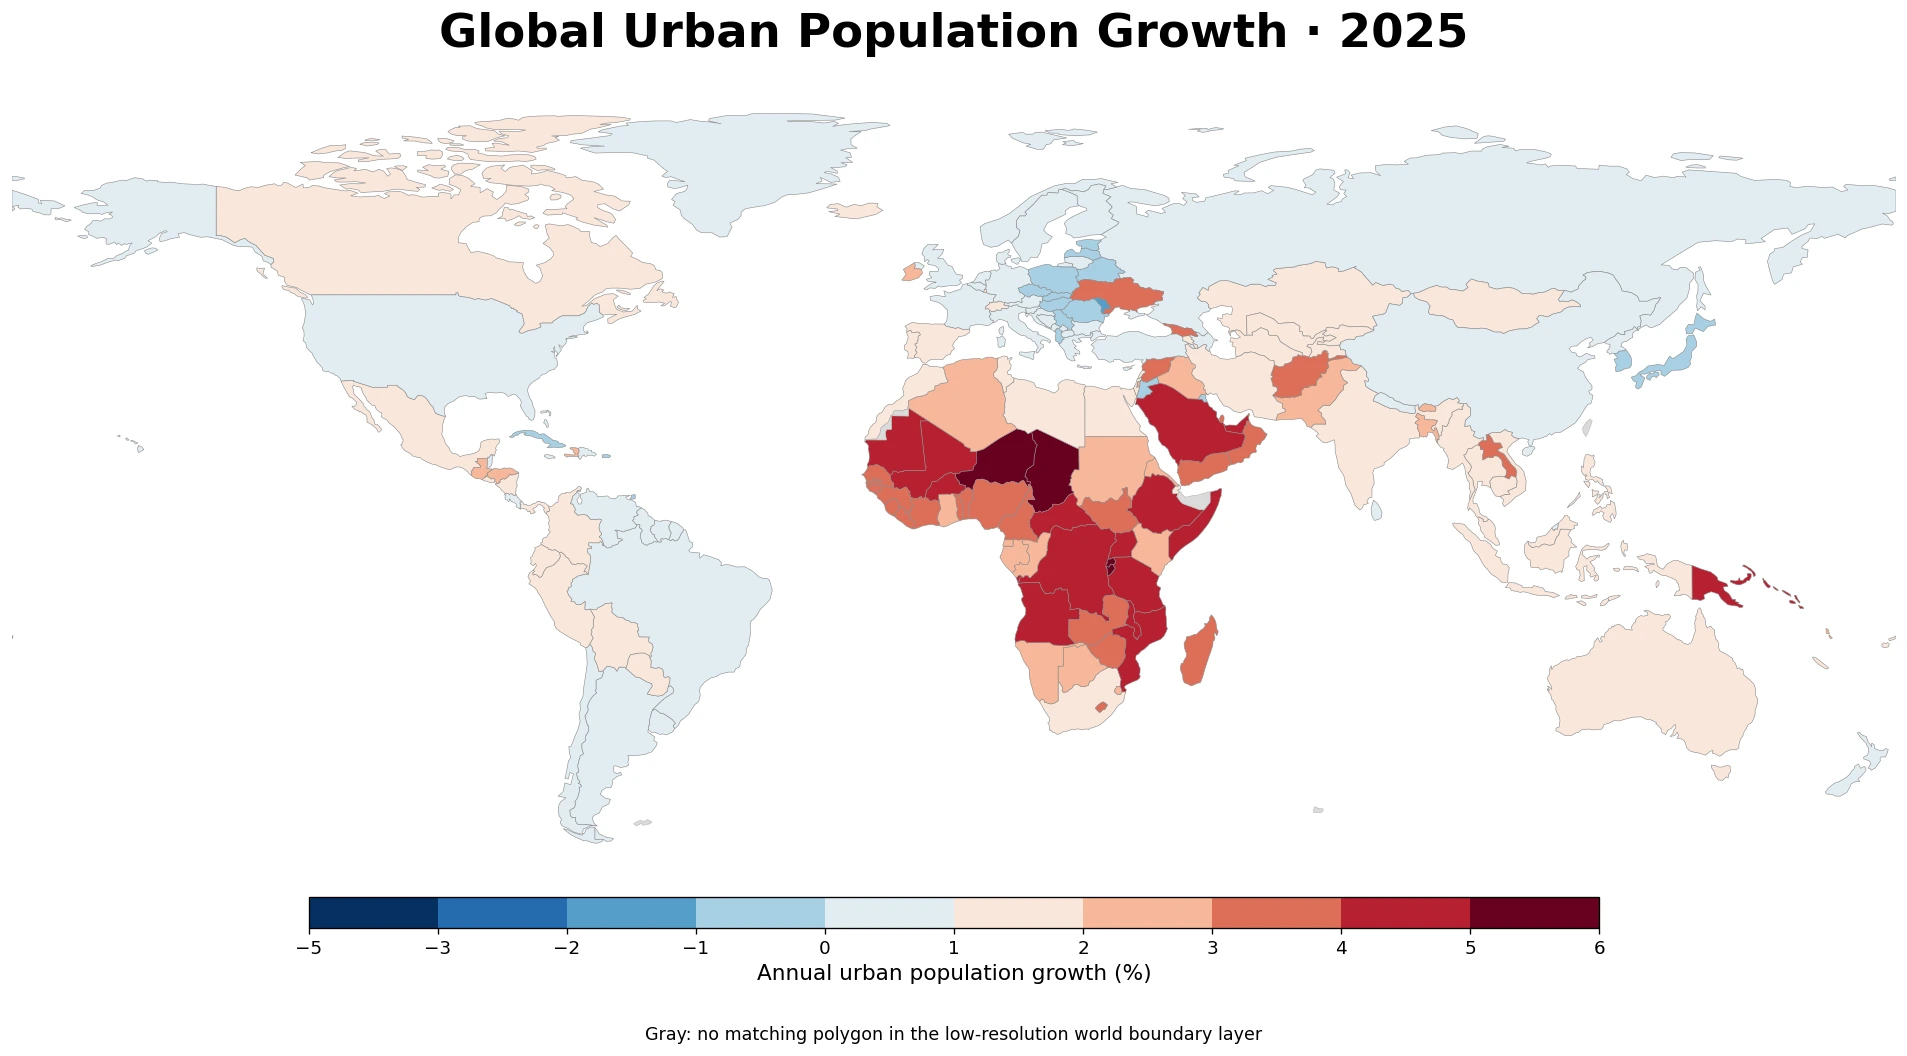
Table of Contents
The fastest 2025 urban population growth appears across parts of Africa and the Gulf
The highest observations are Burundi at 5.80%, Chad at 5.74%, Rwanda at 5.55%, Niger at 5.00%, and Mozambique at 4.95%. The United Arab Emirates is at 4.85% and Saudi Arabia at 4.82%, placing two Gulf economies in the same high-growth range. Tanzania is at 4.81%, Uganda at 4.80%, Mali at 4.80%, and Ethiopia at 4.59%. In total, 20 of the 217 observations are at or above 4%, while 45 are at or above 3%.
These values should not be treated as economic growth rates, housing-demand growth rates, or measures of urban quality. SP.URB.GROW directly measures only the pace at which the population classified as urban changes. Overall population growth, migration toward urban areas, changes in the urban share, and changes in statistical classification can all matter, but this one indicator cannot separate their individual contributions. The map is therefore best used to identify where urban population is changing quickly before moving to more detailed demographic data.
Most observations are positive, but the pace ranges from near zero to more than 5%
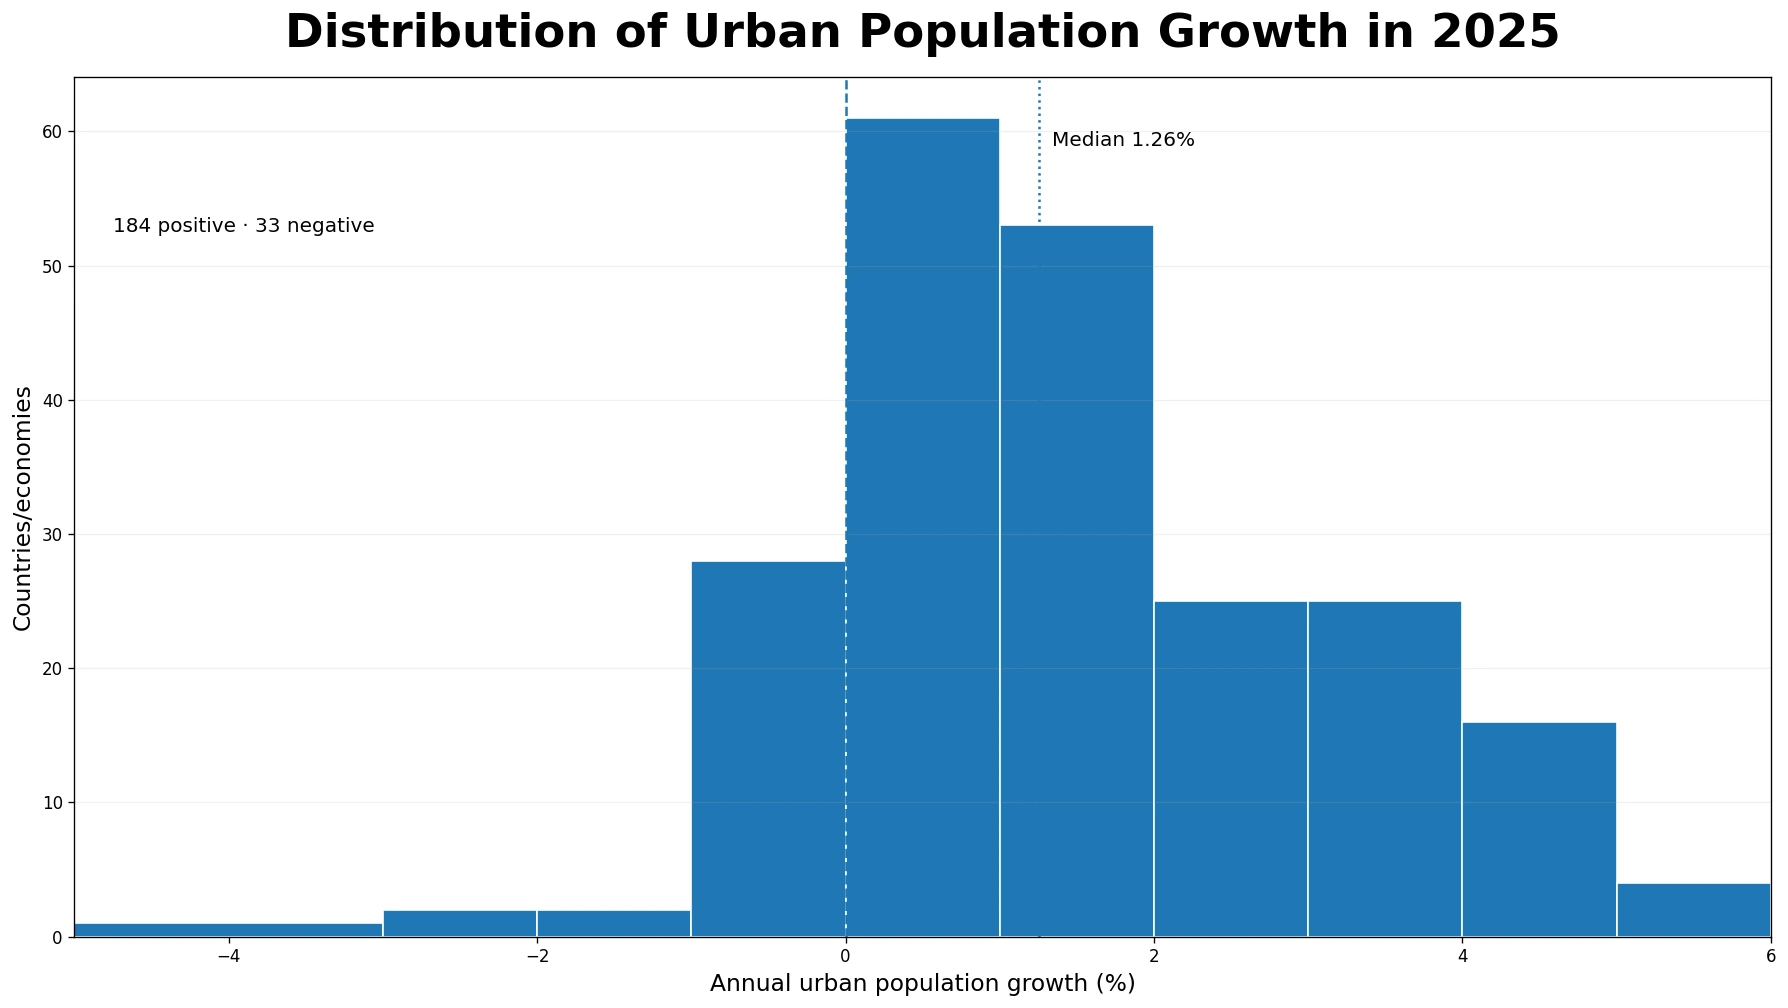
There are 61 observations from 0% to less than 1% and 53 from 1% to less than 2%. Together those two bands contain 114 countries and economies, more than half of the dataset. Another 25 fall between 2% and 3%, 25 between 3% and 4%, and 20 are at or above 4%. Only five observations are at or below -1%. The distribution is therefore strongly tilted toward positive growth, but the speed of growth varies widely.
The middle half of observations runs from about 0.38% to 2.63%, with a median of 1.26%. That median is useful for locating a typical country/economy observation, but it should not be described as the growth rate of the world’s urban population. India, China, and other economies with very large urban populations receive the same one-row weight as a small island economy in this calculation. A world-level growth rate requires population weighting or a separate official aggregate.
Selected large economies occupy very different growth ranges
| Country/economy | 2025 annual urban population growth |
|---|---|
| Ethiopia | 4.59% |
| Nigeria | 3.32% |
| Bangladesh | 2.92% |
| Pakistan | 2.45% |
| Indonesia | 1.87% |
| India | 1.76% |
| Australia | 1.67% |
| South Africa | 1.34% |
| Mexico | 1.19% |
| Canada | 1.15% |
| Brazil | 0.70% |
| United States | 0.61% |
| China | 0.51% |
| United Kingdom | 0.39% |
| France | 0.30% |
| Germany | 0.11% |
| Korea, Rep. | -0.12% |
| Japan | -0.37% |
Among the selected economies, Ethiopia and Nigeria are well above 3%, while Bangladesh and Pakistan are above 2%. India, Indonesia, and Australia are in the upper part of the 1% range. The United States, Brazil, and China are below 1%, while Korea and Japan are negative. None of these values is a ranking of city size, urban land area, income, housing supply, or living conditions. They measure only the annual percentage change in the population classified as urban.
Reading this table beside the Global Population Growth Map helps separate total population change from urban population change. A difference between the two rates is informative, but it cannot be converted directly into a count of people moving from rural to urban areas. Natural population change, international migration, changes in the urban share, and classification effects can all be involved, so causal decomposition requires additional aligned data.
Urban population growth is not the same as the urbanization rate
Urban population growth is the annual rate of change in the number of people classified as urban. The urbanization rate, by contrast, is the share of a country’s total population that lives in urban areas. A highly urbanized country can have flat or declining urban population, while a country with a lower current urban share can have very fast urban population growth. Both indicators describe urban demography, but they answer different questions.
The Global Urbanization Rate Map compares the urban share of total population in 2025. This article uses the same reference year but measures the speed of change in urban population from the previous year. Looking at both maps keeps the level and the rate of change separate: one asks how urban a population is, while the other asks how quickly the urban population is changing.
Negative rates mean urban population declined, not that cities disappeared
Thirty-three observations are negative in 2025. St. Martin (French part) has the lowest value at -4.65%, followed by the Marshall Islands at -2.96%, American Samoa at -2.12%, the Northern Mariana Islands at -1.57%, and Moldova at -1.26%. Latvia is at -0.77%, Monaco at -0.75%, Kuwait at -0.65%, and Albania at -0.61%. Japan is at -0.37% and Korea at -0.12%.
Percentage rates can be especially volatile where the urban population base is small. A -4.65% rate does not mean an urban problem is ten times as severe as a -0.5% rate, and it does not reveal the absolute number of people involved. To measure the size of the change, the base-year urban population must be considered alongside the percentage rate.
The indicator covers a country’s total urban population, not one city
The “urban population” in SP.URB.GROW is not the population of a single city such as Seoul, Tokyo, or London. It is the national total of people living in areas classified as urban under each country’s statistical system. A rapidly growing capital can therefore be offset by decline elsewhere, while growth across many smaller urban areas can raise the national rate even when no single metropolitan area dominates.
The series also does not measure expansion of built-up land. Urban population can increase without the physical urban footprint expanding at the same rate, and population density is a separate quantity. The Global Population Density Map uses people per square kilometer of land area, answering a different spatial question from annual urban population growth.
National definitions of urban areas limit fine-grained rankings
World Bank metadata defines urban population using areas classified as urban by national statistical offices. Countries do not apply one universal rule: some classifications depend mainly on settlement size, while others use infrastructure, services, or administrative designation. The World Bank therefore cautions that cross-country comparisons of urban and rural statistics should be interpreted carefully.
This methodological difference is a reason to focus on broad contrasts rather than precise league positions. A gap between 1.20% and 1.25% is less robust as an international ranking than a contrast between decline and 4–5% growth. Changes in national urban definitions or boundaries can also affect the measured urban population without representing a one-for-one movement of people, so long time-series work should check metadata and classification changes.
Data source and calculation method
The analysis uses World Bank World Development Indicators series Urban population growth (annual %), code SP.URB.GROW. The World Bank defines the annual rate for year t as the exponential rate of growth in midyear urban population from year t-1 to year t. Urban population estimates combine World Bank total population estimates with urban ratios from the UN Population Division’s World Urbanization Prospects.
The verified cleaned CSV contains 217 countries and economies, and all 217 rows are explicitly dated 2025. No older observation is carried forward and no missing value is imputed. The median, unweighted mean, positive/negative counts, and distribution bands are calculated directly from those 217 observations. The map joins ISO codes to a low-resolution Natural Earth boundary layer, so some small islands and separately reported economies may have valid statistics without a distinct visible polygon; the statistical summaries still retain all 217 rows.
Frequently Asked Questions
What does a positive or negative urban population growth rate mean?
A positive rate means the population classified as urban increased from the previous year; a negative rate means it declined. It is a change in urban population, not urban land area.
Is urban population growth the same as the urbanization rate?
No. Urban population growth measures the annual change in the urban population itself, while the urbanization rate measures the urban share of total population.
Are all observations on this map from 2025?
Yes. All 217 country/economy rows in the verified dataset are explicitly dated 2025, so the comparison does not mix older latest observations with the current year.
Does faster urban population growth mean faster urban economic growth?
No. The indicator measures population change only. Economic growth, housing demand, income, built-up area, and the causes of demographic change require separate data.
Related Articles
These related maps help separate the pace of urban population change from the urban share of population, total population growth, and national-average population density.
- Global Urbanization Rate Map 2025 – Country Comparison
- Global Population Growth Map – 2025 Country Comparison
- Global Population Density Map – 2023 Country Comparison
Green Map creates custom-edited map images using open geographic data sources such as geoBoundaries, Natural Earth, OpenStreetMap, and government open data.
These maps are edited visual materials, not raw data files, and are provided for education, documents, presentations, and graphic reference.