Rural population growth answers a narrower question than either national population growth or the urban share of a country. World Bank indicator SP.RUR.TOTL.ZG measures the annual rate of change in the population classified as rural. Restricting the supplied dataset to observations dated 2025 leaves 205 countries and separately reported economies. Their median growth rate is 0.21% and the simple unweighted mean is 0.12%. There are 117 positive observations and 88 negative ones. The mean describes the distribution of country rows; it is not the population-weighted growth rate of the world’s rural population.
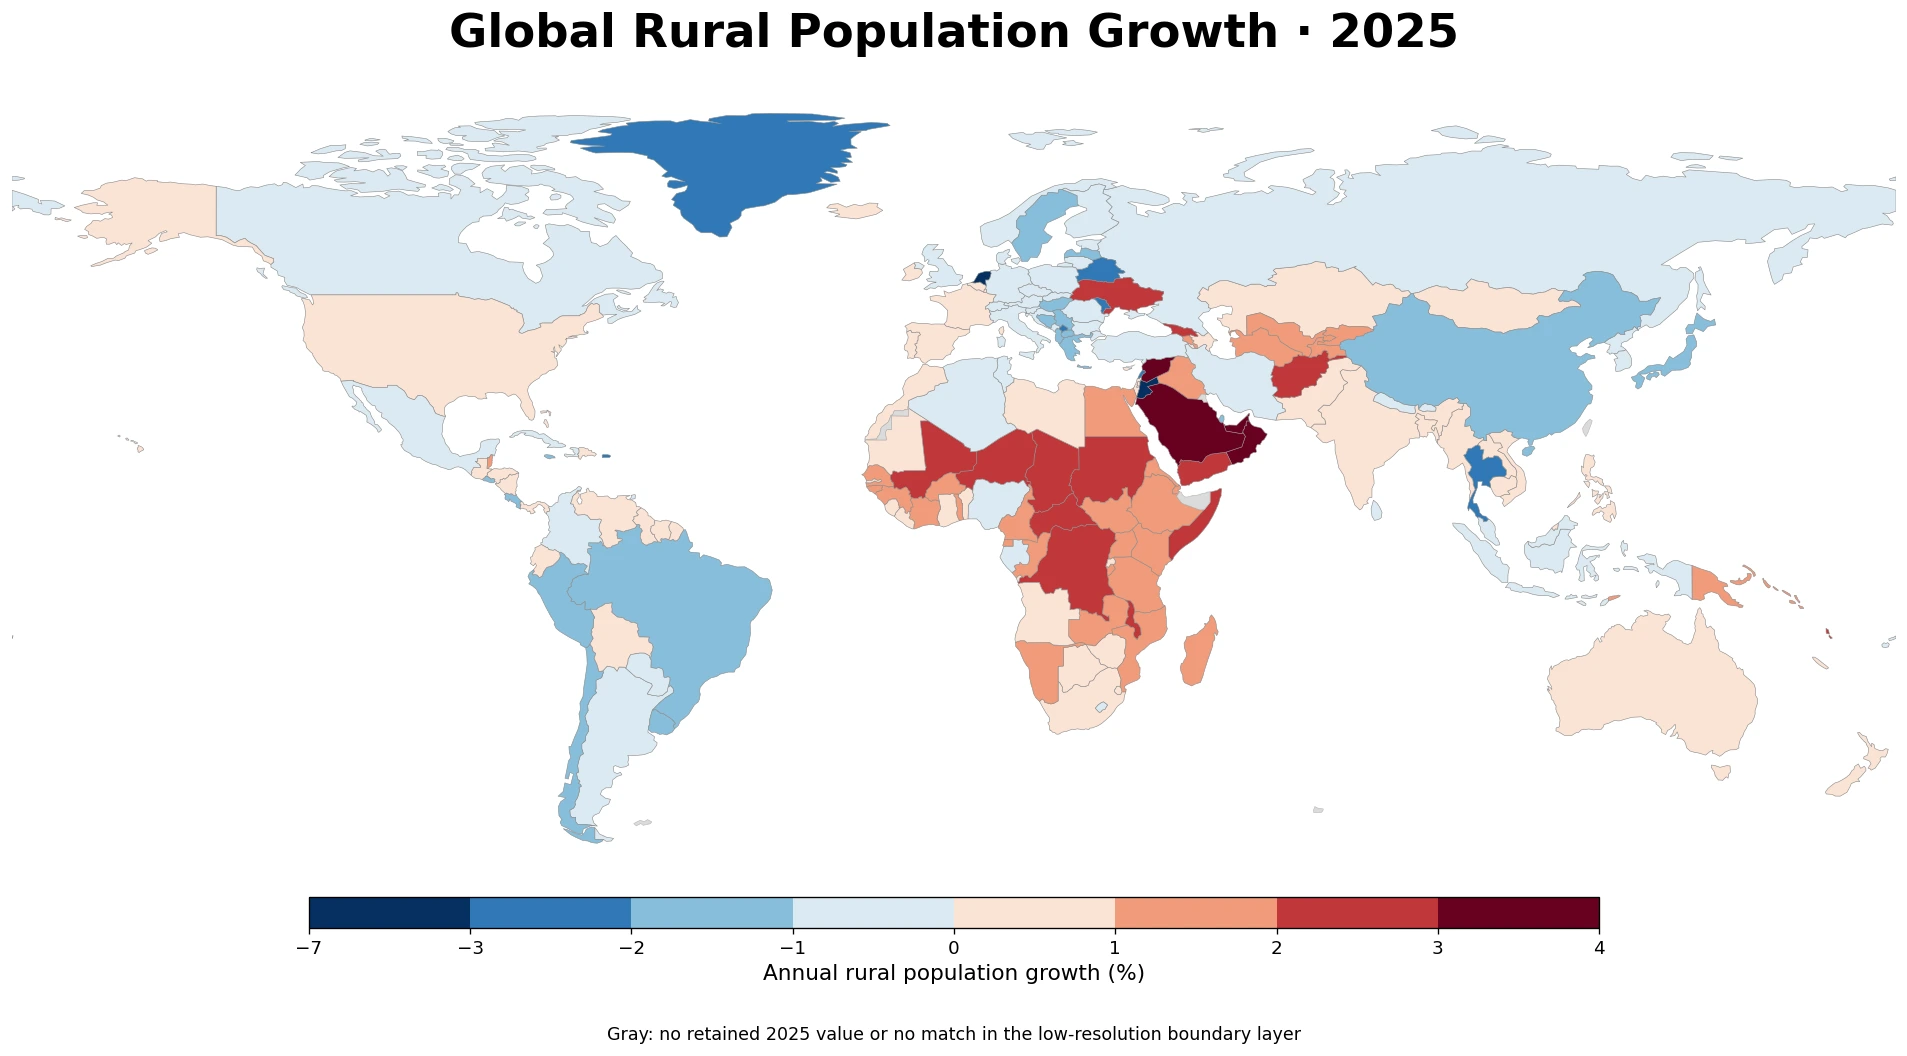
Table of Contents
The map separates rural population change from the direction of total population change
Some of the largest positive 2025 rates appear in West Asia and across several parts of Sub-Saharan Africa. Oman is at 3.79%, the Syrian Arab Republic at 3.74%, the United Arab Emirates at 3.66%, and Saudi Arabia at 3.62%. Niger is 2.83%, the Central African Republic 2.60%, Chad 2.54%, the Democratic Republic of the Congo 2.53%, Yemen 2.53%, Afghanistan 2.44%, and Sudan 2.27%. These examples show where the rural population measure is increasing quickly, but they do not establish a single regional cause.
Negative values are geographically widespread as well. The Netherlands records -6.58%, the Marshall Islands -5.19%, Jordan -4.01%, Tuvalu -3.68%, Cabo Verde -3.30%, and Thailand -2.54%. Among larger economies, Brazil is -1.97%, Japan -1.91%, China -1.49%, Indonesia -0.78%, and Germany -0.68%. A large percentage change does not necessarily correspond to a large absolute number of people: where the rural population base is small, a modest headcount change can translate into a relatively large rate.
More than half of the 2025 observations fall between -1% and +1%
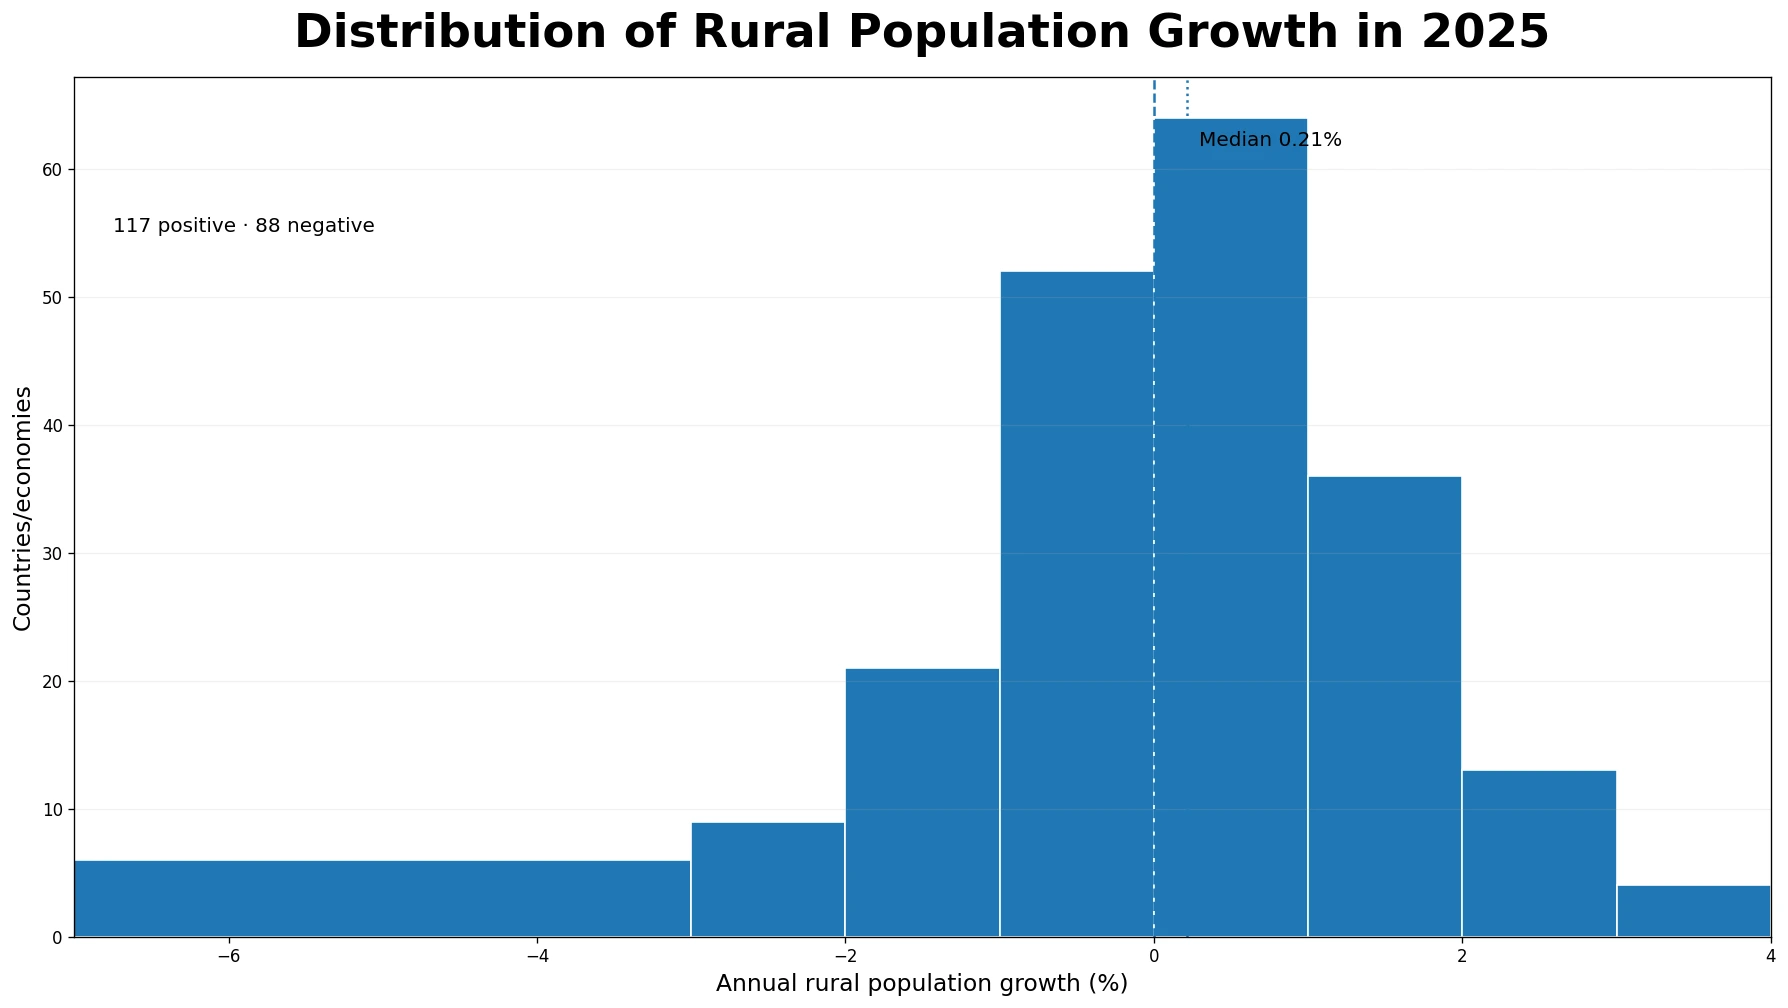
The center of the distribution is much denser than the map’s extreme colors suggest. A total of 116 observations, or about 56.6% of the 205-row sample, are at least -1% and below +1%. Sixty-four are between 0% and 1%, while 52 are between -1% and 0%. Only 17 observations reach 2% or more, and 15 are at -2% or below. The most useful first reading is therefore the broad sign and magnitude of change rather than a league table built from small decimal differences.
The unweighted mean of 0.12% and median of 0.21% are both close to zero. Neither should be described as the world’s rural population growth rate. A country with a very large rural population and a small territory with a very small rural population each contribute one row to these summary statistics. A global headcount growth rate would require population weights or an official aggregate calculated for that purpose.
Selected major economies move in different directions on the same measure
The contrast remains visible when the comparison is limited to familiar large economies. Ethiopia is at 1.91%, South Africa 0.81%, Australia 0.58%, India 0.41%, and the United States 0.18%. France is close to flat at 0.03%. Korea is -0.16%, Mexico -0.60%, Germany -0.68%, Indonesia -0.78%, China -1.49%, Japan -1.91%, and Brazil -1.97%. Nigeria is slightly negative at -0.12%, showing why broad regional labels can hide substantial national differences.
| Country/economy | Rural population growth, 2025 |
|---|---|
| Oman | 3.79% |
| Saudi Arabia | 3.62% |
| Ethiopia | 1.91% |
| South Africa | 0.81% |
| Australia | 0.58% |
| India | 0.41% |
| United States | 0.18% |
| France | 0.03% |
| Korea, Rep. | -0.16% |
| Mexico | -0.60% |
| Germany | -0.68% |
| Indonesia | -0.78% |
| China | -1.49% |
| Japan | -1.91% |
| Brazil | -1.97% |
| Netherlands | -6.58% |
This table is not a ranking of rural living standards, agricultural performance, or regional development. The series contains only the rate of change in the population classified as rural. It does not identify whether a decline reflects urban migration, lower natural increase, international migration, a change in statistical classification, or several mechanisms at once. Those explanations require additional data matched by country and year.
Rural population growth is not the same as national population growth
National population growth measures change across the full resident population. This indicator isolates the rural component. A country can therefore have a growing total population while its rural population declines, or a nearly stable national total while its rural population changes more rapidly. The two series can diverge because the rural share is affected by movements between urban and rural classifications as well as the demographic changes occurring within the rural population.
The Global Population Growth Map for 2025 is a useful companion because it measures the whole population rather than the rural subset. Comparing the two can identify countries where the directions differ, but explaining that difference would require a time series and additional variables rather than a single cross-sectional map.
A growth rate is also different from the rural share or urbanization rate
The percent sign can be misleading if the metric is read too quickly. A value of 2% here does not mean that 2% of the country’s population is rural. It means that the rural population itself changed at an annual exponential rate of about 2% from the preceding year. The level of rural population and the rate at which that population changes are separate quantities.
The Global Urbanization Rate Map measures the share of residents classified as urban, so it answers a different question. In a highly urbanized economy the rural base can be small, making a percentage growth rate relatively volatile even when the absolute number of people involved is limited. The two indicators can be read together, but one should never be substituted for the other.
Four old latest observations are excluded from the 2025 comparison
The supplied source file contains 209 rows because its collection rule keeps the most recent non-empty observation for each economy. For 205 rows that observation is 2025. Four are much older: Bahrain is dated 2009 at -71.59%, Hong Kong SAR is dated 1995 at -172.33%, Kuwait is dated 2004 at -146.76%, and Macao SAR is dated 2000 at -120.40%. Mixing those observations with 2025 values would combine different time periods and would stretch the map scale so severely that current cross-country differences would become difficult to see.
For that reason, every map color, distribution statistic, threshold count, mean, median, and table comparison in this article uses only the 205 rows explicitly dated 2025. The four older observations are not converted to zero, imputed, or relabeled as current values. A consistent year is more important for this snapshot than maximizing the number of rows.
National definitions of urban and rural limit fine-grained rankings
The World Bank metadata defines rural population through national statistical-office classifications and calculates it as the difference between total and urban population. It also describes rural population as an approximation of the midyear nonurban population. Countries do not use one universal rule to distinguish urban from rural areas: definitions may depend on settlement size, infrastructure and services, or administrative designation.
That methodological difference is a strong reason to avoid treating -0.2% and -0.3% as a meaningful international ranking. Broad categories, the sign of change, and large gaps are more defensible than precise league positions. The indicator also says nothing directly about rural land area, agricultural land, physical settlement density, or accessibility. For a different geographic perspective, the Global Population Density Map measures people per square kilometer of land rather than rural population change.
Data source and calculation method
The analysis uses World Bank World Development Indicators series Rural population growth (annual %), code SP.RUR.TOTL.ZG. The World Bank defines the rate as the exponential growth rate of midyear rural population between consecutive years. Rural estimates use World Bank population estimates and rural ratios derived from the UN Population Division’s World Urbanization Prospects, together with national definitions of urban and rural areas.
All statistics were calculated directly from the verified cleaned CSV after filtering to year 2025. No missing value was filled and no earlier observation was carried forward into the 2025 map. The world map joins country codes to a low-resolution Natural Earth boundary layer, so some small islands and separately reported economies may have a valid statistical observation without a distinct visible polygon. The statistical summaries still use all 205 retained 2025 rows.
Frequently Asked Questions
What does a positive or negative rural population growth rate mean?
A positive value means the population classified as rural increased from the previous year; a negative value means it decreased. The metric is an annual rate of change in the rural population.
Is this the percentage of the population that lives in rural areas?
No. It measures the annual growth rate of the rural population itself, not the rural share of total population.
Are all values on the map from 2025?
Yes. The map and statistics use the 205 observations dated 2025. Older latest observations for Bahrain, Hong Kong SAR, Kuwait, and Macao SAR are excluded from the same-year comparison.
Can countries be ranked precisely by this rural population growth rate?
Broad differences are useful, but small ranking differences should be interpreted cautiously because countries use different statistical definitions to distinguish urban and rural areas.
Related Articles
These related maps measure different dimensions of population change and settlement, making them useful for separating rural growth from total growth, urban share, and density.
- Global Population Growth Map – 2025 Country Comparison
- Global Urbanization Rate Map – Urban Population by Country in 2025
- Global Population Density Map – 2023 Country Comparison
Green Map creates custom-edited map images using open geographic data sources such as geoBoundaries, Natural Earth, OpenStreetMap, and government open data.
These maps are edited visual materials, not raw data files, and are provided for education, documents, presentations, and graphic reference.