Navajo County stretches a remarkable distance from north to south across eastern Arizona. The long northern rectangle narrows and steps inward before continuing through the central corridor and into a smaller southern extension, so places that belong to the same county can appear far apart on a single page. This Navajo County Map set uses the supplied county, city, water, and elevation views to connect the northern highway network with Winslow and Holbrook in the middle and Snowflake, Taylor, Show Low, and Pinetop-Lakeside farther south. You can download the four high-resolution JPG maps in one ZIP after using the WebP previews for quick reference.
A useful way to orient yourself is to begin near Interstate 40 in the middle of the county. Winslow lies to the west and Holbrook to the east, while Roads 77 and 87 help lead the eye toward the communities farther south. The northern part has a very different road pattern, with Routes 160, 163, 264, and other numbered roads spread across a much longer empty-looking section. The water and elevation views add another layer: the Puerco River crosses the central area, several named lakes cluster around the southern communities, and the county contains more than a thousand meters of elevation change from its lower areas to its highest terrain.
Table of Contents
A long county outline ties together several separate road corridors
In the northern portion of the general map, Route 163 runs down from the top of the county and connects with Route 564 and Route 160. Labels such as Chilchinbito and Low Mountain provide place references in this broad northern section. Farther south, Route 264 crosses the county and Route 399 continues toward the central part of the outline. The distances on the page can look compressed because the county is so tall, so following the route numbers in sequence is more useful than judging travel distance from the printed space alone.
The road network becomes noticeably denser around the central corridor. Routes 87 and 99 approach Interstate 40, while Routes 77 and 180 are also visible near the Holbrook area. South of that belt, Routes 377, 277, 260, and 60 connect the Snowflake, Taylor, and Show Low region, and Route 73 appears in the narrow southern extension. This change from widely spaced northern routes to a busier middle and southern network is one of the clearest features of the county map.
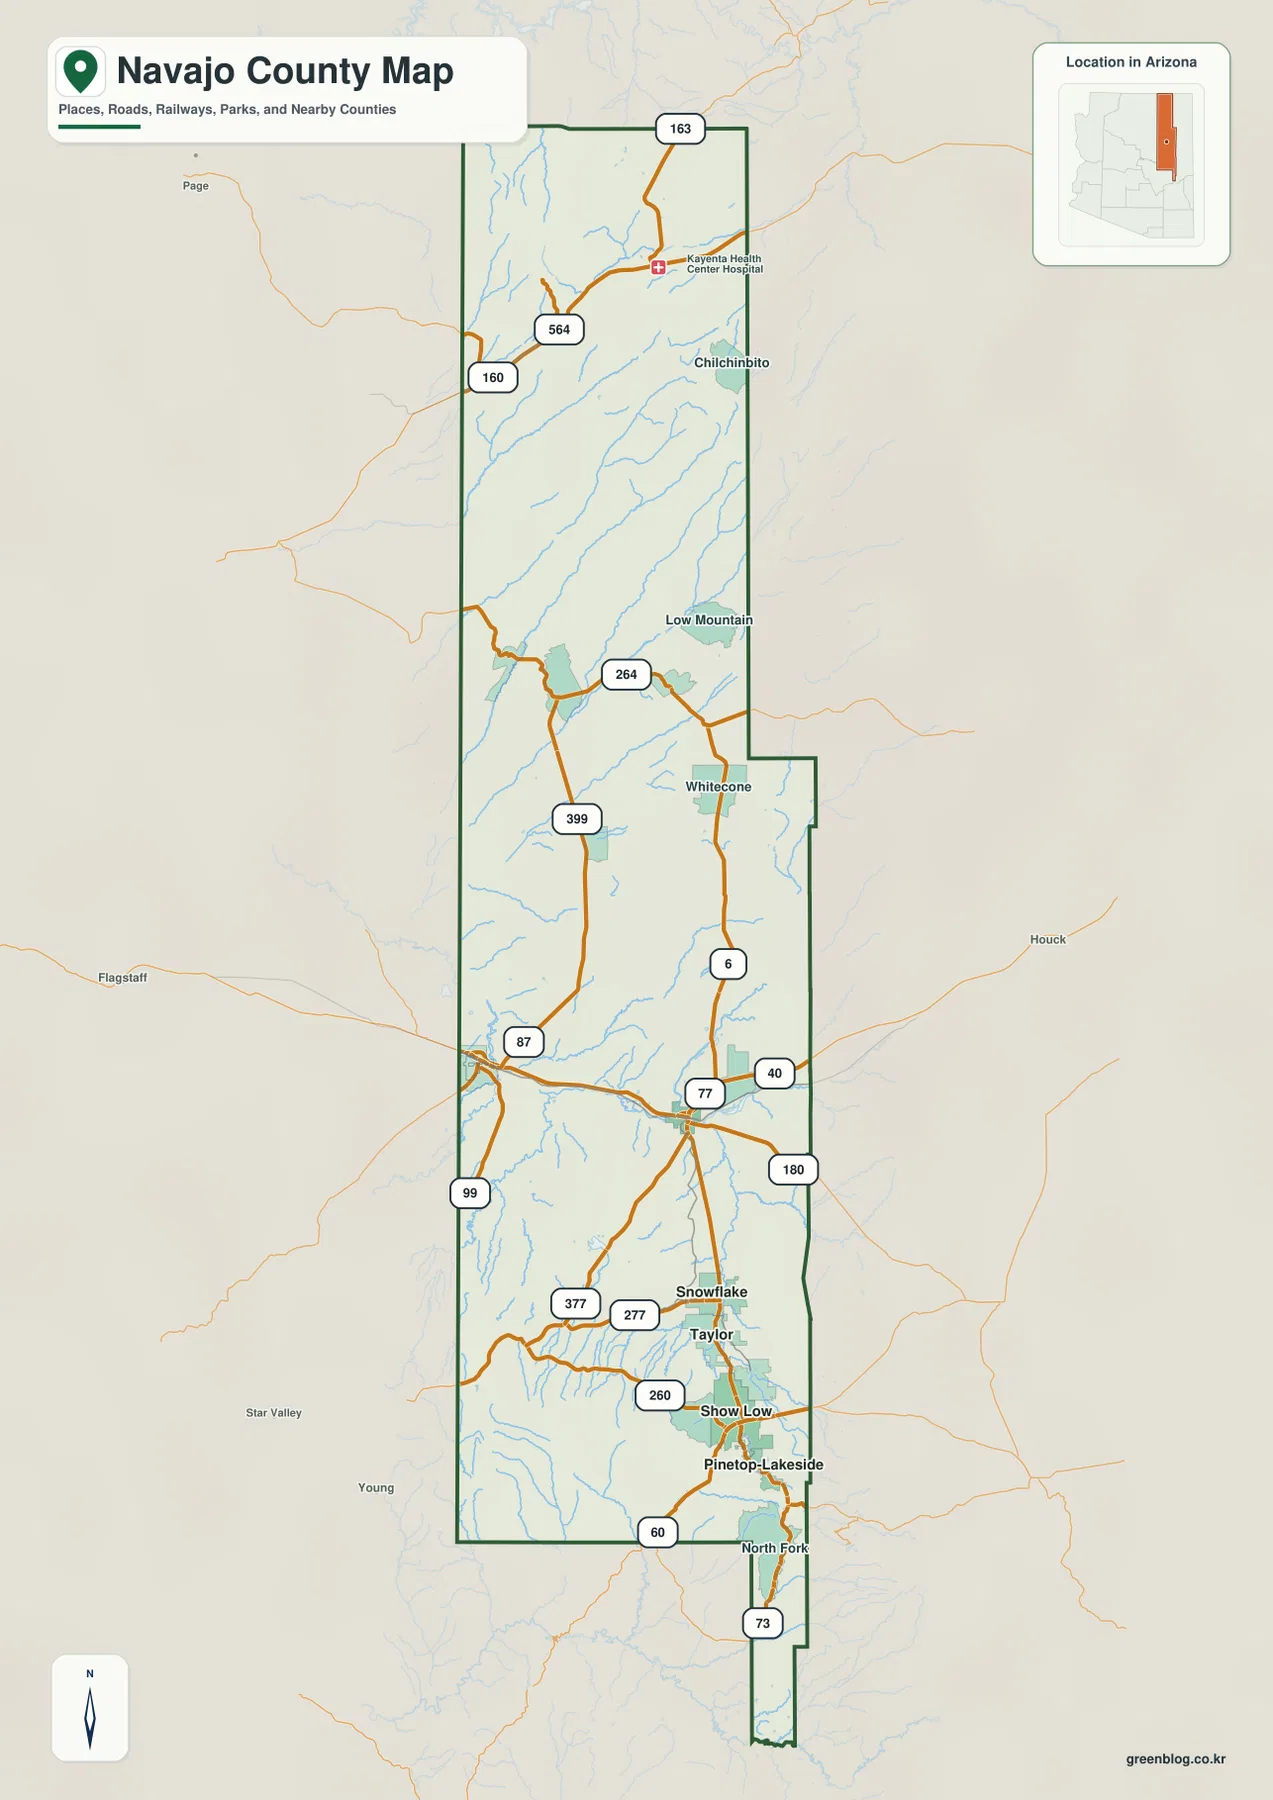
The small Arizona inset in the upper-right corner also makes the county’s statewide position clear: Navajo County occupies a tall strip in eastern Arizona. The map is designed for county-scale orientation rather than turn-by-turn navigation. Local streets, temporary closures, road conditions, and exact driving times require current transportation or navigation sources. For a visitor trying to understand why the same county contains both a remote northern road pattern and a more concentrated southern city network, however, this view provides a useful starting point.
Six mapped communities cluster from the I-40 corridor southward
The city map highlights six ranked places: Show Low, Winslow, Snowflake, Holbrook, Taylor, and Pinetop-Lakeside. The supplied index prints values of 12,102 for Show Low, 8,773 for Winslow, 6,444 for Snowflake, 4,858 for Holbrook, 4,183 for Taylor, and 4,101 for Pinetop-Lakeside. Those figures belong to the supplied map and should not automatically be treated as the latest population estimates. Their geographic positions are the more important part of this page.
Winslow and Holbrook form the northernmost pair among the six highlighted communities and sit near the broad Interstate 40 corridor. Snowflake and Taylor are farther south and relatively close to each other. Show Low and Pinetop-Lakeside form another southern cluster, with Pinetop-Lakeside slightly farther down the narrow eastern side of the county. The absence of ranked city markers across the large northern rectangle is just as informative: the map makes the county’s population centers look strongly concentrated in its central and southern portions.
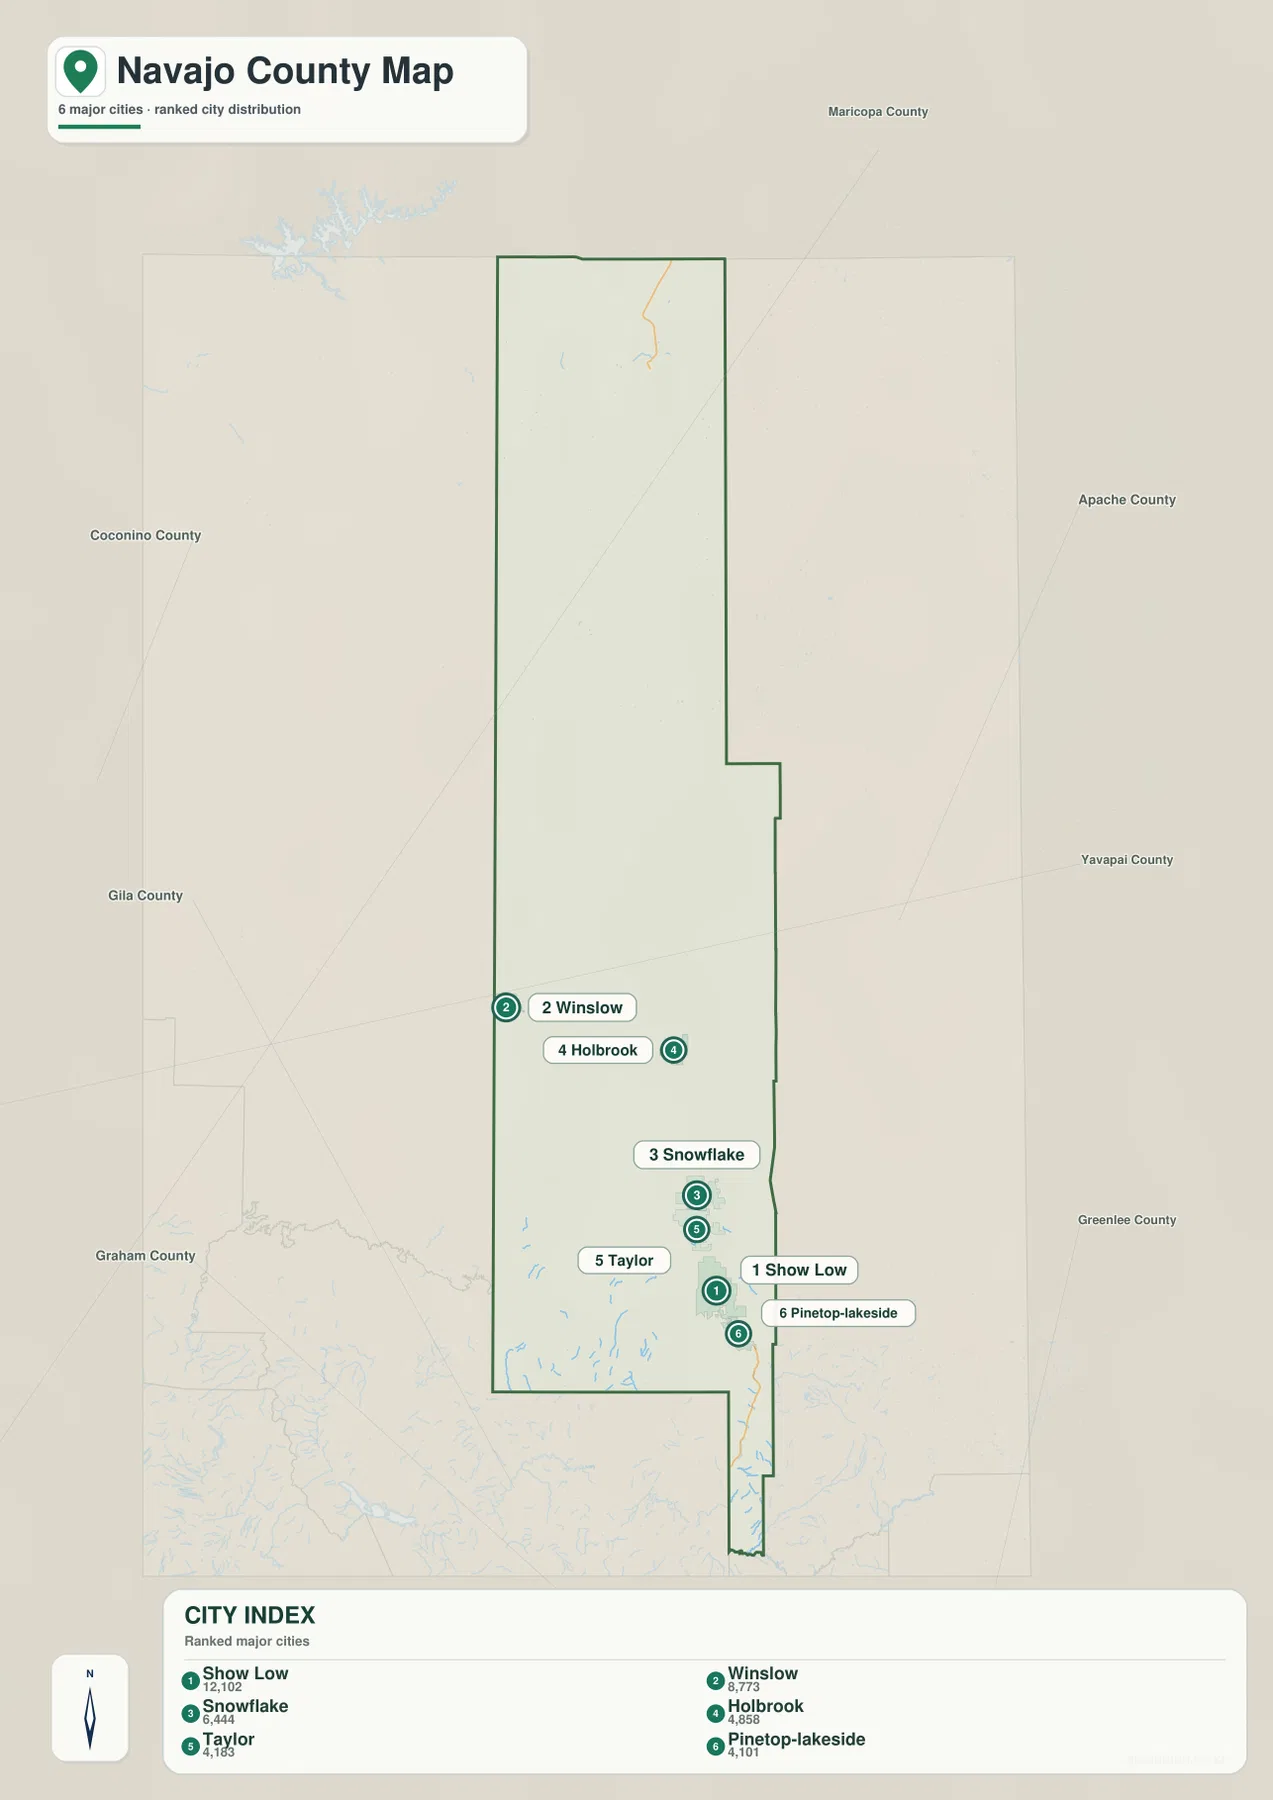
Navajo County’s official website lists its Governmental Complex in Holbrook, which makes Holbrook a practical reference when reading the middle of the county. The county’s visitor pages also group information around Holbrook, Pinetop/Lakeside, Snowflake/Taylor, Show Low, and Winslow. That matches the overall pattern visible in the supplied city map without turning the map into a complete directory. If the goal is to explain how these places are connected by roads, pair this simplified city view with the general county map.
The Puerco River crosses the middle while southern lakes gather near Show Low
The terrain-and-water map gives the central corridor a strong geographic anchor in the Puerco River. The river is labeled near the Holbrook area, with Leroux Wash and Woodruff Lake nearby. In the far north, the map also labels Forest Lake along with smaller drainage features such as Moonlight Creek and Canyon Creek. The spacing of those northern features reinforces what the road map suggests: the county extends through a large amount of terrain before reaching the central city corridor.
The southern part looks different because several named lakes appear close together. Dry Lake is followed farther south by Grandpa’s Lake, Telephone Lake, Fools Hollow Lake, Show Low Lake, and Rainbow Lake, while Mud Creek runs through the same general area. The concentration of water labels near Show Low and the neighboring communities gives the southern map a much busier appearance than the Puerco River corridor in the middle. This contrast is useful when explaining why a single county can contain quite different local landscapes.
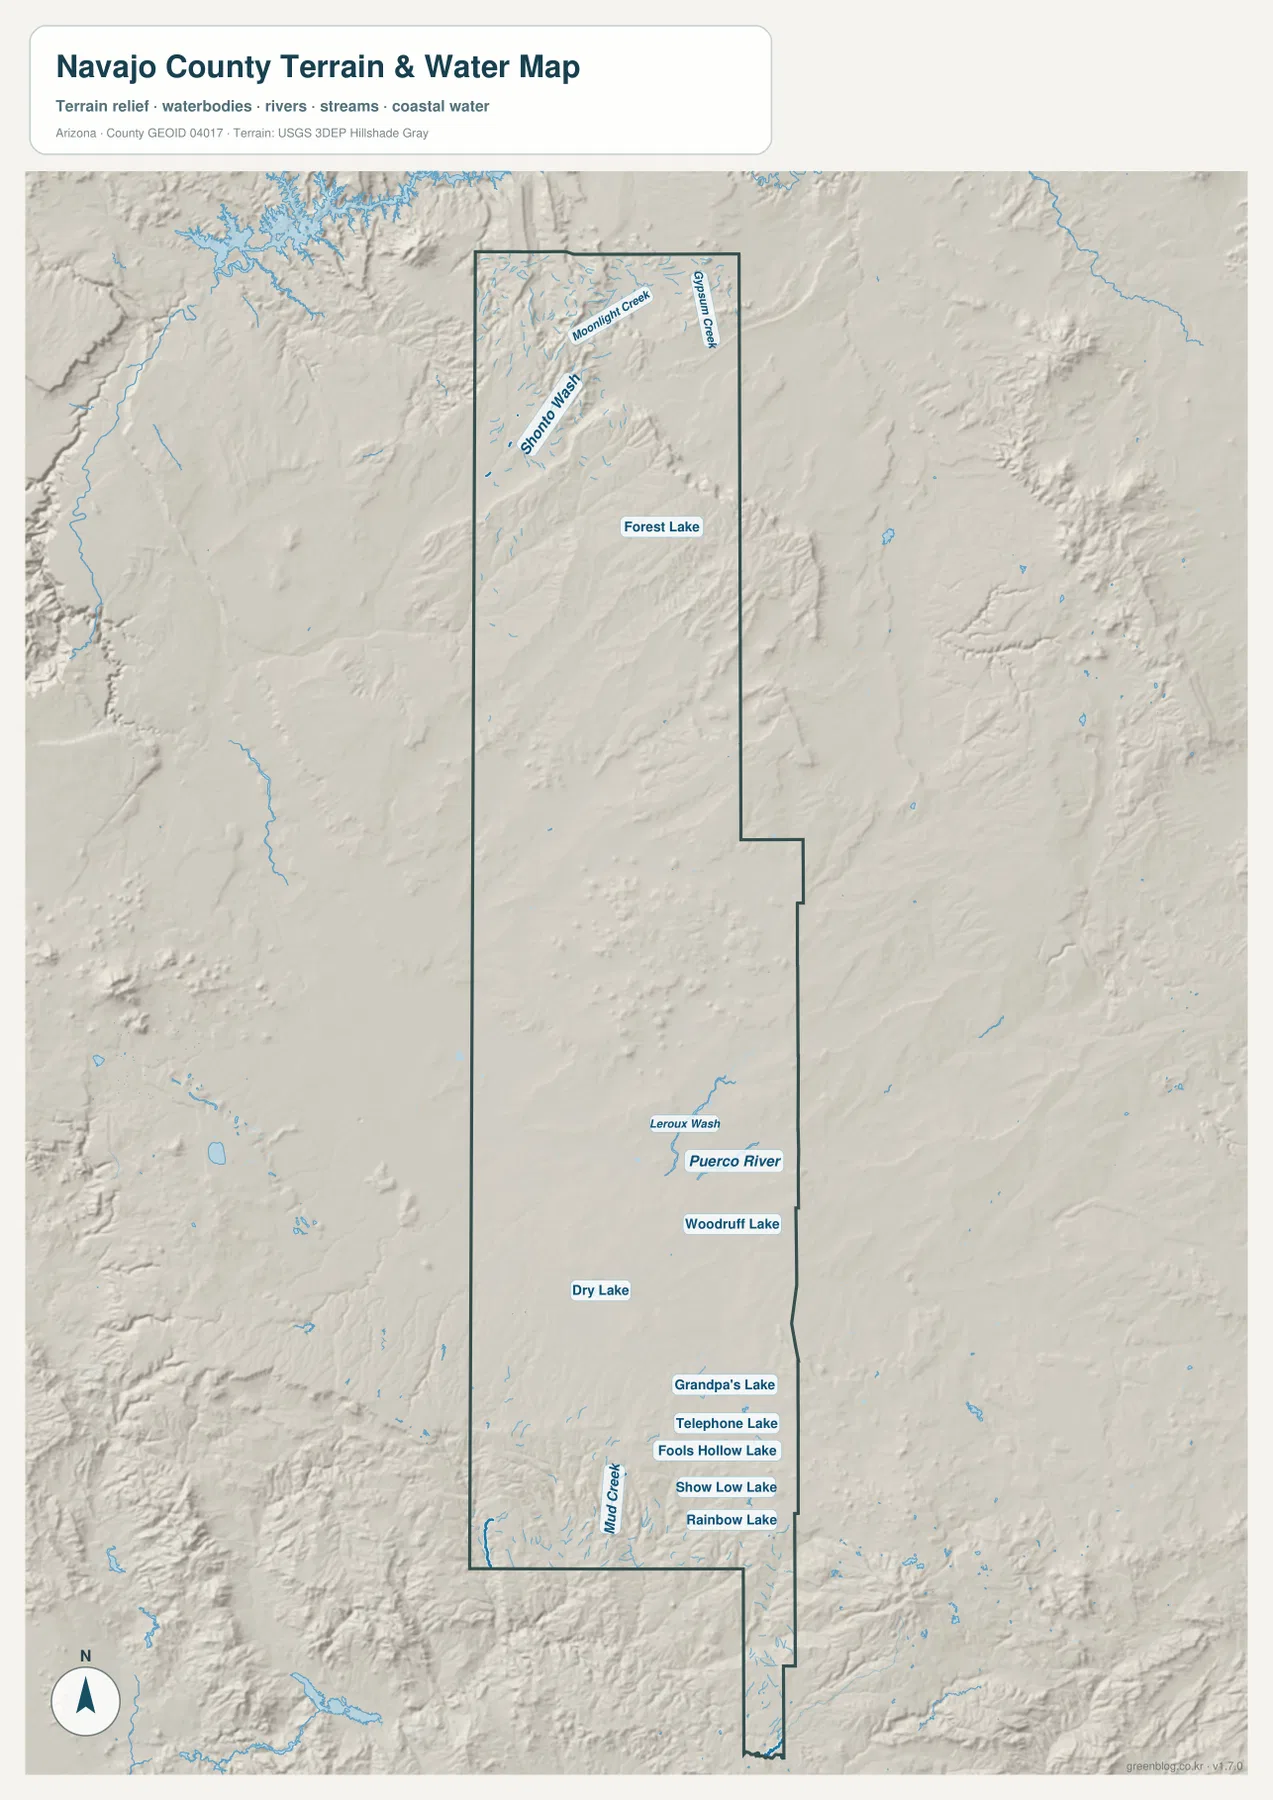
The blue water features are geographic references, not a flood forecast or a statement about current water depth. A creek shown on the map may be intermittent, and the presence of a lake label does not indicate current access, boating conditions, or recreation rules. The map should also not be used to settle parcel or legal-boundary questions. For those purposes, use the appropriate current agency data. Here, the value of the water view is in comparing drainage and waterbody locations with the county’s roads and terrain.
More than 1,100 meters separate the county’s low and high terrain
The elevation map reports an actual range of about 1,342 to 2,474 meters and a mean elevation of 1,828 meters. Green shades mark lower terrain, while tan and brown identify progressively higher ground. Much of the central portion appears green, creating a broad lower belt through the county. The northern section, by contrast, contains large brown and tan uplands, and another high belt becomes prominent in the south near the Show Low and Pinetop-Lakeside area.
The northern high ground is not one flat plateau on the image. Darker ridges and lighter slopes break it into several large blocks, with lower drainage corridors cutting between them. In the south, the elevation rises sharply again after the greener central area, producing a strong north-central-south contrast across the long county shape. Comparing this with the water map helps explain why creeks, washes, and lake basins occupy particular lower corridors while surrounding ridges stand out in brown.
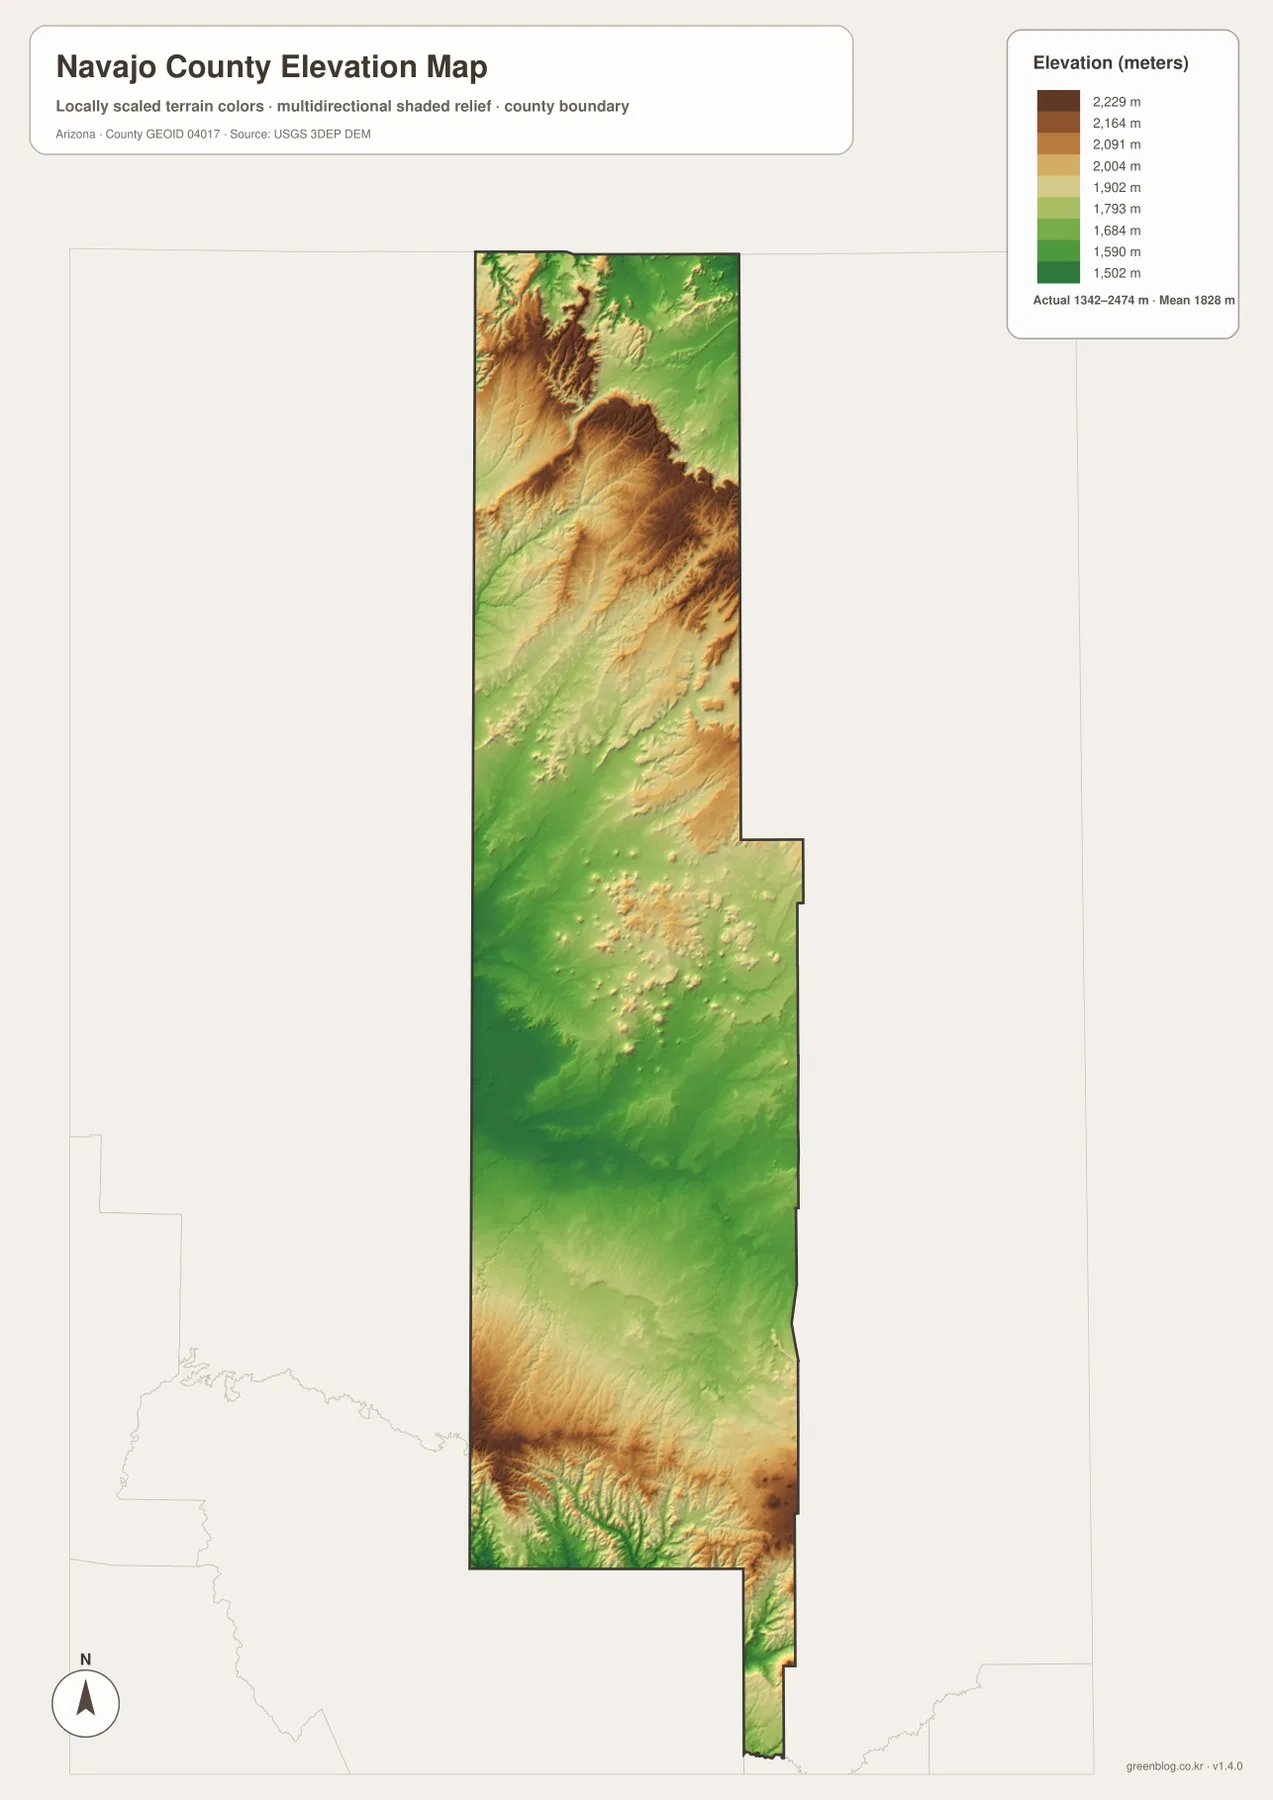
This is a generalized countywide elevation surface, not a survey product. Elevation varies within each color band, and small ridges or drainage cuts may be simplified at the page scale. The map is suitable for explaining broad differences between the northern uplands, central lower country, and southern high terrain. Engineering, construction, drainage design, or site-specific elevation work should rely on original USGS elevation data or a professional survey.
Pick the map according to the part of Navajo County you need to explain
Use the general county map when the question is how Routes 160, 264, Interstate 40, 77, 60, and the other major roads fit inside the long boundary. The city map is cleaner when the task is simply to compare Winslow, Holbrook, Snowflake, Taylor, Show Low, and Pinetop-Lakeside. The water view is the better choice for the Puerco River and the named southern lakes, while the elevation map makes the north-south height differences much easier to see.
The WebP images on this page are sized for fast viewing in a browser. For printing, presentations, or closer inspection of road and water labels, download the high-resolution JPG files from the ZIP below. Each map theme is stored separately, so a project can use only the county, city, water, or elevation view it needs. When cropping or resizing, keep the county boundary and orientation marker visible, and retain the legend on the elevation map so the colors remain meaningful.
Use current official sources for details beyond the map scale
These maps are designed to explain county-scale geography. They do not show every local street, building, parcel line, or administrative facility. The values printed on the city ranking image belong to the supplied map and should be checked against current Census data before being presented as present-day population totals. The water map is not a flood-depth product, and the elevation map is not a substitute for a survey. Legal, engineering, emergency, and property decisions require the appropriate current official source.
The official Navajo County website identifies its Governmental Complex in Holbrook, and its visitor information pages include Holbrook, Pinetop/Lakeside, Snowflake/Taylor, Show Low, and Winslow among the communities visitors may explore. Those county pages provide a useful real-world check on several of the place names emphasized in the map set. For changing information such as office services, road conditions, recreation access, and local regulations, use those live official pages rather than relying on a static map image.
Frequently Asked Questions
Which map is best for comparing Winslow and Holbrook?
The city map is the quickest way to compare their relative positions. Use the general county map alongside it when you also need road context, because Interstate 40 crosses the central part of the county and Routes 77 and 180 appear near the Holbrook area.
Where can I see the lakes around Show Low on the supplied maps?
The terrain-and-water map labels Show Low Lake, Rainbow Lake, Fools Hollow Lake, Telephone Lake, and Grandpa’s Lake in the southern part of the county. Comparing that view with the elevation map also shows that the Show Low area sits near one of the county’s higher terrain belts.
Can I use the 1,342–2,474 meter elevation range for an exact property elevation?
No. The range is intended for countywide comparison and does not provide survey-grade elevation for a specific address or parcel. Use original USGS elevation data or a professional survey for site-specific work.
Map File Information
Download the high-resolution Navajo County JPG maps in one ZIP. The county, city, terrain-and-water, and elevation views are stored as separate files.
- Included Files: county map, city map, terrain-and-water map, elevation map
- File Type: ZIP containing 4 high-resolution JPG files
Related Maps
Sources and reference data
- Official Navajo County website – county administration and the Governmental Complex in Holbrook.
- Navajo County Places to Visit – community and visitor information for Holbrook, Show Low, Winslow, and other county locations.
- U.S. Census Bureau TIGER/Line Shapefiles – reference source for county boundaries and geographic data.
- USGS National Hydrography – reference data for rivers, streams, and water features.
- USGS 3D Elevation Program – elevation data and 3DEP program information.
Green Map creates custom-edited map images using open geographic data sources such as geoBoundaries, Natural Earth, OpenStreetMap, and government open data.
These maps are edited visual materials, not raw data files, and are provided for education, documents, presentations, and graphic reference.