Yankton County sits in southeastern South Dakota with the Missouri River forming the winding southern edge shown on these maps. Yankton, the county’s most prominent labeled city, lies close to that river boundary where several important roads meet. This page brings together a general county map, a ranked city map, a terrain-and-water map, and an elevation map so you can compare roads, settlements, rivers, creeks, and changes in height. High-resolution JPG versions are also available in the download package for printing, presentations, school work, or offline reference.
The four views are useful for different questions, but they work especially well together. The general map is the quickest way to orient yourself to Yankton, Highway 81, and the southern east-west routes. The city view makes the distribution of six labeled communities easy to compare. The water map adds the Missouri River, James River, named creeks, and lakes, while the elevation view shows why the broad southern river area looks very different from the higher ground in the northeast and southwest. Rather than treating each image as a separate graphic, you can move between them to understand how the county’s settlements and transportation fit around its rivers and terrain.
Table of Contents
Yankton, major roads, and the county outline
On the general county map, Yankton is positioned near the southern center of the county. South Dakota Highway 81 runs north from the city, while Route 50 crosses the southern part of the county from west to east. Routes 52, 46, 314, and 153 are also labeled, giving a useful overview of how the road network approaches Yankton and connects with other places inside the boundary. For someone who is unfamiliar with the area, this map is a practical starting point because it places roads, towns, streams, and the county edge on one page.
Mission Hill appears east of Yankton, with Gayville farther toward the eastern side. Volin is labeled northeast of those communities, while Utica and Lesterville are west of the central part of the county. Irene appears at the eastern edge of the mapped county area. Outside the boundary, labels such as Maxwell Colony and Cameron Colony help establish direction and neighboring context. The county’s southern boundary is noticeably irregular because it follows the river, unlike several straighter boundary segments to the north and east.
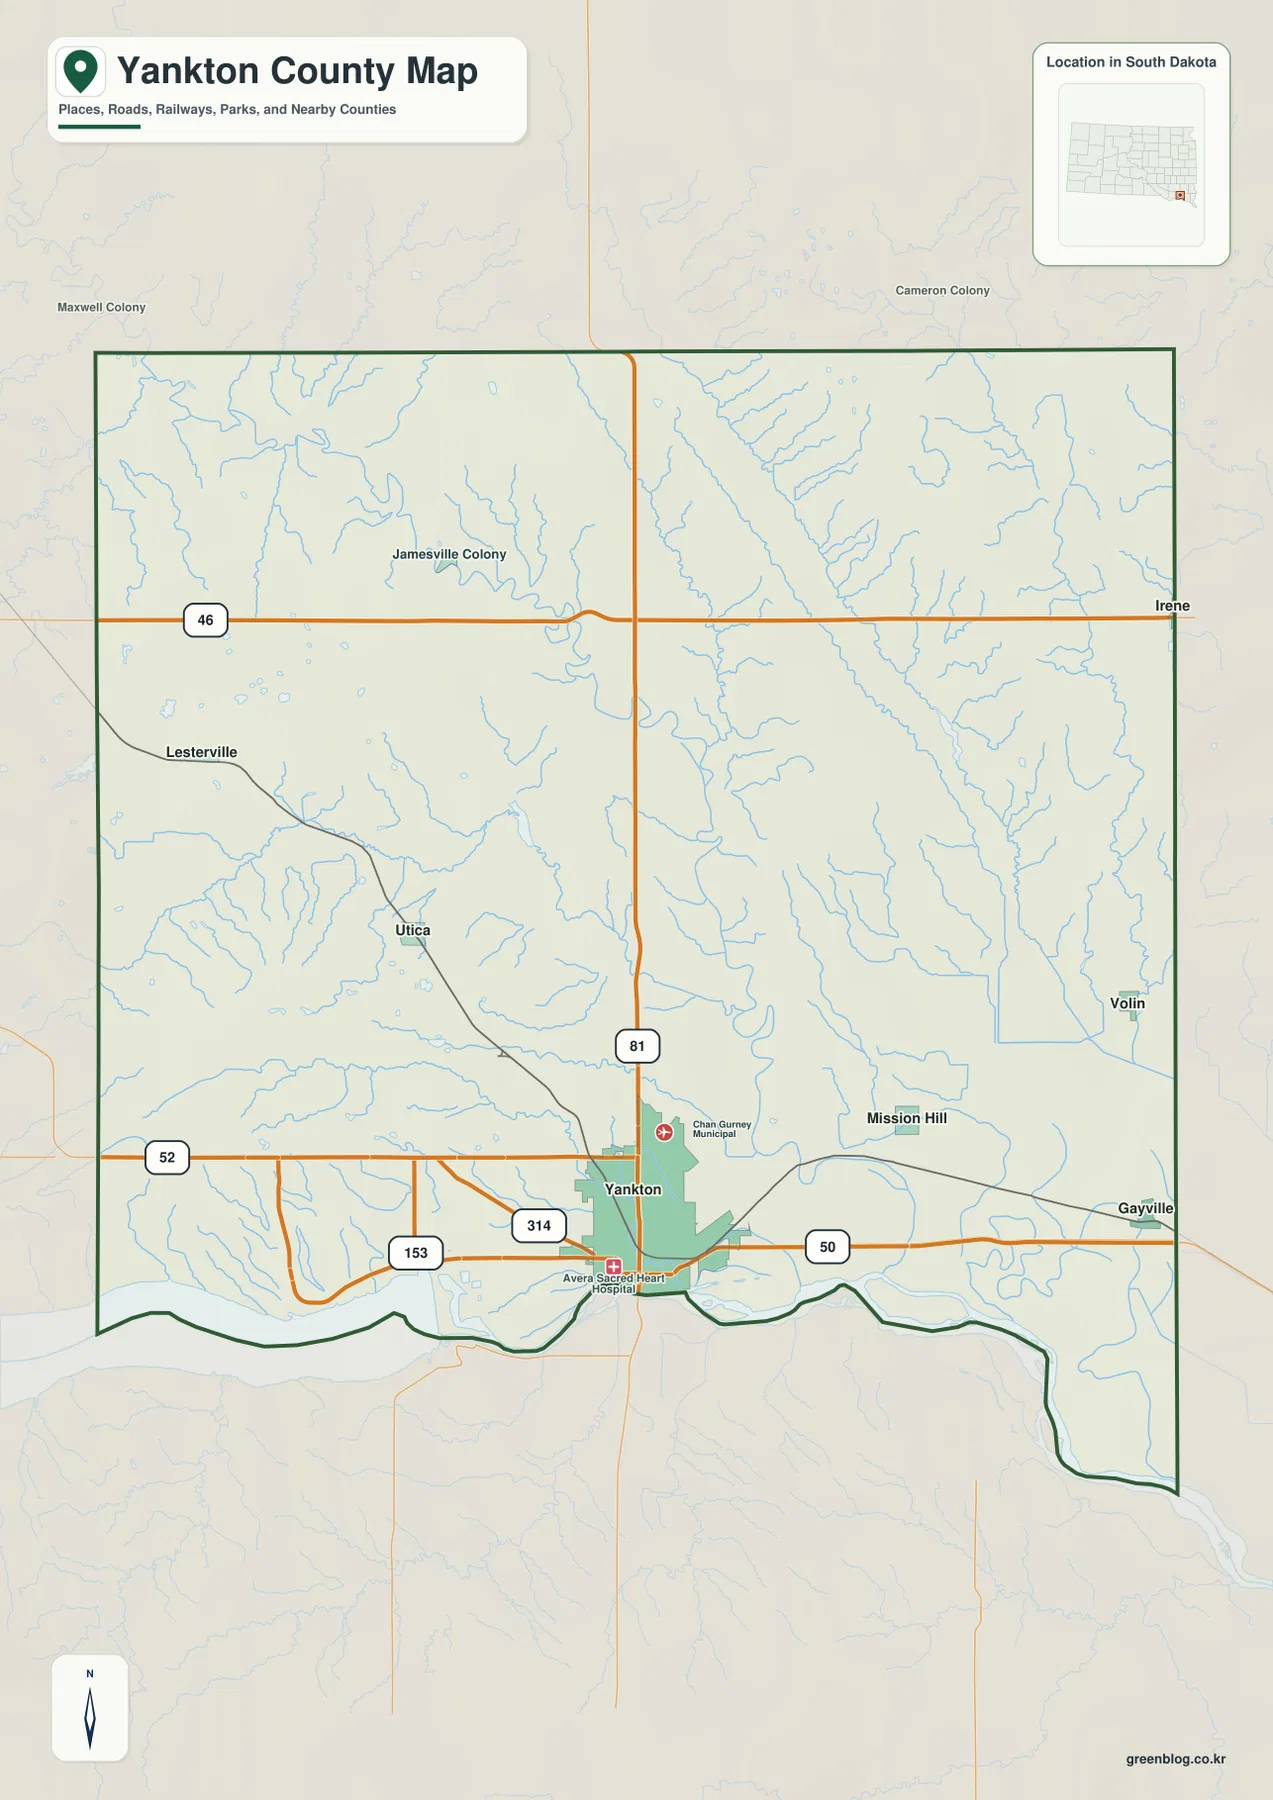
This is a regional reference map rather than a turn-by-turn navigation product. It is best used to answer broad location questions: where Yankton sits within the county, which direction Highway 81 travels, how Route 50 crosses the southern area, or where Mission Hill and Gayville are relative to the county seat area. Small local roads and individual properties are not the focus. If you need an address-level route, parcel boundary, or legal description, a current local or official mapping service should be used instead.
Where the six ranked communities are located
The city map highlights six communities with numbered markers: Yankton, Gayville, Mission Hill, Volin, Lesterville, and Utica. The index printed on the map lists Yankton at 15,540, Gayville at 519, Mission Hill at 200, Volin at 139, Lesterville at 91, and Utica at 68. Those figures should be understood as the values printed on this particular map, not as a promise that they are the latest population estimates. For current demographic statistics, consult a current Census source.
The pattern is easy to see even without focusing on the numbers. Yankton is in the southern part of the county, with Mission Hill and Gayville extending eastward. Volin sits farther northeast, while Lesterville and Utica occupy the western half. No ranked city marker appears across the broad northern portion of the county. That makes the city map especially useful when you want a clean comparison of settlement locations without the additional road labels and points of interest shown on the general map.
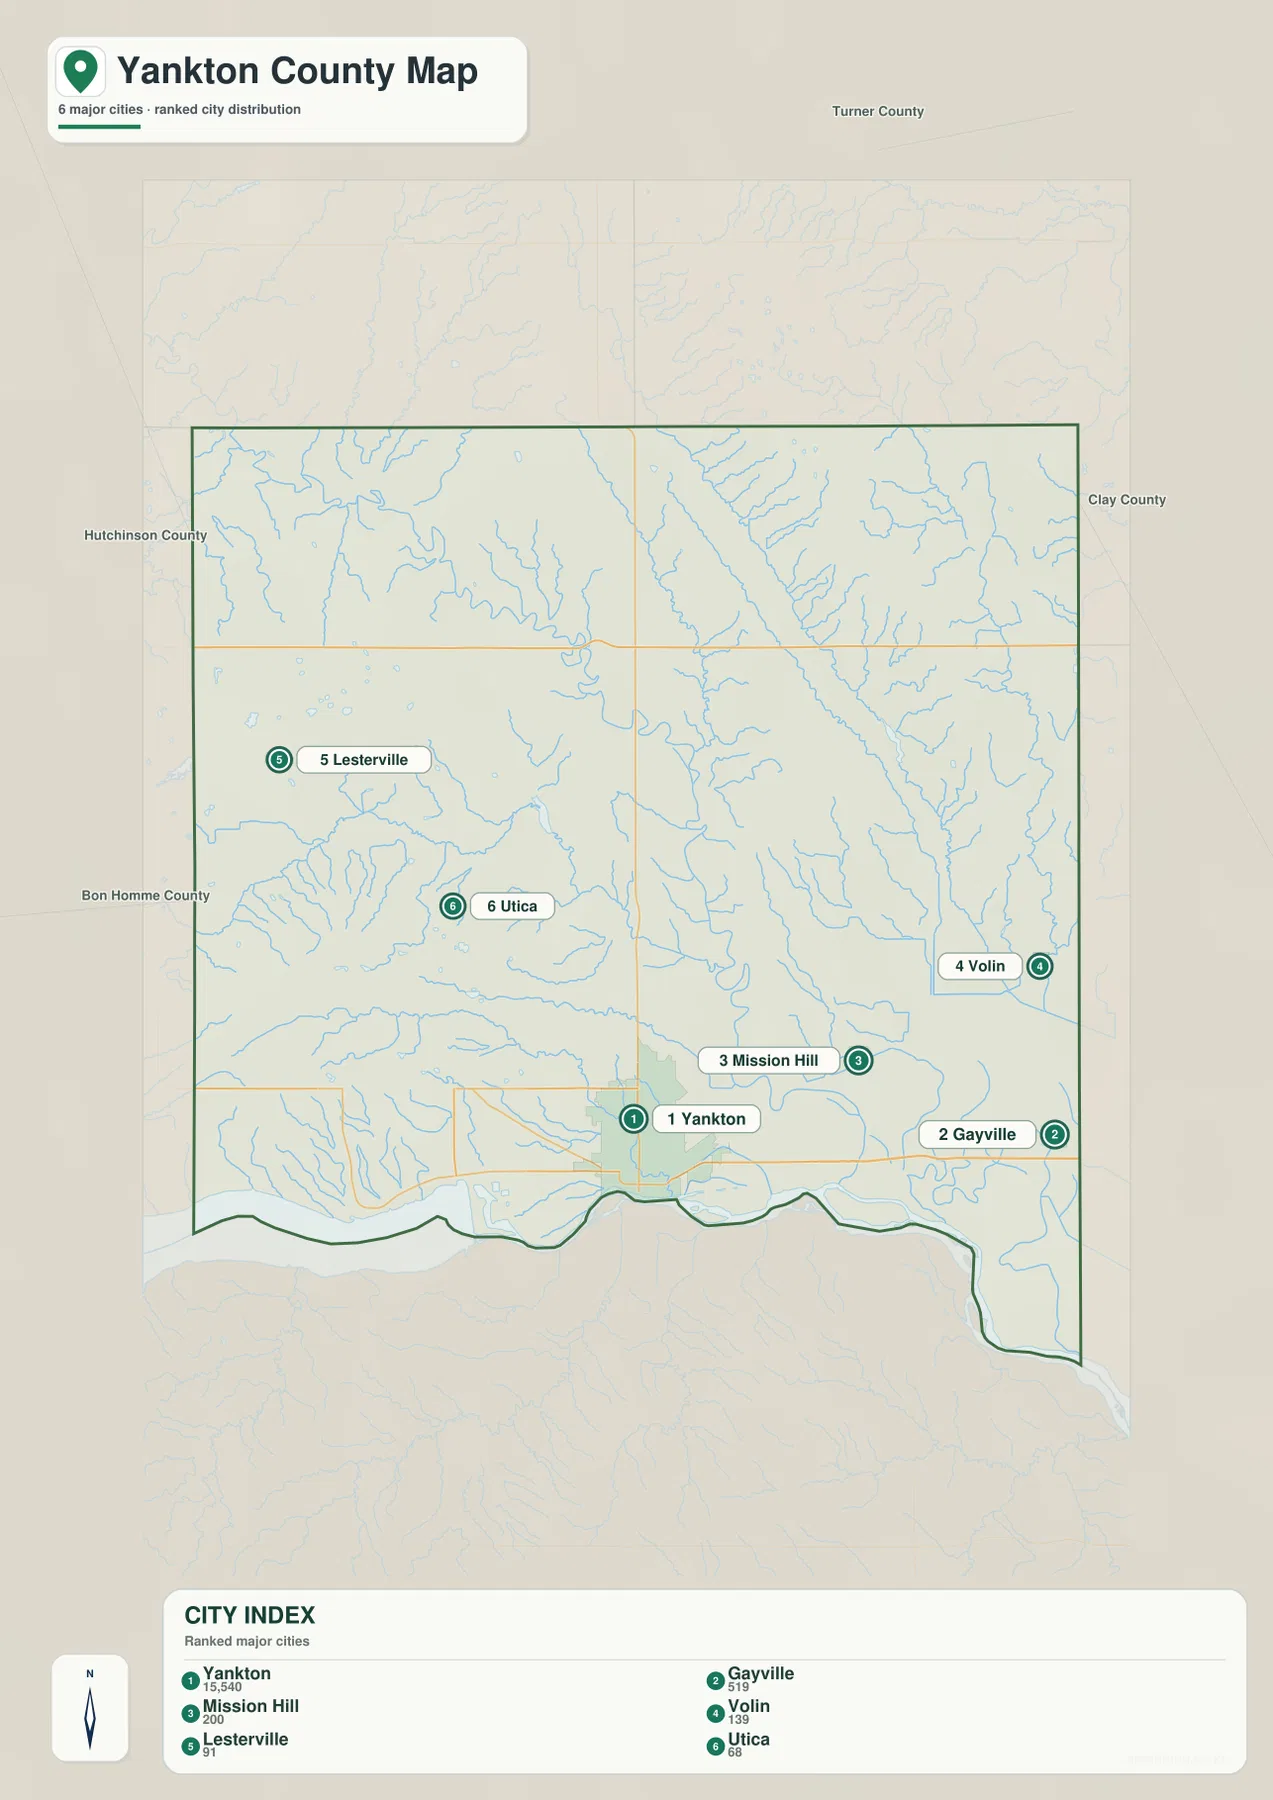
The surrounding county labels also help with orientation. Turner County is shown to the north, Clay County to the east, Hutchinson County to the west, and Bon Homme County to the southwest and west side. These labels make it easier to place Yankton County within southeastern South Dakota without needing a separate statewide map. The point locations should be read as relative positions. If a connector or point-to-point comparison is used, the distance is a straight-line map relationship rather than a driving route, and actual travel distance depends on the available roads.
The Missouri River, James River, creeks, and lakes
The terrain-and-water map gives the clearest picture of the county’s drainage features. The Missouri River runs along the southern edge, forming the strongest water feature on the page. The James River comes down through the central part of the county in a broad, winding course before reaching the Missouri River area. Seeing both rivers together explains why the southern border and the interior river valley stand out so clearly on the other maps.
Several smaller named features add detail. Prairie Creek appears in the northwest, Beaver Creek crosses the western side near Beaver Lake, and Marne Creek is labeled in the southwest. Farther east, the map labels Clay Creek, Turkey Creek, and smaller tributary lines. Guthmiller Lake appears in the north-central area, and Marindahl Lake is labeled farther east. Numerous unnamed or lightly labeled stream branches fill the spaces between the major channels, showing that the James River and Missouri River are part of a much denser network of local drainage.
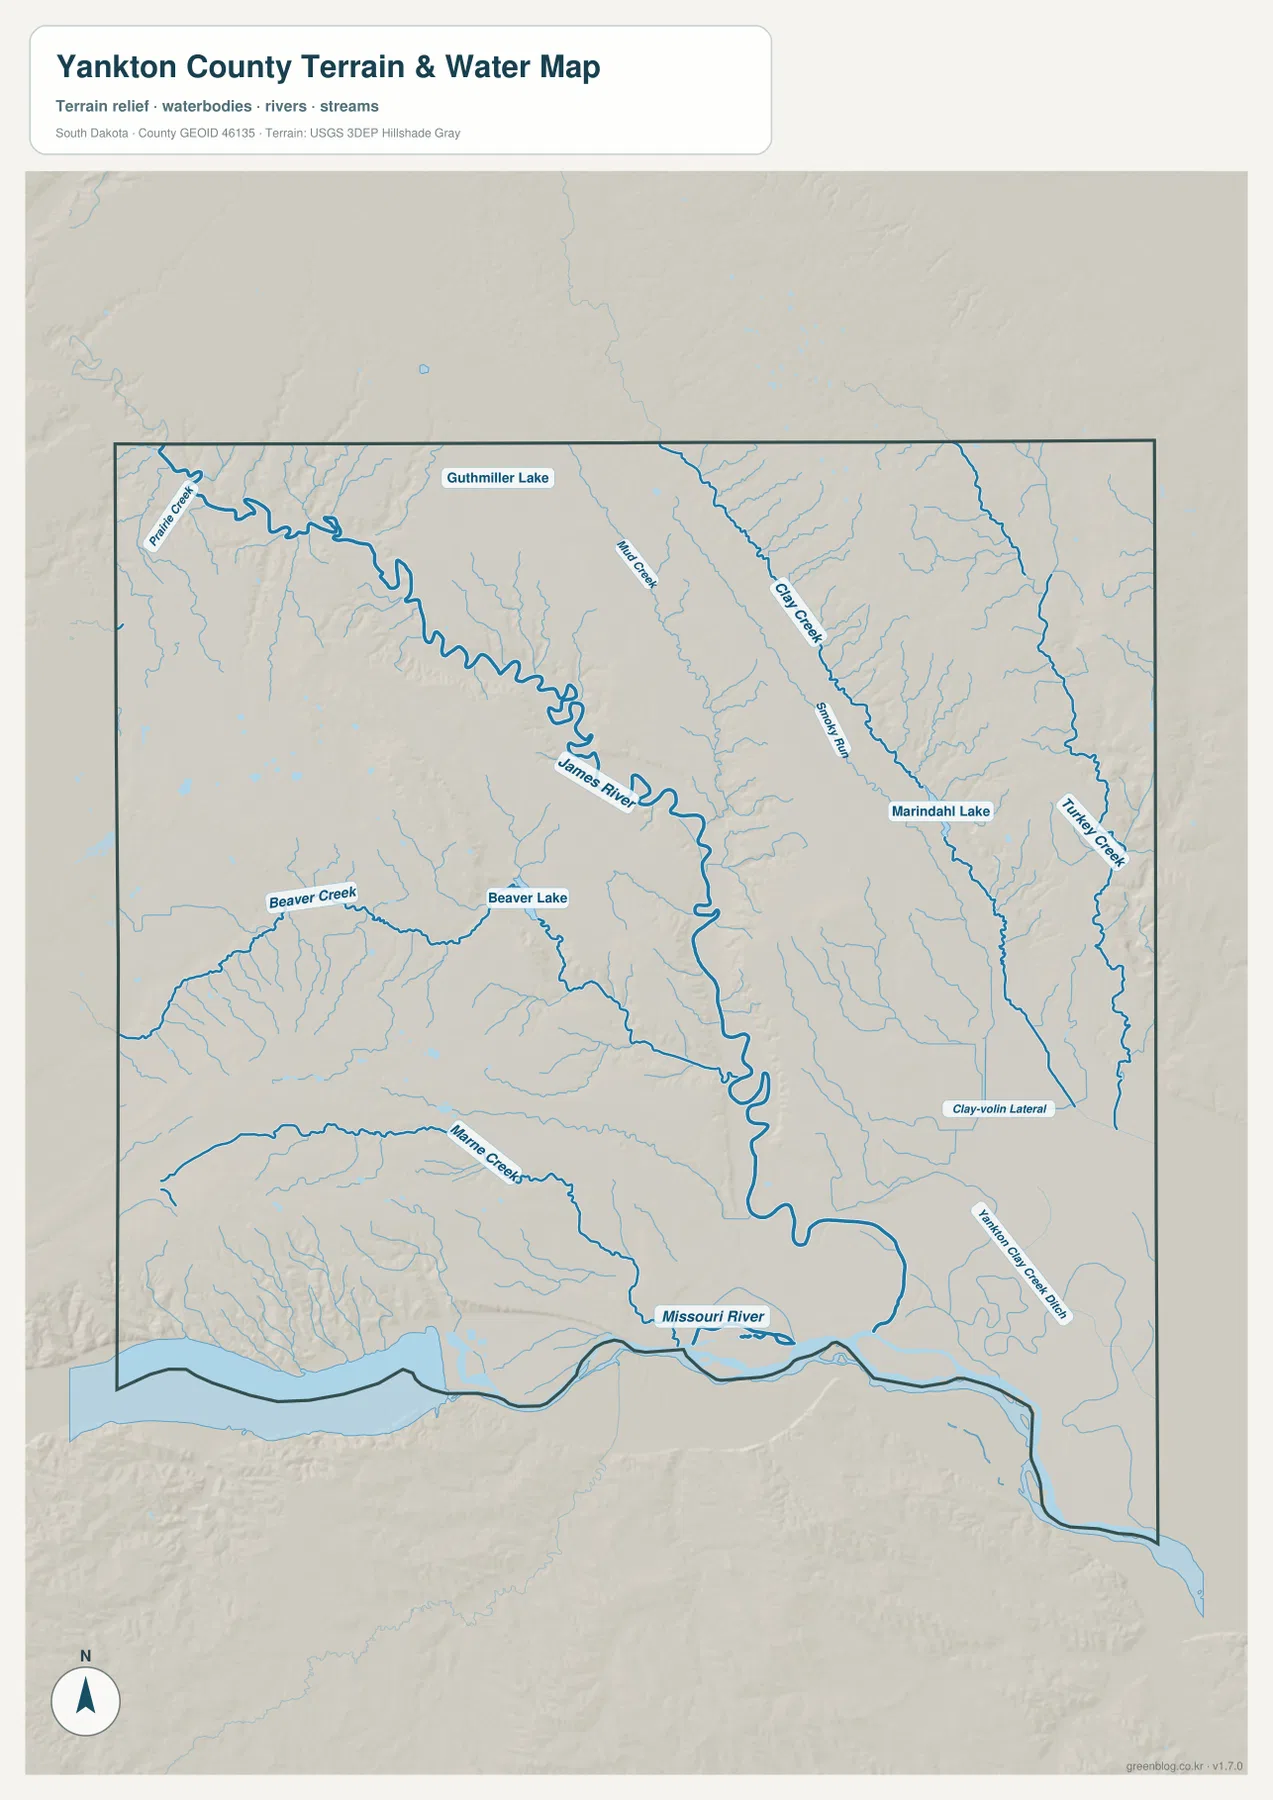
This water map is intended for geographic reference, not for flood-risk decisions, navigation, water depth, property boundaries, or legal water rights. River channels and shorelines can also change in appearance over time or with water conditions. Use an appropriate official source when safety, regulation, engineering, or property questions are involved. For ordinary map reading, however, this view is very useful for tracing the main rivers and seeing which smaller creeks feed into the broader system.
Elevation differences from the river lowlands to higher ground
The elevation map uses a locally scaled color range to make the county’s relief visible. Its legend reports an actual range of roughly 347 to 512 meters, with a mean of 406 meters. Darker green marks the lower terrain, and the colors shift through lighter greens and tan toward brown on higher ground. The lowest-looking zone follows the Missouri River in the south and extends northward along the James River valley, producing a clear branching lowland shape through the middle of the county.
Higher terrain is most obvious in the northeast, where a large brown area contrasts strongly with the river valley. Another elevated area appears in the southwest. Between these higher sections, the central part of the county contains broad green and light-green surfaces cut by darker drainage corridors. Comparing this image with the water map makes the relationship easier to understand: many streams occupy lower ground, while the higher ridges and uplands stand apart from the main river corridors.
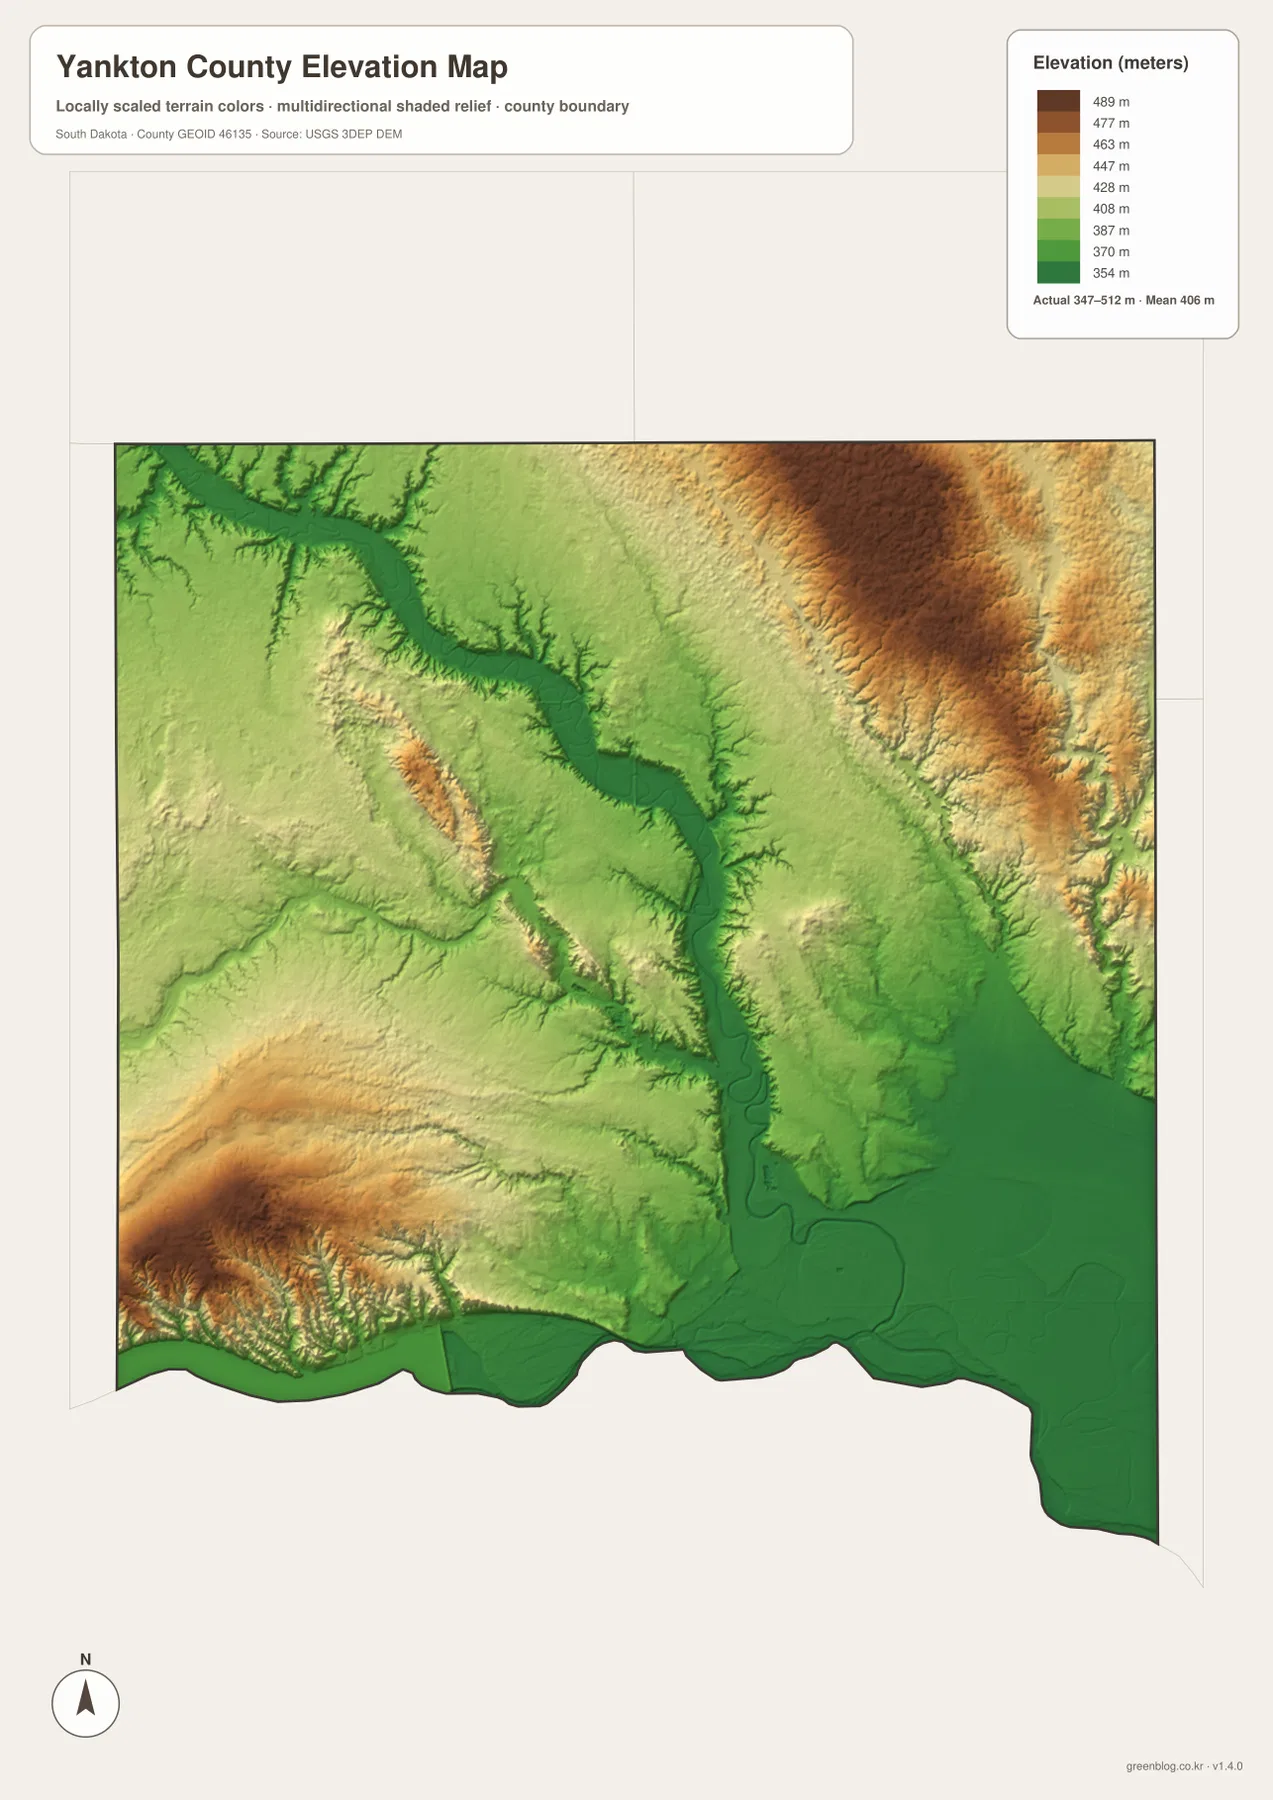
The elevation surface is generalized for county-scale viewing. It should not be treated as a survey-grade measurement for a particular house, road project, drainage design, or construction site. A point that appears within one color band can still have meaningful local variation that is not visible at this scale. When exact elevation is required, consult the original USGS elevation data or a professional survey. For general education and regional comparison, the map does a good job of showing how strongly the major river valleys differ from the county’s higher sections.
Choosing the most useful map for your task
Start with the general map when your main goal is orientation. It combines the county boundary, Yankton, surrounding communities, numbered roads, and many stream lines in one view. Switch to the city map when you want the labeled communities to stand out without extra detail. The water map is the better choice for following the Missouri River, James River, Beaver Creek, Turkey Creek, and other named waterways. For a discussion of terrain, valleys, or higher and lower parts of the county, the elevation map communicates those differences more clearly than the other versions.
For a class project, the general map and water map make a useful pair because one establishes the administrative area and transportation while the other emphasizes natural features. A local overview or presentation can add the city map to show where the six ranked communities are concentrated. The elevation image is helpful when explaining why the southern river corridor and northeastern high ground look different. If you plan to print any of these graphics, use the JPG files in the ZIP rather than enlarging the smaller WebP previews from the page.
Download the high-resolution map files
The download package contains the high-resolution JPG counterparts of the maps shown on this page. Each map is a separate file, so you can keep only the county overview, city view, water-and-terrain view, or elevation view you need. This is convenient for printing, inserting a map into a document, or zooming in on labels that may look small in the browser preview.
Important limits of these reference maps
Each map simplifies the county for a specific purpose. The general map does not show every local street or parcel. The city index reports the values printed on the supplied city graphic, which may not match a later population estimate. The water layer shows geographic features but does not predict flooding or define regulated water boundaries. The elevation layer emphasizes broad changes in height rather than exact point elevations. Keeping those limits in mind helps prevent a convenient reference map from being used for a decision that requires more precise source data.
These limits do not reduce the usefulness of the collection for ordinary reference. Together, the maps give a compact picture of where Yankton lies, how several major routes cross the county, where the smaller communities are located, how the James River meets the wider Missouri River system, and where the terrain rises away from the main lowlands. For many readers, that combination is more useful than a single highly detailed map because each view keeps one kind of information readable.
Frequently Asked Questions
What file format is included in the Yankton County download?
The ZIP contains four high-resolution JPG files: the general county map, city map, terrain-and-water map, and elevation map. The images displayed inside the article are WebP previews intended for faster viewing in a browser.
Which map should I use to find the Missouri River and James River?
Use the terrain-and-water map. It labels the Missouri River along the southern edge and the James River through the central part of the county, along with several creeks, lakes, and smaller tributaries.
Can the elevation map be used as an exact survey?
No. The map is designed to compare broad elevation differences across the county, with a displayed range of about 347 to 512 meters. Exact site elevations for engineering, construction, or legal purposes should come from original elevation data or a professional survey.
Map File Information
Download the Yankton County map set as a ZIP containing the original high-resolution JPG images.
- Included Files: Use only the versions confirmed in the article and supplied images
- File Type: Use the confirmed download contents
- Intended Use: Printing, education, presentations, and map-based projects
Related Maps
Sources and reference data
- U.S. Census Bureau TIGER/Line Shapefiles – official geographic boundary and mapping data.
- USGS National Hydrography – official information and data resources for rivers, streams, and other hydrographic features.
- USGS 3D Elevation Program – official elevation program information and access to elevation data.
Green Map creates custom-edited map images using open geographic data sources such as geoBoundaries, Natural Earth, OpenStreetMap, and government open data.
These maps are edited visual materials, not raw data files, and are provided for education, documents, presentations, and graphic reference.