Natural gas occupies very different positions in national power systems. This article uses World Bank World Development Indicators series EG.ELC.NGAS.ZS to compare the share of total electricity production generated from natural gas in a common reference year, 2021. The indicator answers a composition question: how much of each country or economy’s electricity mix came from natural gas. It does not rank gas reserves, gas production, LNG trade, installed gas-fired capacity, or the absolute number of terawatt-hours produced from gas.
The verified 2021 file contains 217 World Bank country/economy master rows. Numeric observations are available for 209, while eight remain missing. Treating each numeric observation equally, the simple mean is 21.5% and the median is only 3.1%. That large gap is informative: many systems report zero or low gas shares, while a smaller upper group relies on gas for most of its electricity. A single average therefore hides the shape of the distribution.
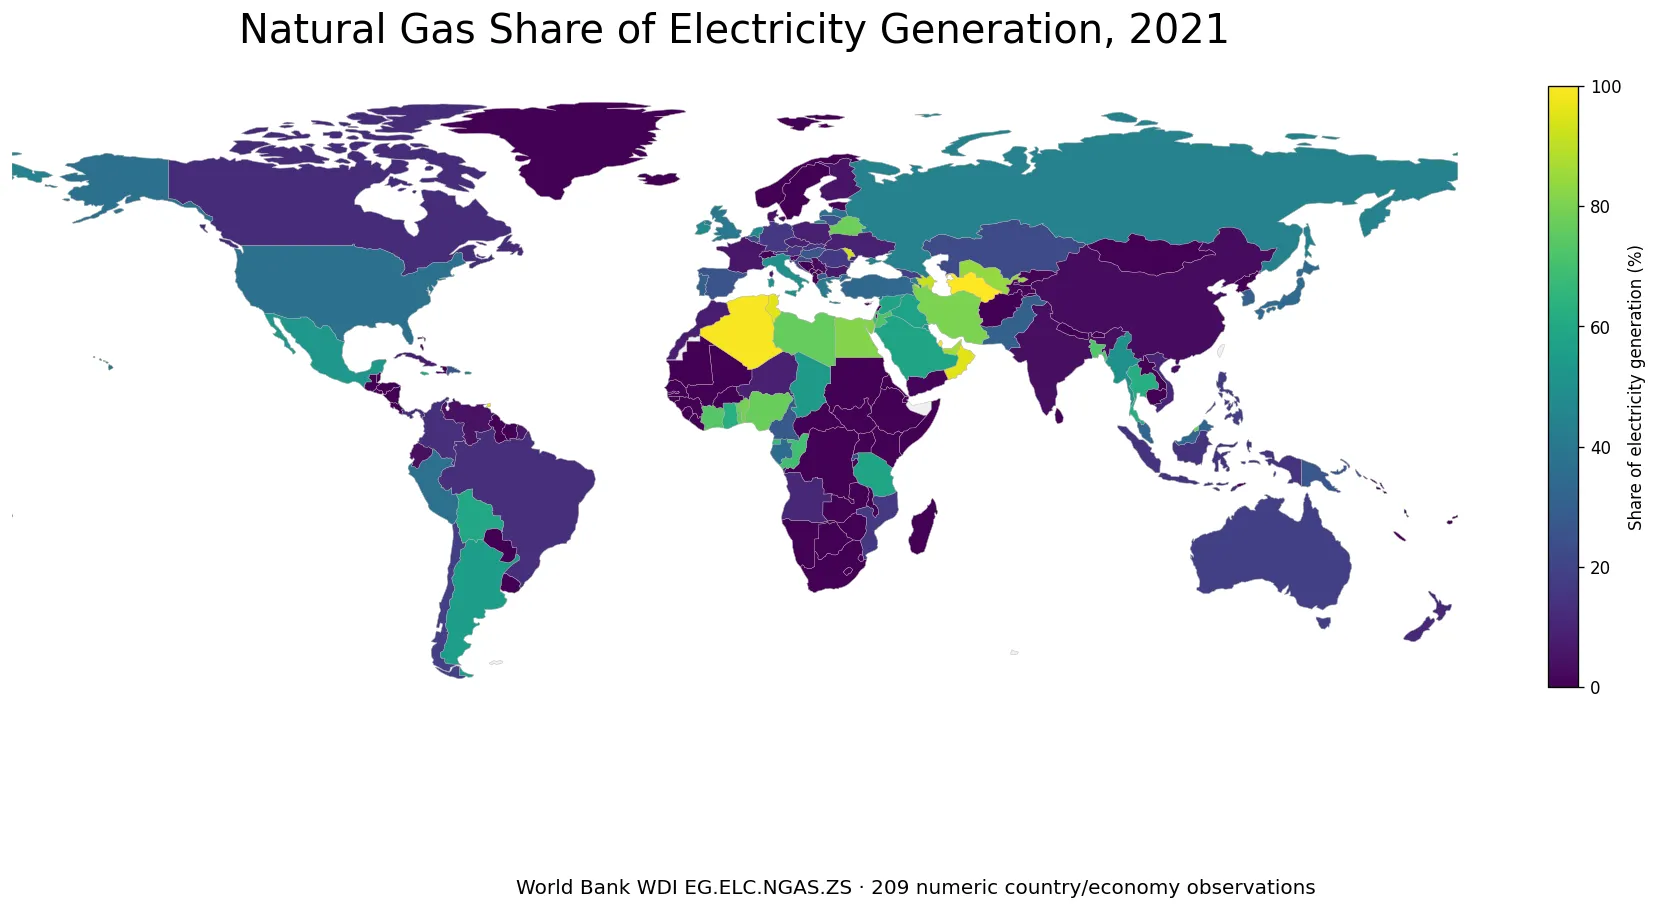
Table of Contents
Ninety observations are at 0%, while 41 are above 50%
The distribution is split between a large low-gas group and a much smaller set of gas-dominant power systems. Exactly 90 of the 209 numeric observations are 0.0%, or 43.1%. Another 31 are above zero but no higher than 10%. Together, 121 observations, or 57.9% of the numeric set, are at 10% or below. At the other end, 41 are at least 50%, 22 are at least 75%, and 10 reach 90% or more.
| 2021 natural gas share | Countries/economies | Share of 209 |
|---|---|---|
| 0% | 90 | 43.1% |
| >0–10% | 31 | 14.8% |
| >10–25% | 22 | 10.5% |
| >25–50% | 25 | 12.0% |
| >50–75% | 19 | 9.1% |
| >75–100% | 22 | 10.5% |
The first quartile is 0.0%, the median is 3.1%, and the third quartile is 36.4%. In other words, half of the country/economy observations are at or below 3.1%, yet the upper quarter extends well into double digits and the top of the distribution approaches 100%. The 21.5% simple mean is therefore much higher than the median. It should not be described as the natural-gas share of world electricity because every economy receives the same statistical weight in this calculation. A generation-weighted global share requires total electricity production for each economy.
Qatar, Turkmenistan and Bahrain sit at the top of the 2021 distribution
Qatar reports 100.0% in the verified 2021 file. Turkmenistan is almost identical at 99.98%, followed by Bahrain at 99.9%, Trinidad and Tobago at 99.5%, and Algeria at 99.0%. Tunisia and Oman are both above 95%, while Singapore is 93.9%, Moldova 92.9%, and Azerbaijan 91.9%. These values indicate that natural gas accounted for nearly all electricity production in those observations during the reference year.
| Country or economy | Natural gas share in 2021 |
|---|---|
| Qatar | 100.0% |
| Turkmenistan | 100.0% |
| Bahrain | 99.9% |
| Trinidad and Tobago | 99.5% |
| Algeria | 99.0% |
| Tunisia | 95.8% |
| Oman | 95.6% |
| Singapore | 93.9% |
| Moldova | 92.9% |
| Azerbaijan | 91.9% |
This ranking is not a ranking of natural-gas production or reserves. A small electricity system can have a 95% gas share while producing far fewer gas-fired terawatt-hours than a much larger system with a 30% or 40% share. Conversely, a large power market can generate a substantial absolute amount of gas-fired electricity but have a moderate share because coal, nuclear, hydro, wind, solar, or other sources are also large.
South Korea is 30.6%, near the United States and Japan but far above China and India
South Korea reports 30.6% in 2021. Sorting the 209 numeric observations from highest to lowest places Korea 58th. The United States is 37.4% and Japan 34.2%, both somewhat higher. The United Kingdom is 40.0% and Russia 44.3%. Mexico at 53.1%, Argentina at 55.2%, and Saudi Arabia at 58.4% are all above the halfway mark.
China is much lower at 3.1% and India at 3.8%. France is 6.0%, Canada 12.3%, and Germany 16.4%. The selected economies illustrate why a gas-share map is useful: large power markets can occupy very different positions on the same 0–100% scale. Those differences describe the role of gas inside each national electricity mix, not absolute gas consumption.
| Selected economy | Natural gas share in 2021 |
|---|---|
| United Arab Emirates | 86.6% |
| Bangladesh | 72.9% |
| Saudi Arabia | 58.4% |
| Argentina | 55.2% |
| Mexico | 53.1% |
| Italy | 49.8% |
| Russian Federation | 44.3% |
| United Kingdom | 40.0% |
| United States | 37.4% |
| Japan | 34.2% |
| Korea, Rep. | 30.6% |
| Germany | 16.4% |
| Canada | 12.3% |
| France | 6.0% |
| India | 3.8% |
| China | 3.1% |
A reported 0% is not the same thing as a missing value
The 90 observations recorded as exactly 0.0% are real numeric values and remain in all distribution calculations. The eight missing 2021 rows are Bermuda, Channel Islands, Isle of Man, Liechtenstein, Macao SAR China, Monaco, Northern Mariana Islands, and San Marino. They remain missing rather than being converted to zero or backfilled from an earlier year. That preserves the common-year comparison.
The map introduces a separate visualization issue. The statistical file contains 209 numeric observations, but the low-resolution Natural Earth boundary layer directly colors 170 polygons after ISO-3 matching. Some small islands and separately reported territories can have valid statistical observations without a visible polygon at this scale. A place that is hard to see on the map should therefore not automatically be interpreted as either zero or missing.
A high percentage does not mean a high absolute amount of gas-fired electricity
A percentage indicator is useful because it normalizes countries of very different sizes to the same 0–100% scale. The trade-off is that it removes information about the size of the electricity system. A small system at 90% can produce less gas-fired electricity in absolute terms than a very large system at 35%. Comparing gas-fired generation in TWh or GWh requires total electricity production and fuel-specific generation volumes.
The same limitation applies to gas consumption, LNG imports, fuel prices, installed capacity and power-sector emissions. None of those quantities can be ranked from EG.ELC.NGAS.ZS alone. This map is designed to answer where natural gas occupied a large or small share of electricity production in 2021, not every question about a country’s gas economy.
Natural gas share is not an electricity carbon-intensity metric
Natural gas is a fossil fuel, so the indicator is relevant to power-sector transition analysis, but the percentage is not the same as carbon intensity. Two countries with the same gas share can have very different remaining generation mixes, plant efficiencies, total output and emissions profiles. A low gas share also does not tell us whether the remainder came primarily from coal, nuclear, hydro, wind, solar or another source.
For that reason, the map should be read as a composition layer. Explaining why a country’s gas share is high, whether gas replaced coal, or whether renewables displaced gas requires additional fuel-specific indicators and preferably a multi-year time series. The current dataset alone supports the 2021 cross-sectional comparison, not a causal explanation.
Why the comparison holds every observation to 2021
Using each country’s most recent observation can mix different years and make time differences look like geographic differences. This package instead fixes every displayed comparison to 2021. Numeric coverage remains broad at 209 of 217 country/economy master rows, so the article can compare countries on the same time reference without filling missing values from other years.
This is a deliberate consistency choice rather than a claim that 2021 is the newest possible year for every economy. When a later common year reaches similarly broad coverage, a follow-up comparison can place the two years side by side and measure which power systems increased or reduced the role of natural gas.
Data definition, source and map construction
The statistical source is World Bank World Development Indicators series EG.ELC.NGAS.ZS, labeled “Electricity production from natural gas sources (% of total).” The World Bank indicator page identifies the IEA Energy Statistics Data Browser as the underlying source. This article uses the verified 2021 observations without imputation, excludes aggregate region rows, and preserves missing values.
The world map was created from the bundled country values by joining verified ISO-3 identifiers to a low-resolution Natural Earth country boundary layer. All means, medians, quartiles, band counts and rankings in the article were calculated directly from the cleaned CSV. No article or blog ranking was copied, and the dataset was not supplemented with estimated values.
Frequently Asked Questions
What was South Korea’s natural gas share of electricity generation in 2021?
World Bank WDI EG.ELC.NGAS.ZS reports 30.6% for South Korea in 2021. It ranks 58th when the 209 numeric country/economy observations are sorted from highest to lowest.
What does a natural gas electricity share near 100% mean?
It means natural gas accounted for nearly all electricity production in that country or economy during the reference year. It does not mean the country has the world's largest gas reserves, gas production or gas consumption.
Is a reported 0% the same as missing data?
No. A 0% value is a real numeric observation and is included in the distribution. Eight 2021 rows are missing and were kept as missing rather than replaced with zero or an earlier-year value.
Is the 21.5% simple mean the natural-gas share of world electricity?
No. It is an unweighted mean across 209 country/economy observations. A global electricity share requires weighting countries by their total electricity generation.
Related Maps
Green Map creates custom-edited map images using open geographic data sources such as geoBoundaries, Natural Earth, OpenStreetMap, and government open data.
These maps are edited visual materials, not raw data files, and are provided for education, documents, presentations, and graphic reference.