The Hendricks County Indiana Land Cover Map set makes the county’s east–west contrast easy to see. Agriculture covers 62.13% of the county in the 2025 summary, yet the eastern side contains a large concentration of developed cover. Forest accounts for 10.54% and appears in scattered blocks and narrow, branching areas that are especially noticeable through the rural west and along stream corridors. The result is a county where a heavily developed suburban edge sits beside a broad agricultural interior.
Four views are included here: 2025 land cover, forest and farmland, impervious surface, and a 1985–2025 class-difference map. The web images are designed for quick viewing, while the four original JPG maps are available together in one ZIP download. Each view answers a different practical question, so the sections below explain what to look for before using the files for printing, teaching, planning context, or local landscape comparison.
Table of Contents
Start with the sharp divide between the suburban east and rural west
Hendricks County’s 2025 summary lists agriculture at 62.13%, developed land at 26.69%, forest at 10.54%, water at 0.31%, and wetlands at 0.16%. Agriculture is clearly the largest class countywide, but it does not dominate every part of the map. The broadest developed areas are concentrated in the east, while large agricultural blocks remain much more common across the western half. Forest breaks up both settings in smaller patches and along irregular corridors.
The county’s official Comprehensive Plan identifies Brownsburg in the northeast, Avon on the eastern side, Plainfield in the southeast, and Danville near the middle of the county. Read beside that planning map, the NLCD pattern is easy to orient: the large eastern developed area lines up with the part of Hendricks County containing Brownsburg, Avon, and Plainfield, while Danville forms a smaller developed center farther west. The land-cover map does not draw municipal boundaries, so the colored edges should not be treated as town limits.
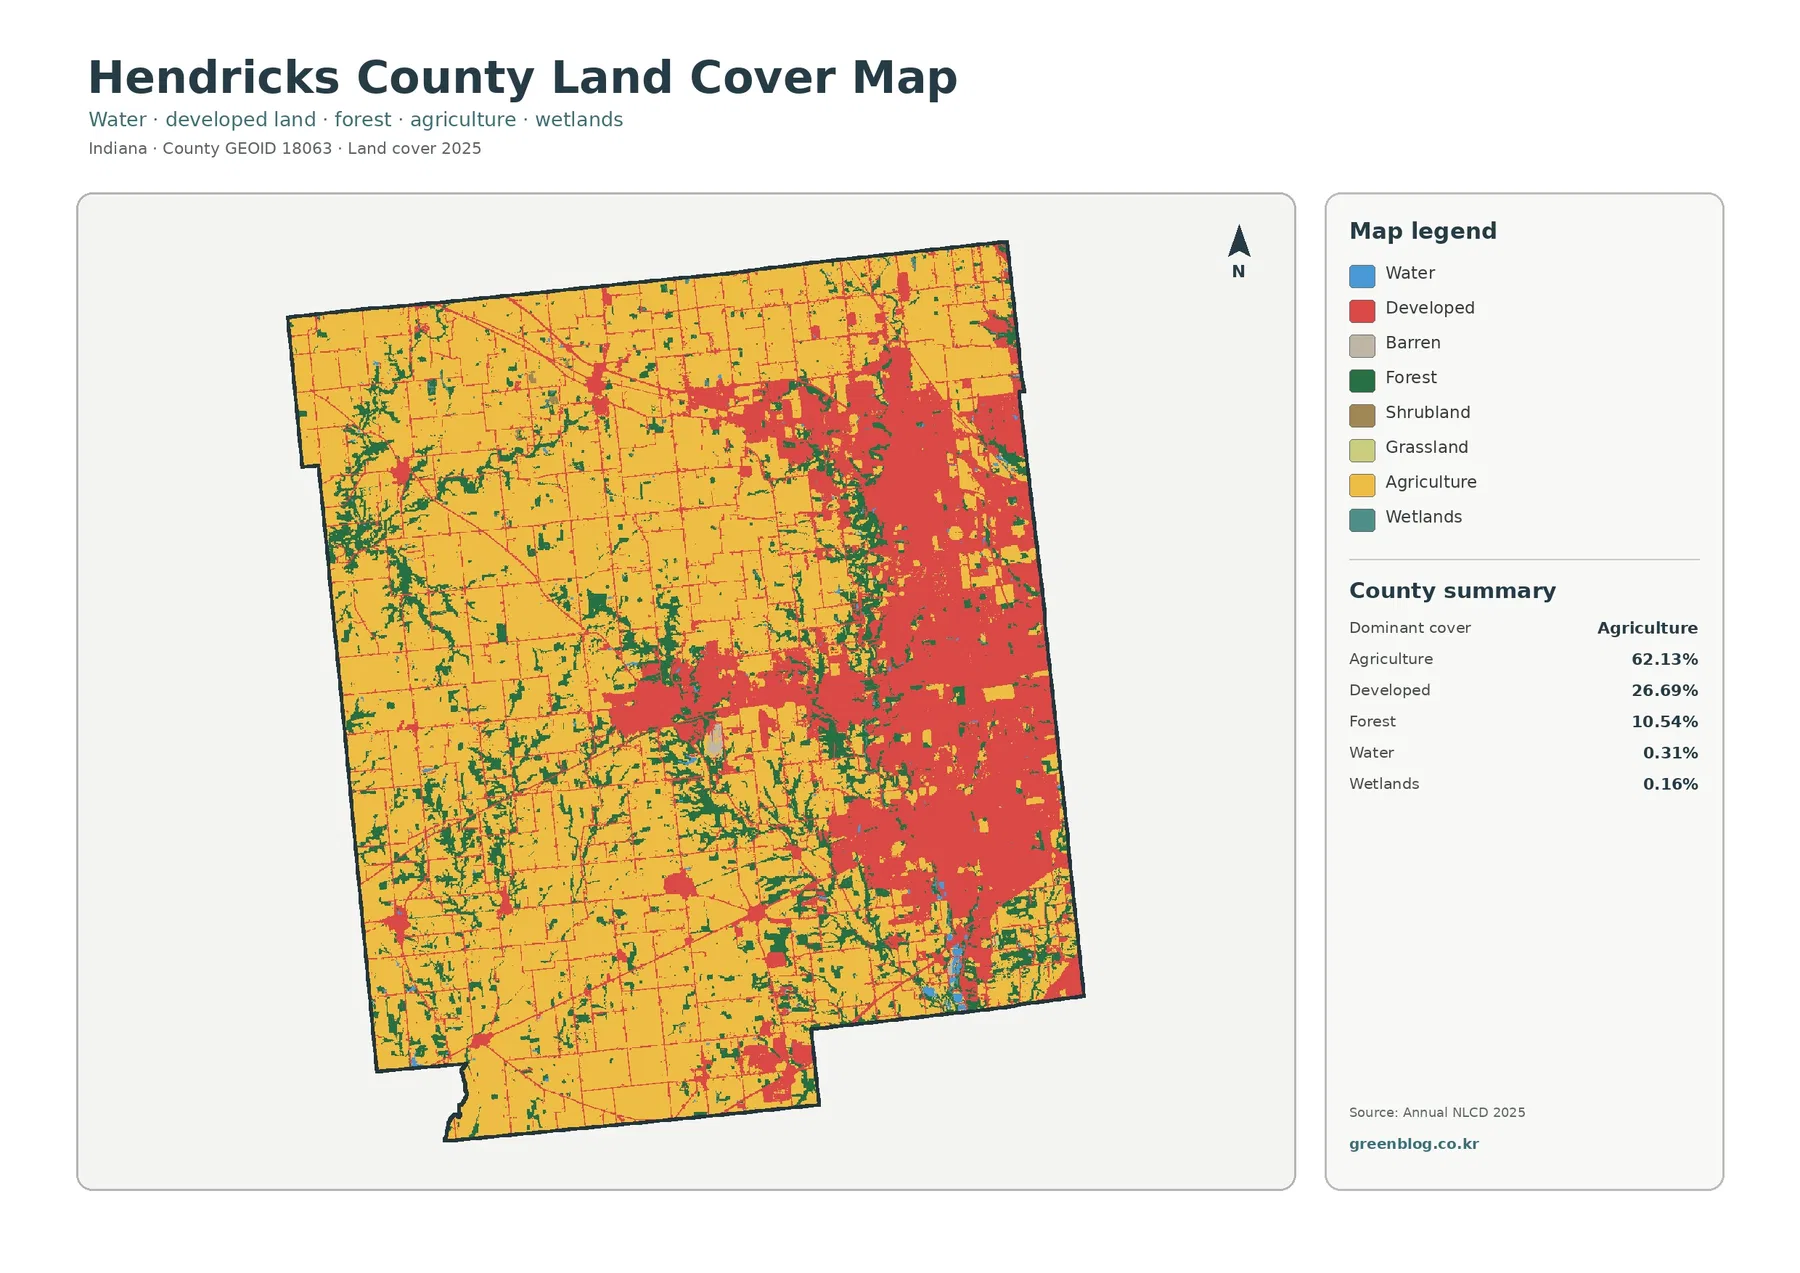
The eastern half contains broad red developed patches mixed with smaller areas of agriculture and forest. Moving west, the red areas become smaller and more isolated while agricultural cover becomes the dominant visual element. Danville stands out as a developed center surrounded by farms and wooded strips rather than as part of the large eastern concentration. That pattern is useful when a reader wants to compare the Indianapolis-facing side of the county with its more rural interior without relying on municipal statistics.
Developed land should not be read as pavement alone. Annual NLCD developed classes can include lawns, trees, and other pervious surfaces within built environments. A subdivision can therefore appear as developed cover even though a large share of its ground still absorbs water. The impervious map later in this page separates that question by focusing more directly on rooftops, roads, parking areas, and other hard surfaces.
Stream corridors add wooded lines to a farm-dominated landscape
Much of western Hendricks County looks agricultural at first glance, but the forest is not randomly scattered. Green cover often forms irregular strips and branching shapes through the farm landscape. The Hendricks County Comprehensive Plan specifically calls out Big Walnut Creek, White Lick Creek, and the West Fork of White Lick Creek as community natural resources, noting the value of tree-lined riparian areas along waterways. Those official references provide useful context for the wooded stream corridors visible across the county maps.
A land-cover image cannot identify every creek by name, and a green strip should not automatically be assigned to one watershed without a hydrography layer. Still, the pattern matters. Large rectangular agricultural blocks are interrupted by narrow woods, small forest patches, and occasional water or wetland cells. These features create a more varied rural landscape than the 62.13% agriculture figure alone suggests.
Water represents 0.31% and wetlands 0.16% in the county summary. Those percentages are small because narrow creeks, ponds, and wet areas occupy limited area at county scale. Their small share does not mean they are unimportant for watershed study. For projects focused on drainage, habitat, or stream buffers, the land-cover map is best used as a starting layer and paired with detailed hydrography, elevation, soils, and local drainage information.
The forest-and-farmland view removes the urban distraction
The forest and farmland map simplifies the landscape so the rural cover types are easier to compare. Its summary repeats the major 2025 values for forest at 10.54% and agriculture at 62.13%, with water at 0.31%, grassland at 0.05%, shrubland at 0.05%, and wetlands at 0.16%. Developed and other classes are shown in a light neutral tone rather than competing with the farm and forest colors.
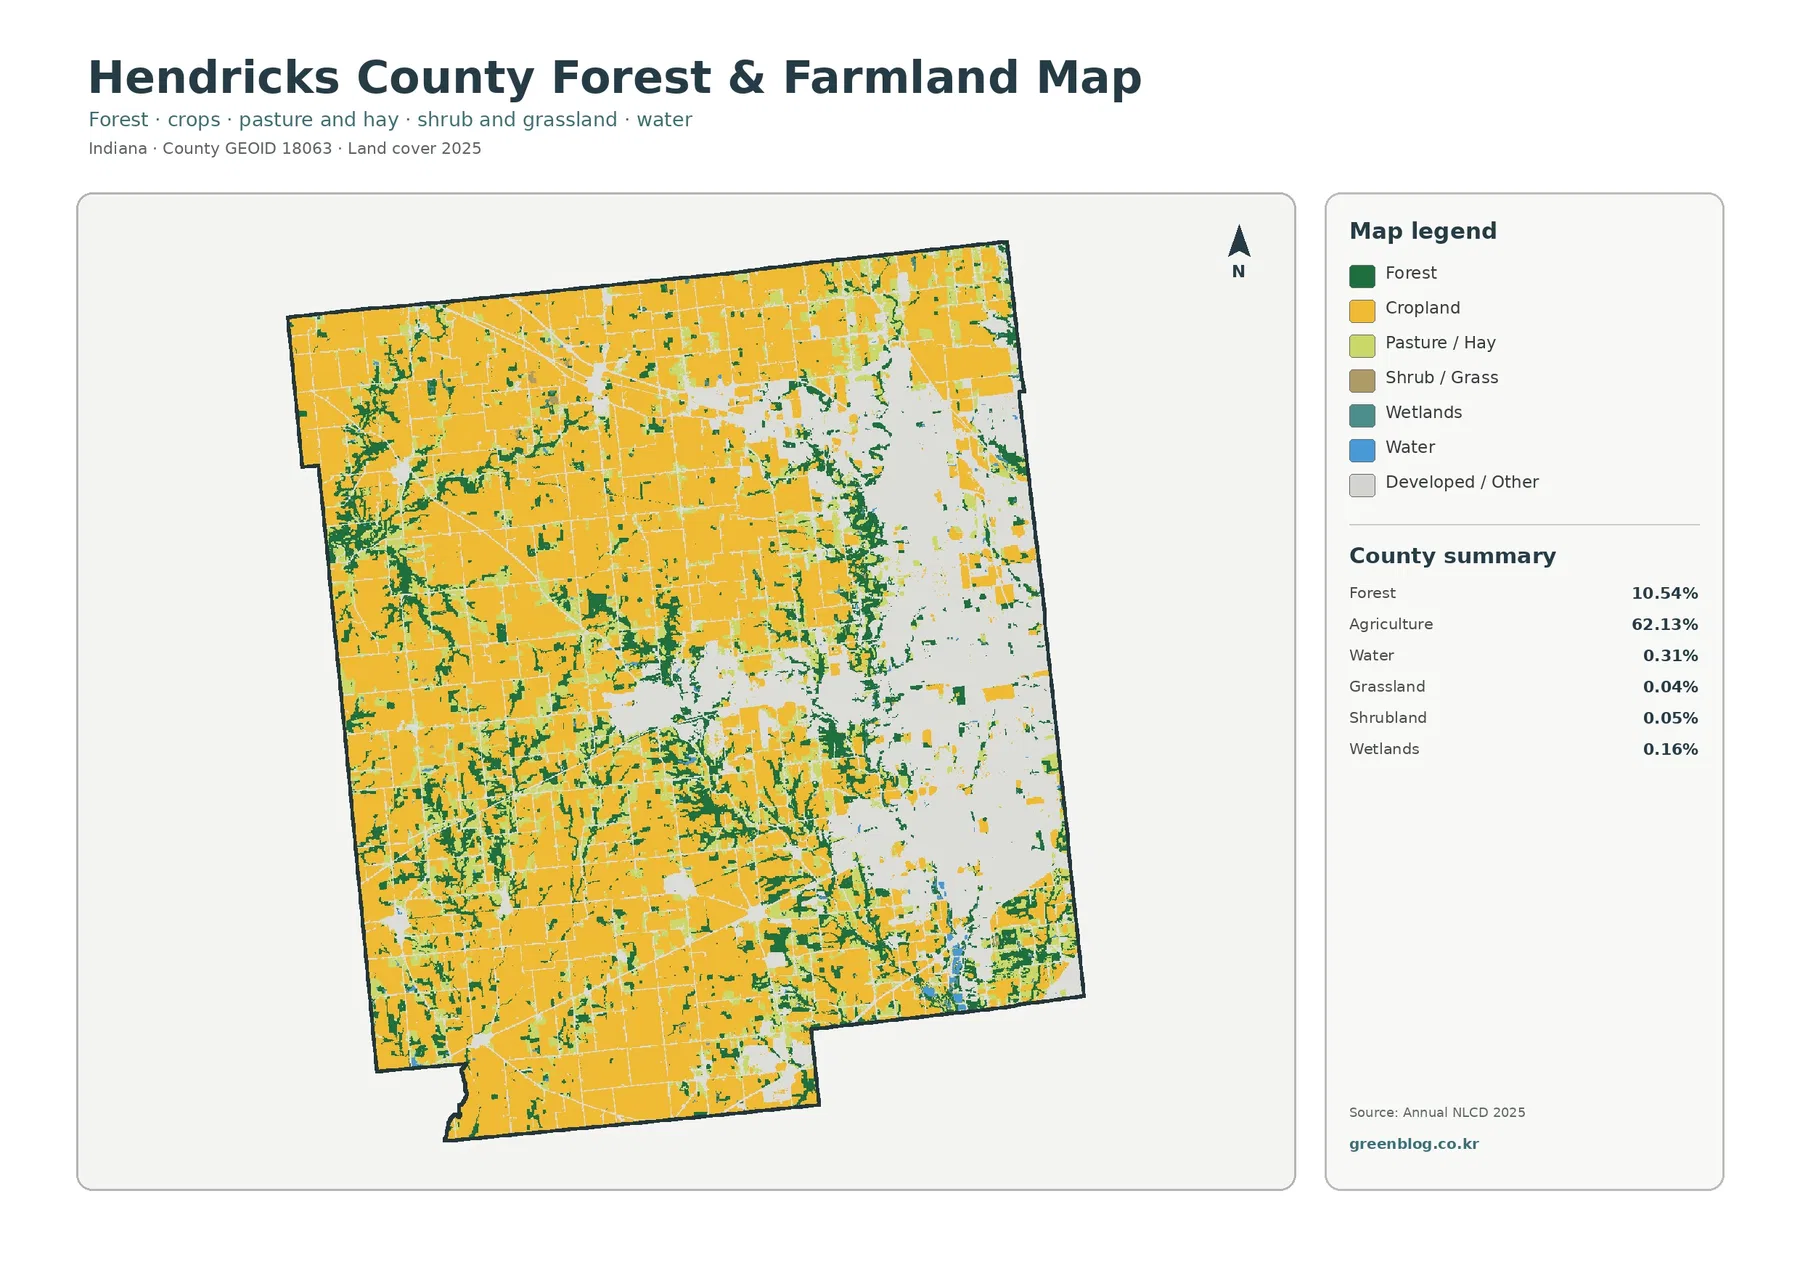
This simplified view is particularly helpful west of Danville, where agriculture fills large portions of the map but forest still follows irregular paths through the fields. A standard land-cover map can make those smaller wooded areas harder to notice because many classes compete for attention. Here, the green forest is easier to follow against cropland, making the map suitable for lessons or presentations about how tree cover persists within an agricultural county.
The eastern suburban area appears mostly as light developed/other space. That is a useful limitation rather than a flaw: the map is not intended to show the internal detail of Brownsburg, Avon, or Plainfield. Instead, it answers a different question—where do forest and farmland remain around and between the developed areas? It also makes the rural edge around Danville easier to inspect because farms, woods, and built land are separated into fewer visual groups.
Forest color is not an ownership layer. A wooded area can be private land, public land, a narrow riparian strip, or a larger stand of trees. Likewise, cropland color is a land-cover classification rather than a zoning label or parcel boundary. Anyone making a property, conservation, or development decision should verify the location with county GIS and legal records rather than relying on the colored raster cells.
Impervious cover exposes the hard-surface core of the eastern suburbs
Impervious surface means ground where water has difficulty soaking in, such as rooftops, paved roads, parking lots, and other hard surfaces. Hendricks County’s 2025 mean impervious value is 9.58%, and 7.68% of the county is mapped above 50% impervious. Those values are lower than the 26.69% developed-land share because developed classes can contain substantial lawns, trees, and other surfaces that still absorb rainfall.
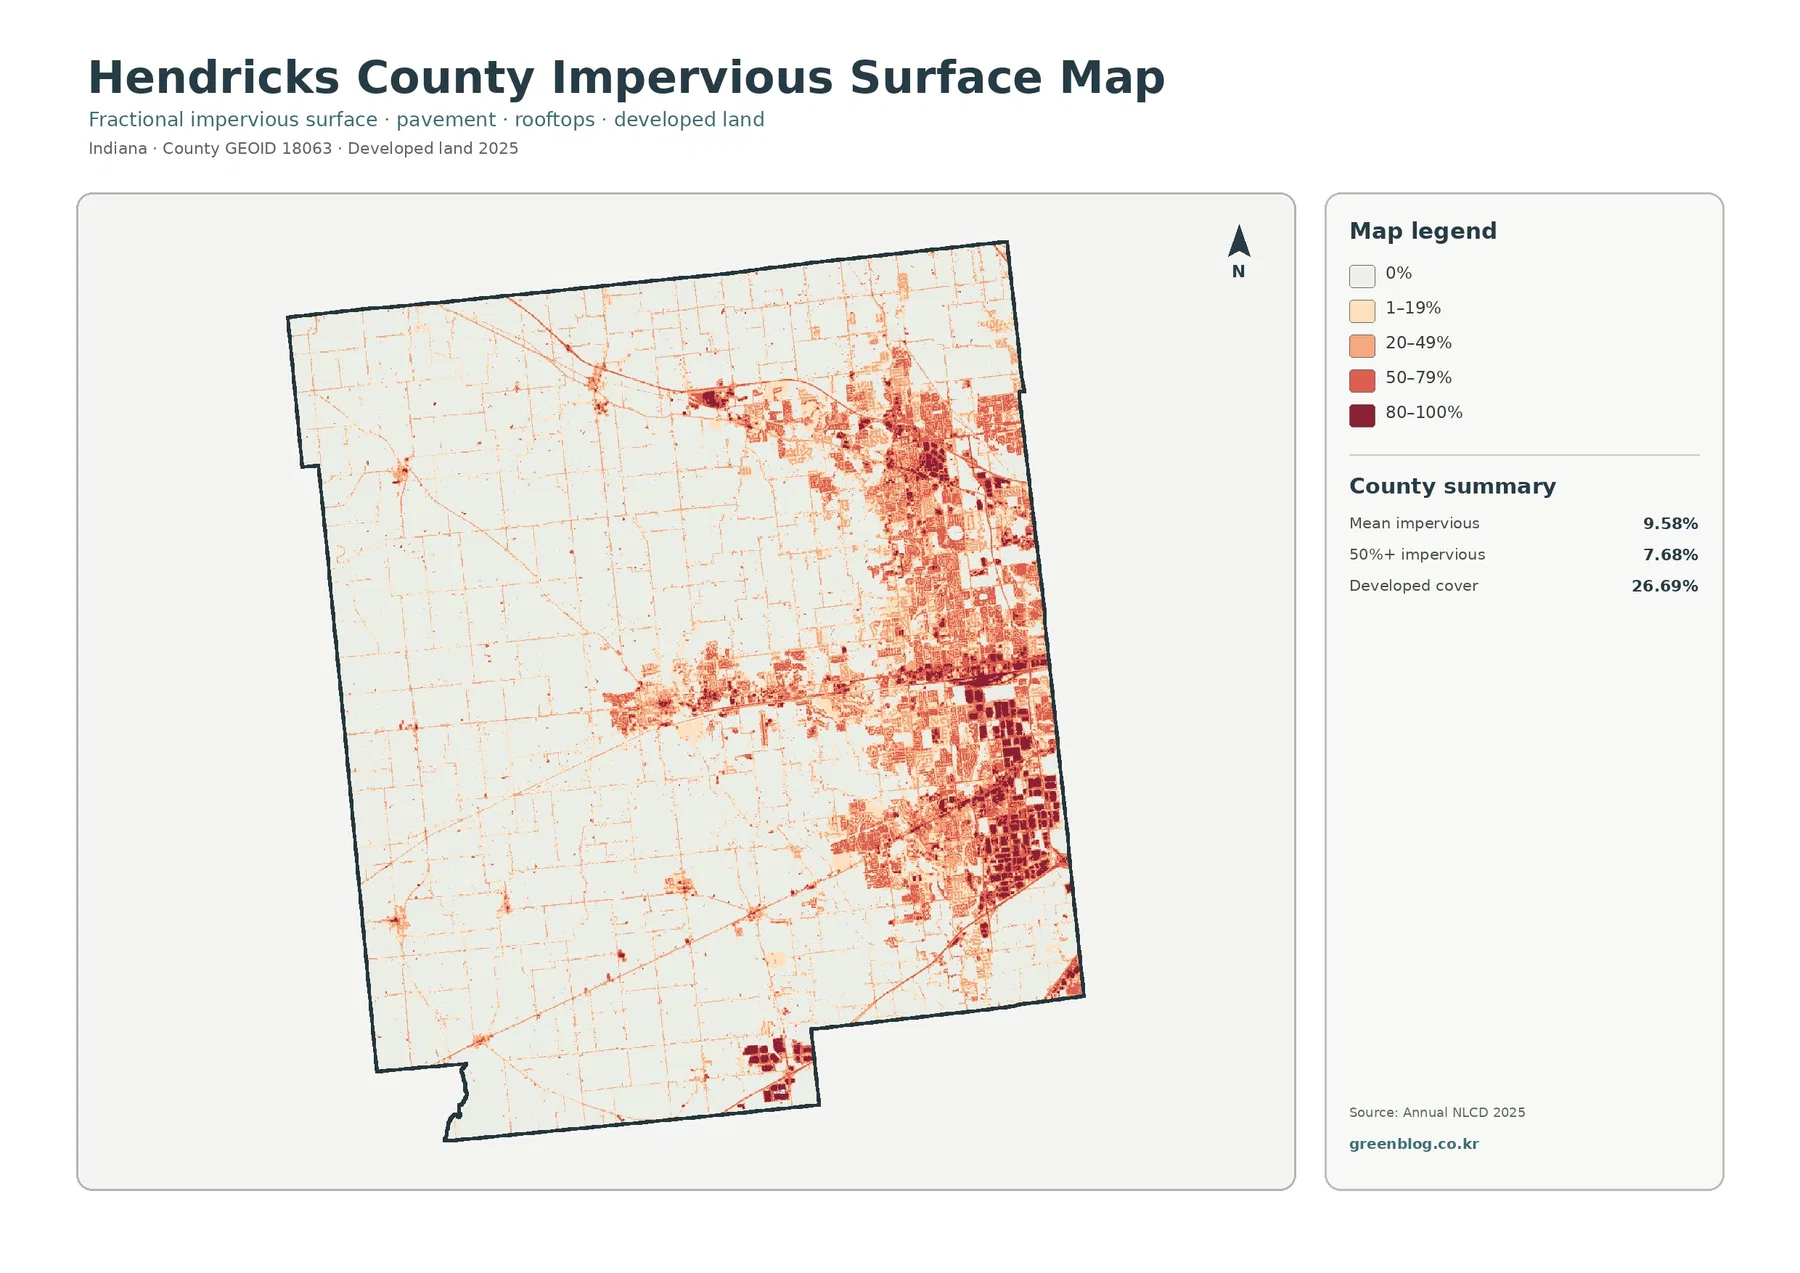
The darkest impervious values are strongly concentrated on the eastern side of the county. Brownsburg, Avon, and Plainfield occupy the same general part of Hendricks County on the official planning map, and the impervious layer makes the hard-surface intensity of that area much clearer than the general land-cover map. Roads appear as thin lines extending into the countryside, while larger built-up areas form broader patches.
Danville is easy to pick out near the center because its impervious surfaces form a separate cluster surrounded by lighter rural land. Smaller communities and transportation corridors create additional dots and lines farther west, but they occupy much less area than the suburban east. The contrast is useful for a countywide stormwater or planning discussion because it shows where hard surfaces are concentrated without pretending that the map provides parcel-level drainage conditions.
Impervious percentage alone cannot determine flood risk. Runoff also depends on rainfall, soil, slope, stream capacity, drainage infrastructure, and the location of floodplains. The map can help identify places where hard surfaces are common, but watershed work around White Lick Creek, Big Walnut Creek, or other local streams should add detailed water and terrain data before drawing conclusions.
The 1985–2025 comparison concentrates change in the same eastern half
The change map compares class assignments from 1985 and 2025. Its summary reports 22.84% total class difference, including 13.11% classified as developed, 0.34% forest loss, 0.97% agricultural loss, and 8.39% other class difference. The total should not be described as a 22.84% development rate. It combines several categories of mapped difference between two dates.
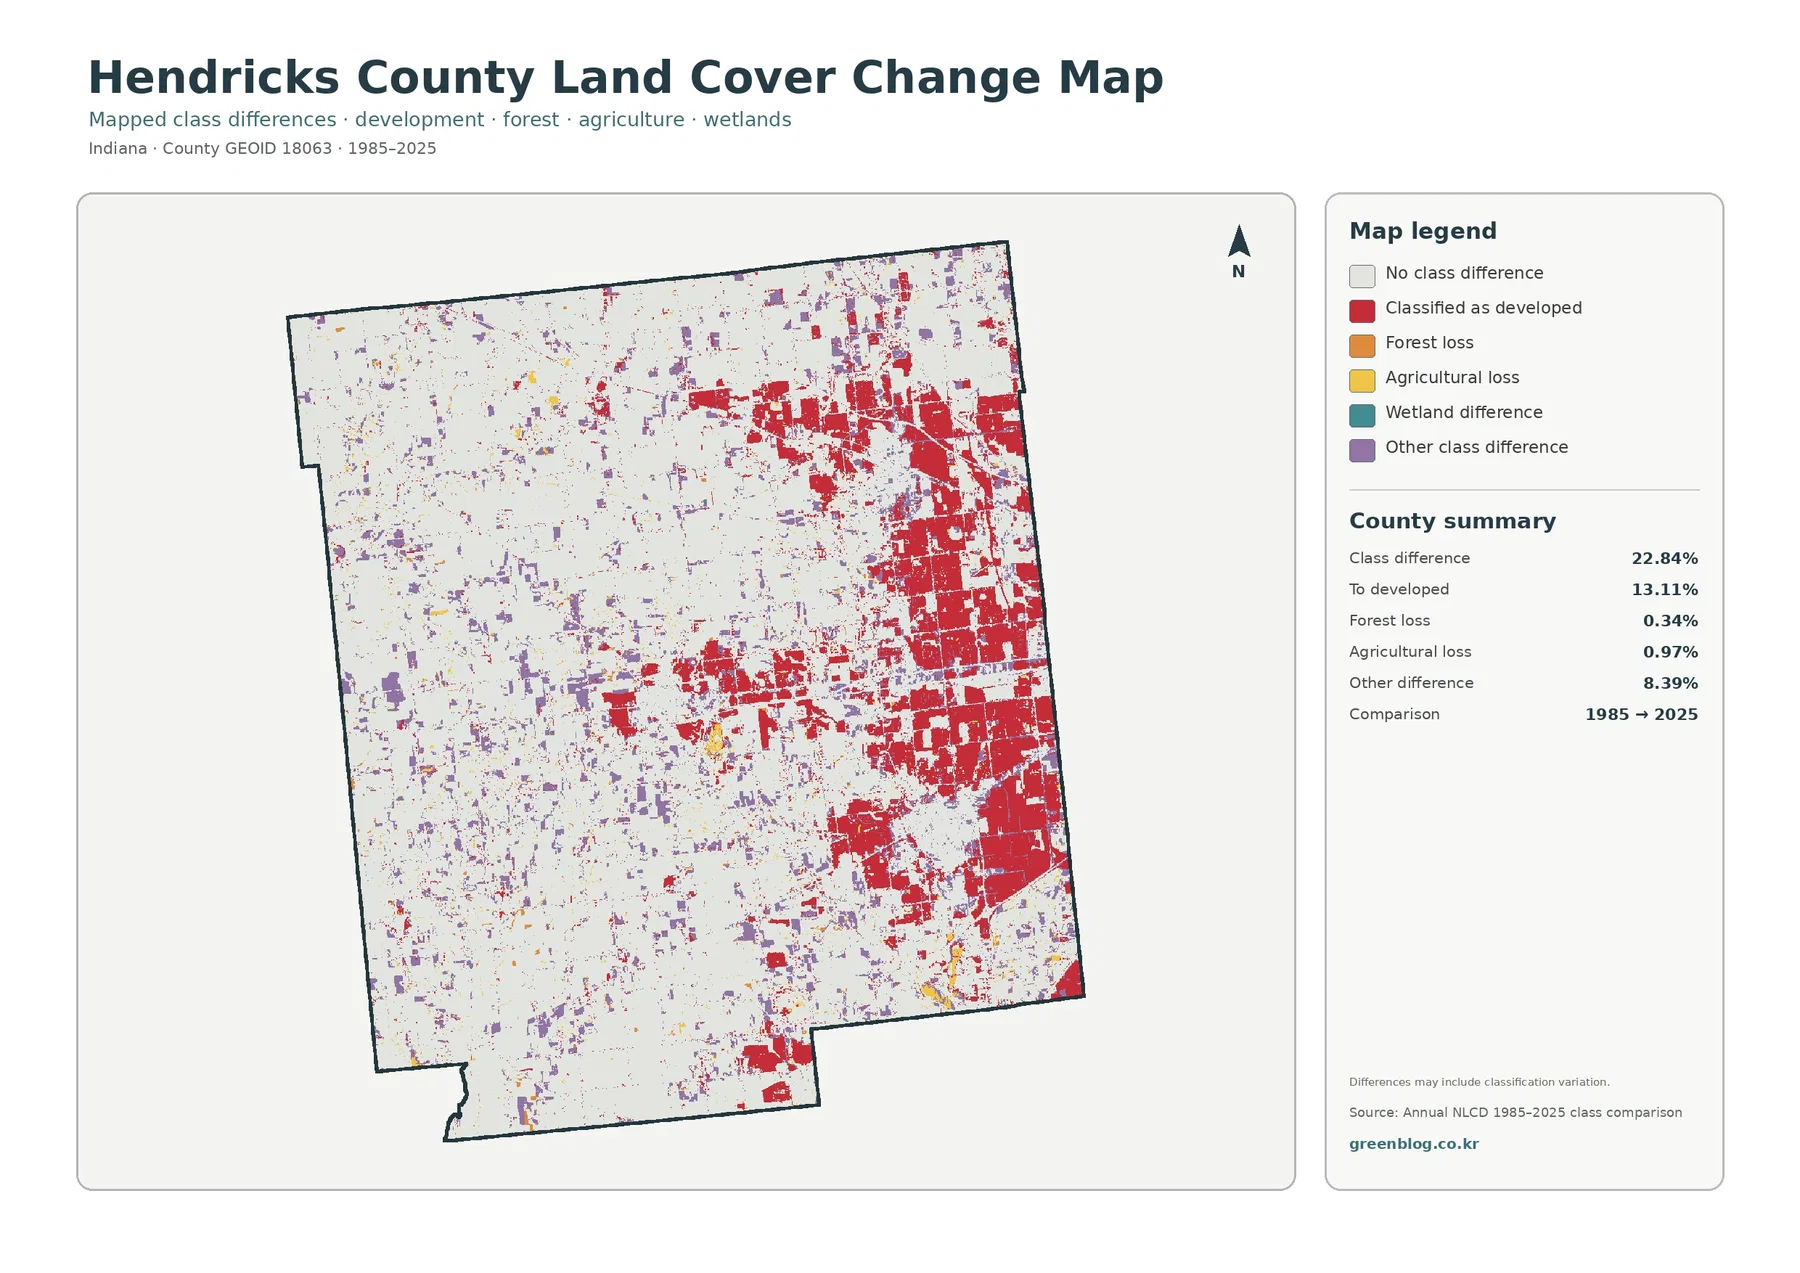
Red “classified as developed” areas cover large parts of the east and form additional concentrations around Danville. That distribution closely resembles the places where the 2025 impervious map is most intense, although the two layers measure different things. The change map asks whether class assignments differ between 1985 and 2025; the impervious map asks how much hard surface is present in 2025. Keeping those definitions separate prevents a common misreading.
The western half contains far more “no class difference” background, but small purple, yellow, and red areas are scattered through the farm landscape. Those small patches can reflect real land-cover changes, yet the map itself warns that classification variability may contribute to some differences. A single colored cell is not proof of a specific development project, tree clearing, or farm conversion. Larger repeated patterns are the safer features to compare at county scale.
When the date of a particular change matters, this two-date product needs supporting evidence. Intermediate aerial photographs, planning records, permit history, or other dated land-cover layers can show whether a subdivision, warehouse, road, or field conversion occurred at a specific time. The 1985–2025 map is best for finding broad areas that deserve that closer follow-up.
Choosing the right Hendricks County map for the question
Use the general 2025 land-cover map when the question is broad: where are farms, developed areas, forest, water, and wetlands across the county? It provides the clearest single overview of the suburban east, Danville, the agricultural west, and the wooded stream corridors. For a printed county profile, this is usually the strongest first image because the main classes are visible together.
Choose the forest-and-farmland map when rural cover is the subject. It removes much of the detail inside the eastern built area and makes the remaining farm and forest pattern easier to read. That can be useful for watershed education around Big Walnut Creek and White Lick Creek, for a classroom comparison of rural and suburban landscapes, or for a presentation that needs to emphasize tree cover within agricultural land.
The impervious map is the better choice for hard-surface questions. It distinguishes the dense eastern suburban surface from the lighter countryside and shows Danville as a separate center. The change map belongs in discussions about long-term pattern rather than current composition. Using the four views together works well because each map adds information instead of repeating the same legend.
For reports or slides, the four original JPG maps can be arranged as a sequence: current land cover first, rural cover second, impervious surface third, and historical comparison last. Keeping the data year visible is important. The first three products describe 2025, while the change map compares 1985 with 2025. A caption should preserve those dates so readers do not mistake the historical layer for another current-condition map.
What the raster maps can and cannot tell you
Annual NLCD is a raster product. The land surface is divided into cells, and each cell receives a mapped class based on the source data and classification method. A cell along the edge of Avon or Plainfield may contain a mix of roof, road, lawn, and tree cover even though only one class is displayed. A rural cell can include crop field, hedgerow, ditch, and a small road. That generalization is appropriate for county patterns but not for surveying a property line.
Land cover is also different from land use, zoning, and ownership. Agricultural cover does not prove that a parcel has agricultural zoning. Developed cover does not define a municipal boundary or permit future construction. Forest does not establish public ownership, and a wetland-colored cell is not a jurisdictional wetland determination. Those questions require county planning, assessor, survey, or regulatory sources.
The 2025 products describe the classification for that data year and cannot show construction or land change that happened afterward. The 1985–2025 product compares two endpoints and does not explain every event between them. Readers interested in recent development on the eastern side of Hendricks County should therefore pair these maps with current aerial imagery and county planning information.
Used within those limits, the set is a concise way to understand a county undergoing a strong transition from rural agriculture to a heavily developed eastern edge. The maps do not replace local records, but they make the major spatial contrast visible: broad farm country in the west, a separate developed center at Danville, concentrated impervious surfaces to the east, and forest that often follows irregular rural and streamside patterns.
Frequently Asked Questions
Why does Hendricks County look suburban in the east when agriculture is 62.13% countywide?
The 62.13% figure covers the entire county. Large agricultural areas in the west and northwest raise the countywide share, while developed cover is concentrated around the eastern communities of Brownsburg, Avon, and Plainfield and around Danville. The map therefore adds an important geographic detail that a single percentage cannot provide.
Why is developed cover 26.69% but mean impervious surface only 9.58%?
Developed land can include lawns, trees, and other pervious surfaces within neighborhoods and commercial areas. Impervious cover focuses on hard surfaces such as roofs, pavement, and parking lots. The two measures describe related but different parts of the built environment, so the impervious average is expected to be lower than the developed-land percentage.
Does 22.84% class difference mean that more than one-fifth of the county was developed after 1985?
No. The 22.84% total combines multiple categories of class difference between 1985 and 2025. The summary lists 13.11% classified as developed, 0.34% forest loss, 0.97% agricultural loss, and 8.39% other class difference. It is a two-date land-cover comparison, not a single development-rate statistic.
Map File Information
The ZIP contains four original JPG maps for Hendricks County: 2025 land cover, forest and farmland, impervious surface/developed land, and the 1985–2025 land-cover class comparison.
- Printable Size: 2480 × 1754 px each
- File Type: ZIP containing 4 JPG files
- Intended Use: printing, reports, classroom work, presentations, and county land-cover reference
Related Maps
- Adams County Indiana Land Cover Map
- Allen County Indiana Land Cover Map
- Bartholomew County Indiana Land Cover Map
Sources and references
- MRLC Annual NLCD Data – official Annual NLCD data access
- USGS Annual NLCD Land Cover Classification – class definitions and dataset guidance
- U.S. Census Bureau TIGER/Line Shapefiles – official county boundary source
- Hendricks County Comprehensive Plan – county planning context for Brownsburg, Avon, Plainfield, Danville, Big Walnut Creek, and White Lick Creek
Green Map creates custom-edited map images using open geographic data sources such as geoBoundaries, Natural Earth, OpenStreetMap, and government open data.
These maps are edited visual materials, not raw data files, and are provided for education, documents, presentations, and graphic reference.