Forest and agriculture divide almost all of Franklin County between them. The supplied 2025 summary gives forest 45.18% and agriculture 44.22%, while a large blue reservoir stands out near the north-central part of the county. This Franklin County Indiana Land Cover Map places those broad surfaces beside developed land, hard surfaces, and a 1985–2025 endpoint comparison.
Four WebP previews are used in the article, and the four matching original JPG maps are available together in one ZIP below. Each JPG is 2480 × 1754 pixels. They work well for county profiles, classroom comparison, environmental presentations, and land-cover discussion, but they are reference maps rather than parcel, zoning, ownership, or engineering products.
Table of Contents
A county split almost evenly between woods and working land
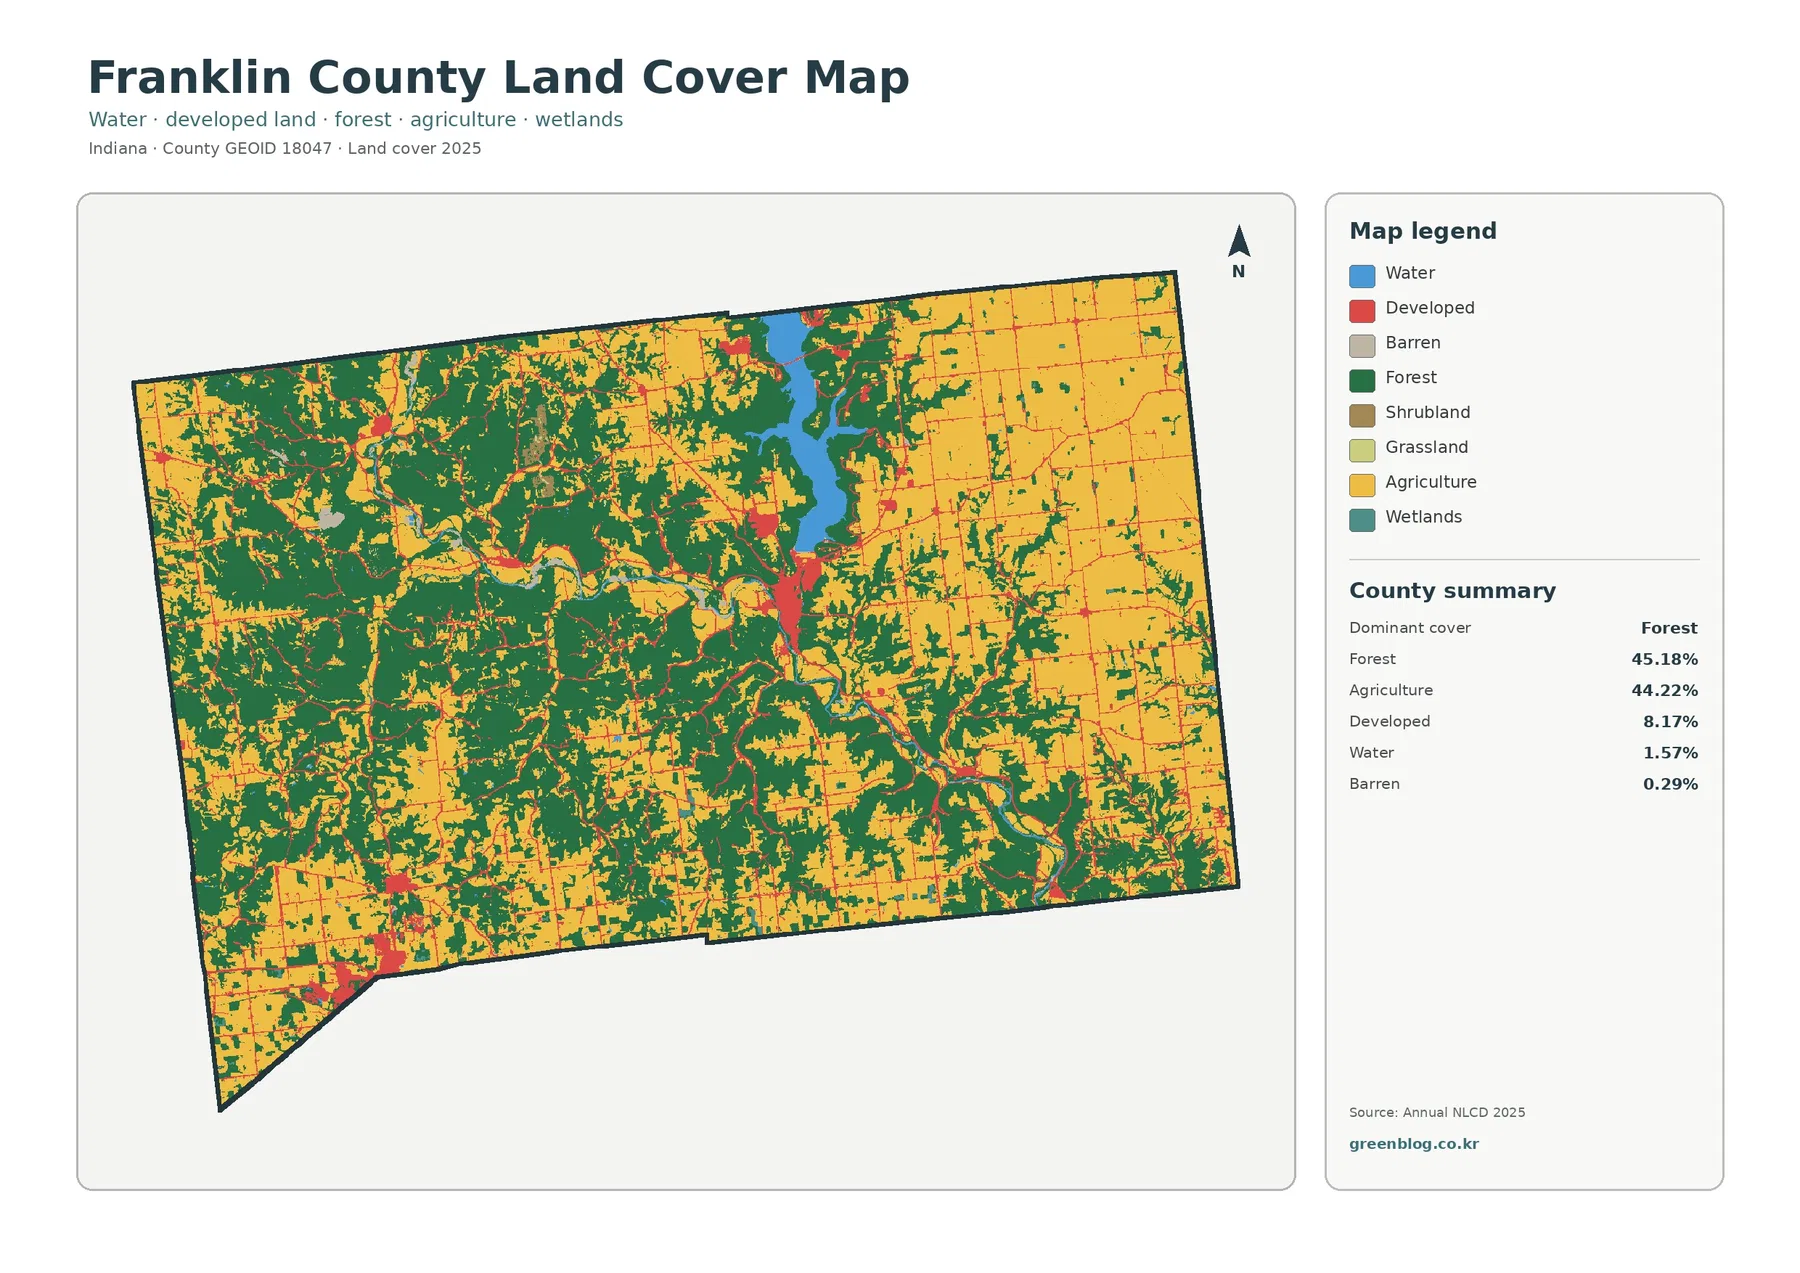
Forest is the largest mapped class at 45.18%, but agriculture follows at 44.22%. Developed land accounts for 8.17%, open water for 1.57%, and barren land for 0.29%. Because the two leading classes are separated by less than one percentage point, Franklin County is better understood as a forest-and-farm county than as a place dominated by only one of those surfaces.
A prominent blue waterbody occupies the north-central portion of the map. Indiana Department of Natural Resources identifies Brookville Reservoir as a 5,260-acre lake in the historic East Fork Whitewater River valley. The reservoir is therefore one of the few features that can be matched confidently to a named local place without guessing from an unlabeled road or settlement.
Developed color is much smaller in total area but appears in several recognizable concentrations. The strongest central cluster lies south of the reservoir around Brookville, and another concentration is visible at the southwest edge of the county. Finer red lines and small patches extend through rural areas. Since the preview does not label every road or municipal boundary, those narrow features should be described as developed traces rather than assigned to a specific highway without another map.
Land cover describes what the ground surface was classified as from imagery. It does not identify zoning, ownership, legal land use, farm operators, or building rights. A developed cell can still contain lawns, trees, and bare soil, while an agricultural cell does not reveal the crop. The map is most useful for county-scale comparison and screening, not for deciding what is permitted on an individual property.
Brookville Lake changes the otherwise forest-and-farm picture
Open water makes up only 1.57% of the county, yet Brookville Lake is visually prominent because much of that water is concentrated in one large reservoir. Its long shape creates a clear break between forest and farm areas around the north-central county. Smaller streams and ponds do not have the same visual weight, especially at a 30-meter cell size.
Hard surfaces isolate the compact built centers
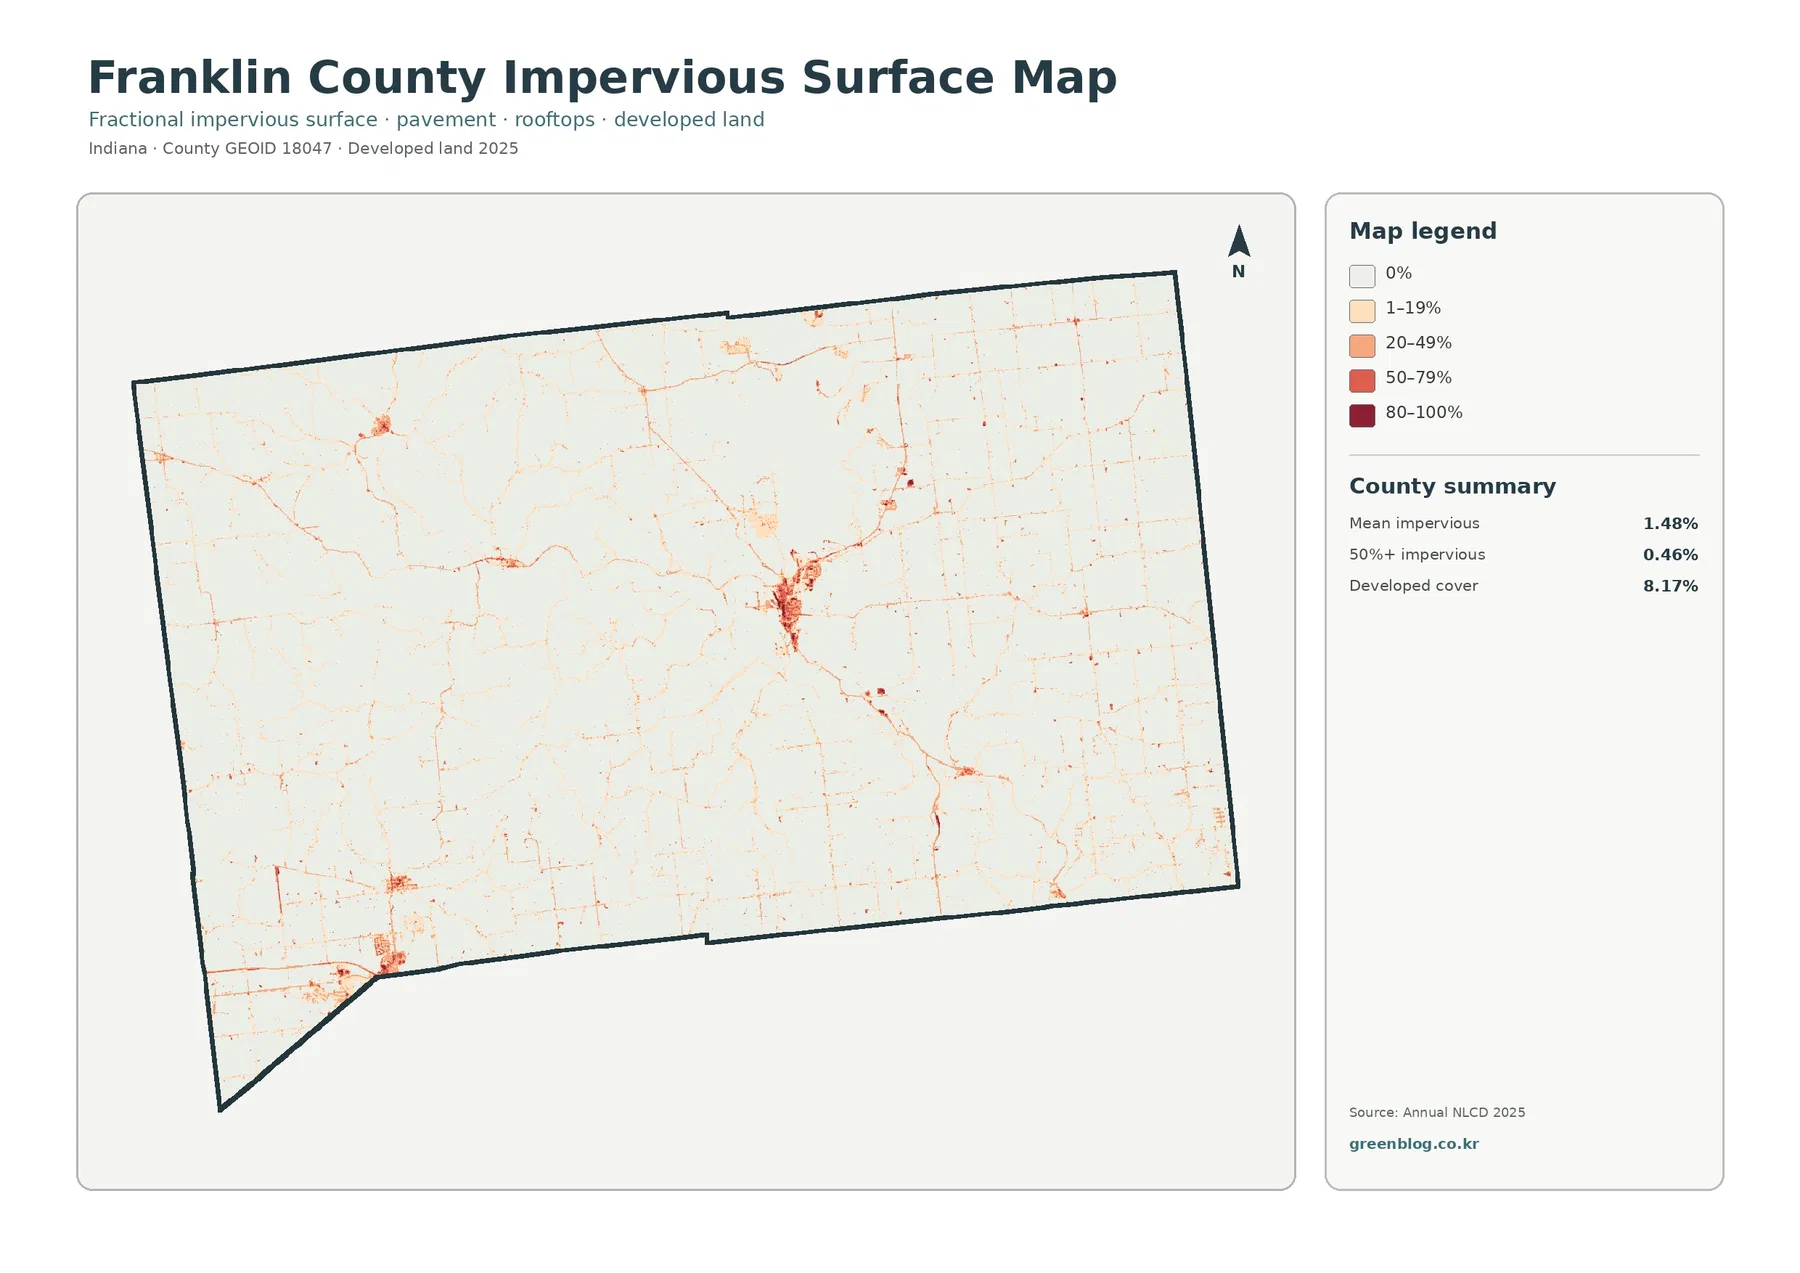
Mean impervious cover is 1.48%, and only 0.46% of the county is mapped at 50% impervious or greater. Both values are much lower than the 8.17% developed share in the general land-cover summary. The difference is expected because developed classes can include grass, trees, soil, and other permeable surfaces around buildings and roads, whereas impervious cover focuses on surfaces such as roofs and pavement.
The vegetation view makes the east-west contrast easier to compare
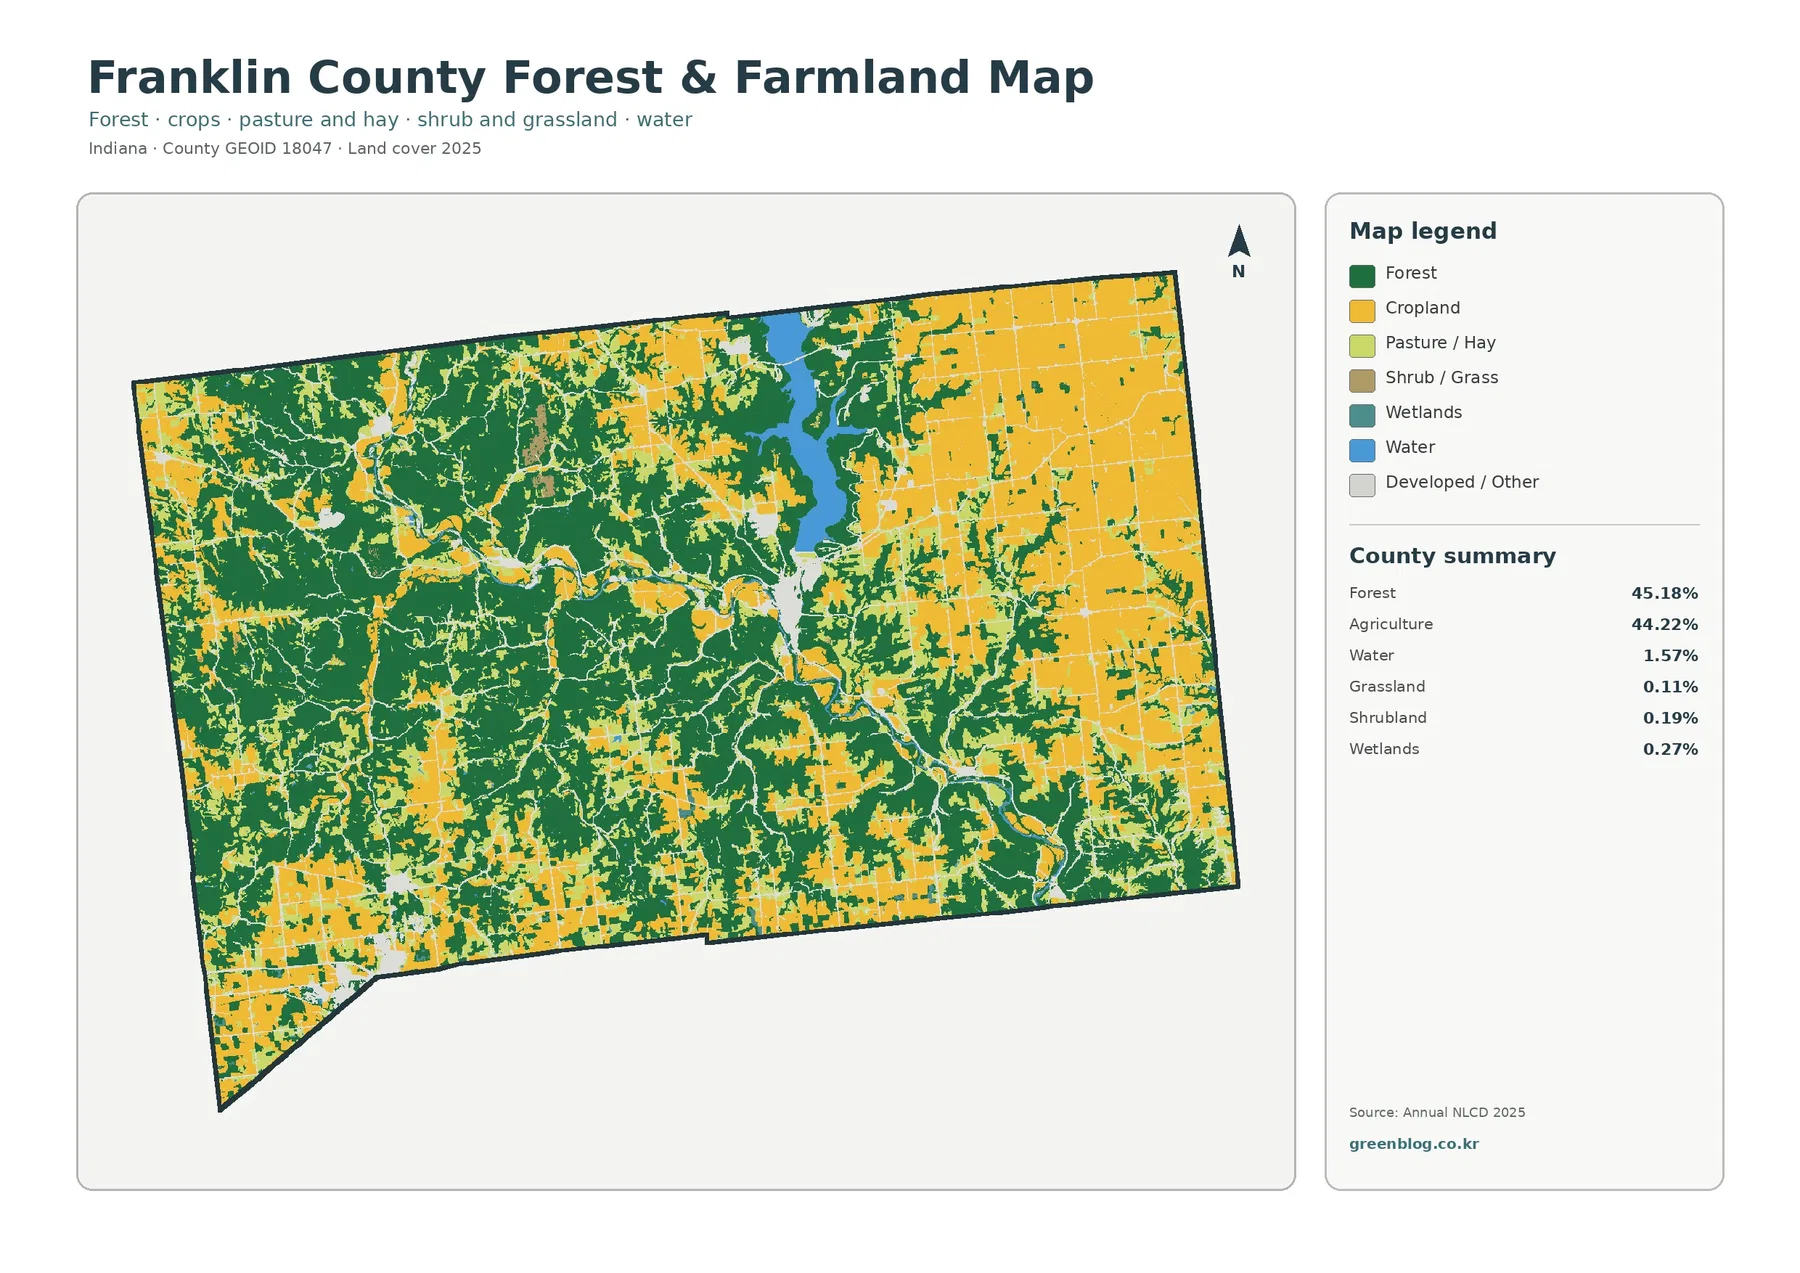
Once developed and miscellaneous surfaces are faded, the relationship between the two leading classes becomes clearer. Broad forest remains especially important across the west and interior, while large agricultural areas are more continuous in the east. Numerous boundaries between the two classes cross the middle of the county, so the map does not support a simple line separating a “forest half” from a “farm half.”
A 9.88% class difference is not the same as 9.88% new development
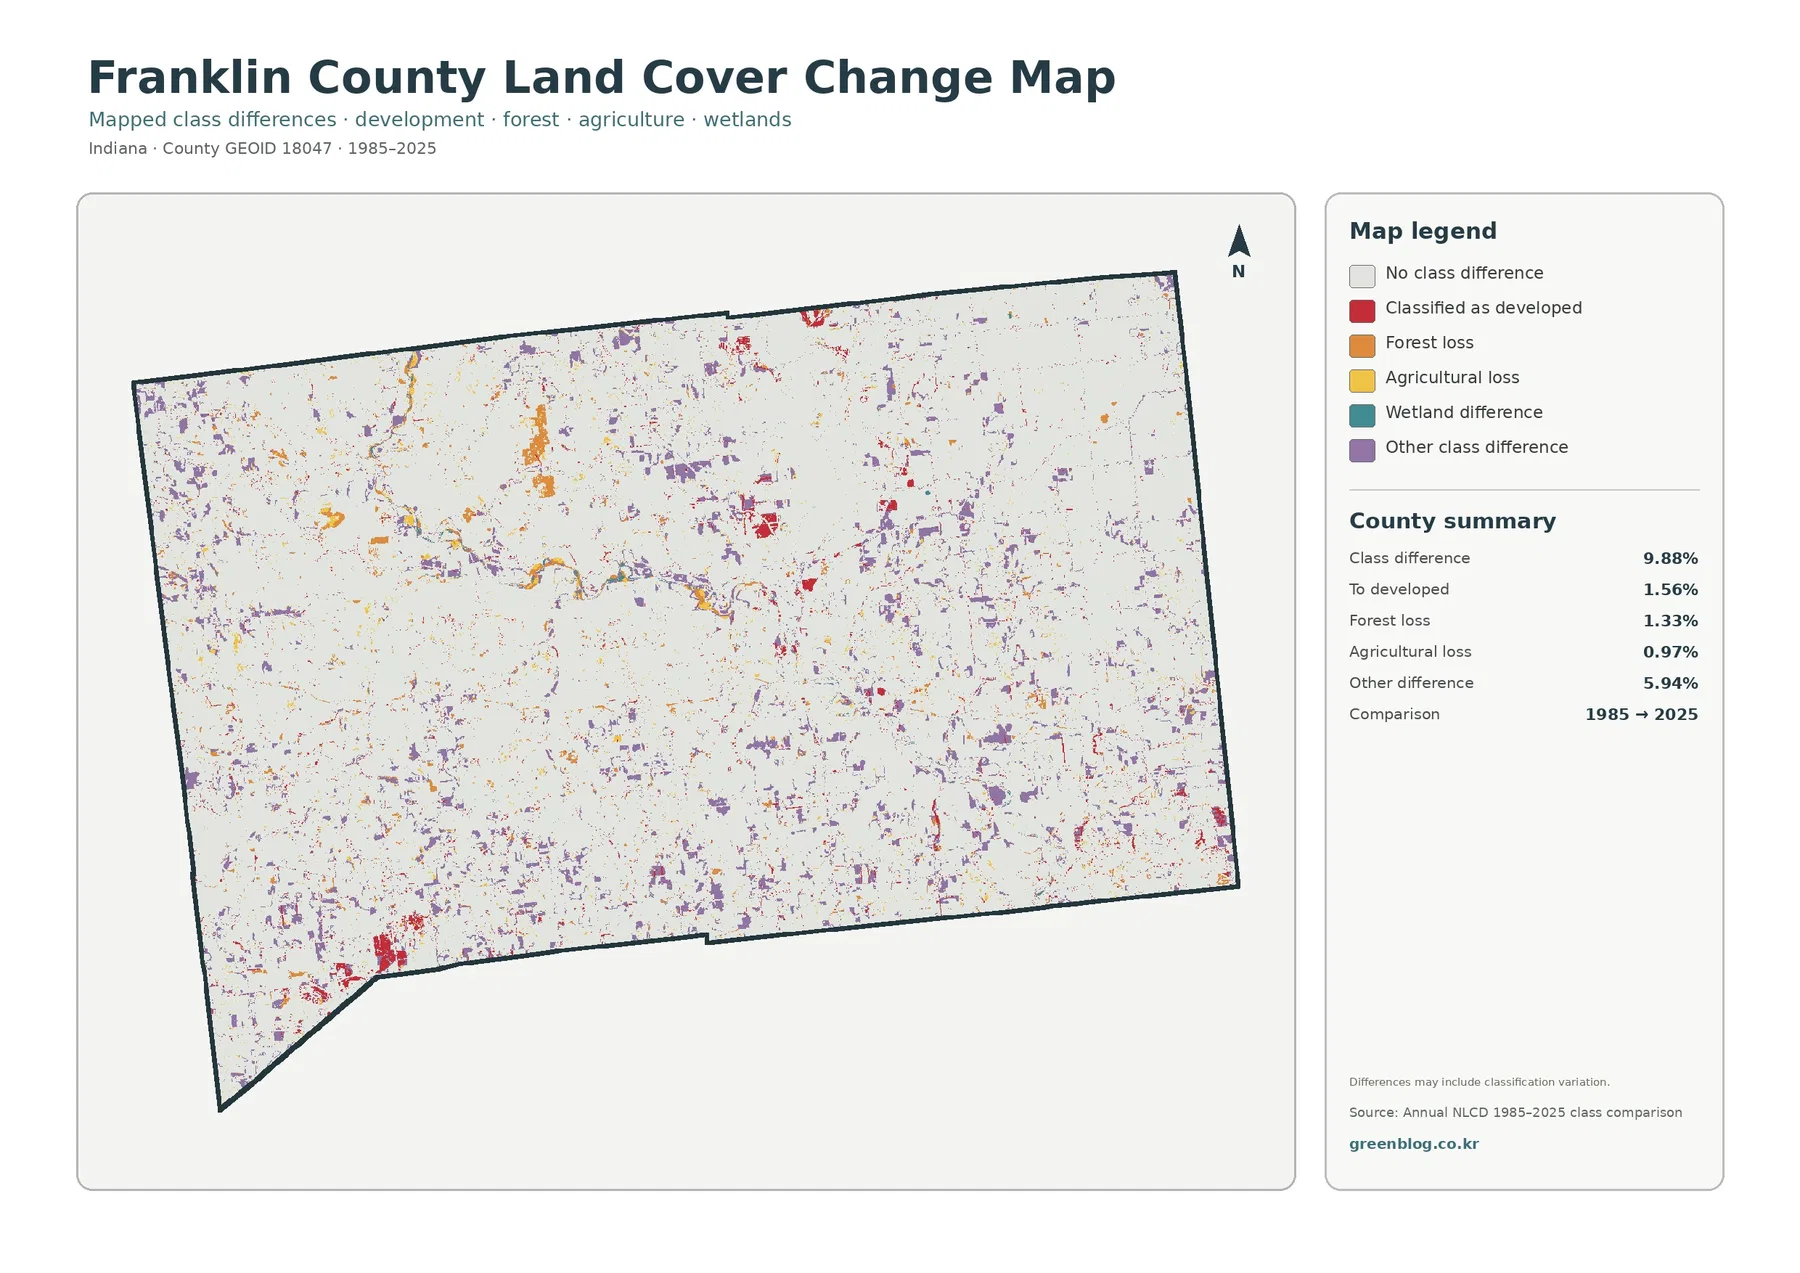
The comparison reports a 9.88% total class difference between 1985 and 2025. Its listed components include 1.56% classified as developed, 1.33% forest loss, 0.97% agricultural loss, and 5.94% other class difference. Wetland difference appears in the legend without a separate percentage, so it should not be estimated from the image or created by subtracting the published components.
Other class difference is the largest listed component at 5.94%. That category is especially important because it prevents the total from being read as a development statistic. The 9.88% figure includes several kinds of endpoint classification changes, while the separate developed-conversion value is 1.56%. Neither number gives an exact construction year or identifies the project responsible for a changed cell.
Choose the map that matches the question
For a general county profile, begin with the 2025 land-cover overview. It places forest, agriculture, Brookville Lake, and the developed centers in one frame. For a discussion of woods and working land, pair the overview with the forest-and-farmland map. The simplified colors make the west-to-east change easier to see without allowing developed areas to dominate the discussion.
Use the impervious map when the question is about rooftops, pavement, or the compactness of built areas. It answers a different question from the 8.17% developed land class. Add the 1985–2025 comparison only after the current landscape has been explained, because change colors can otherwise be mistaken for present-day land-cover classes.
Resolution, date, and legal limits matter when zooming in
Annual NLCD assigns a predominant class to square cells roughly 30 meters on a side. One cell may contain crops, trees, a ditch, a road, a lawn, and a building, yet the final map still displays one principal class. Zooming enlarges those cells but does not create missing parcel or building detail. Small ponds, narrow streams, tree rows, and farm roads can be generalized into surrounding classes.
The current maps represent the supplied 2025 observation year. Construction, harvest, tree removal, vegetation recovery, or changing water conditions after that observation may not appear. Current zoning, wetland jurisdiction, flood insurance, building approval, and ownership questions require up-to-date local and regulatory sources. Franklin County planning documents should be used for legal land-use decisions rather than interpreting NLCD colors as permissions or restrictions.
Files included in the four-map JPG download
The ZIP includes one JPG each for 2025 land cover, forest and farmland, impervious surface and developed land, and 1985–2025 land-cover change. Start with the countywide overview, then add the map that directly supports the topic. The files are designed for comparison and explanation, not for replacing parcel, wetland-jurisdiction, zoning, flood, or engineering maps.
Frequently Asked Questions
Is Franklin County more forested or more agricultural?
Forest is slightly larger at 45.18%, compared with 44.22% agriculture. The difference is less than one percentage point, so the county is better described as a near-even mix. Forest is more extensive through much of the west and interior, while agriculture becomes more continuous toward the east.
Why does Brookville Lake look so large when water is only 1.57%?
Much of the mapped water is concentrated in one conspicuous reservoir, which makes it stand out visually even though water remains a small share of the entire county. Narrow streams and small ponds occupy less map area and may also be generalized at 30-meter resolution.
Does the 9.88% class difference mean that much of the county was developed after 1985?
No. The 9.88% figure includes every cell assigned a different endpoint class in 1985 and 2025. The listed developed-conversion component is 1.56%, while forest loss, agricultural loss, and other class differences are separate categories. Intermediate imagery and local records are needed to determine the timing and cause of a specific change.
Sources and Reference Data
- MRLC Annual NLCD Data – official access point for annual land-cover and comparison products
- USGS Annual NLCD Land Cover Classification – definitions and guidance for forest, agriculture, water, wetlands, developed land, and related classes
- U.S. Census Bureau TIGER/Line Shapefiles – official county-boundary reference for Franklin County
- Indiana DNR – Brookville Lake – official information on Brookville Reservoir and its Whitewater River valley setting
- Purdue Extension – Franklin County – local Agriculture and Natural Resources and community education resources
Map File Information
The ZIP contains four original JPG maps for comparing Franklin County’s near-even forest and agricultural cover, Brookville Lake, developed surfaces, and 1985–2025 class differences.
- Included Files: Use only the versions confirmed in the article and supplied images
- File Type: Use the confirmed download contents
- Intended Use: Printing, education, presentations, and map-based projects
Related Maps
- Adams County Indiana Land Cover Map
- Allen County Indiana Land Cover Map
- Bartholomew County Indiana Land Cover Map
Green Map creates custom-edited map images using open geographic data sources such as geoBoundaries, Natural Earth, OpenStreetMap, and government open data.
These maps are edited visual materials, not raw data files, and are provided for education, documents, presentations, and graphic reference.