Delaware County is mostly agricultural at the county scale, yet the broad Muncie urban area creates a striking break in the middle of that farm landscape. The supplied 2025 summary lists agriculture at 70.20%, developed land at 19.29%, forest at 7.84%, wetlands at 1.62%, and water at 0.86%. This Delaware County Indiana Land Cover Map set helps compare the farm-dominated outer county with the developed center, scattered woodland and wetland pieces, a large southeastern reservoir, hard-surface intensity, and the places where the 1985 and 2025 endpoint classes differ.
Four WebP views appear in the article: current land cover, forest and farmland, impervious surface and developed land, and the 1985–2025 class-difference map. The four original JPG maps measure 2480 × 1754 pixels each and are available together in one ZIP below. They can be used for county profiles, lessons about urban and agricultural contrast, presentations about Muncie and surrounding towns, or careful visual comparison of current cover and long-term classification differences.
Table of Contents
Muncie creates the largest visual break in an otherwise broad agricultural grid
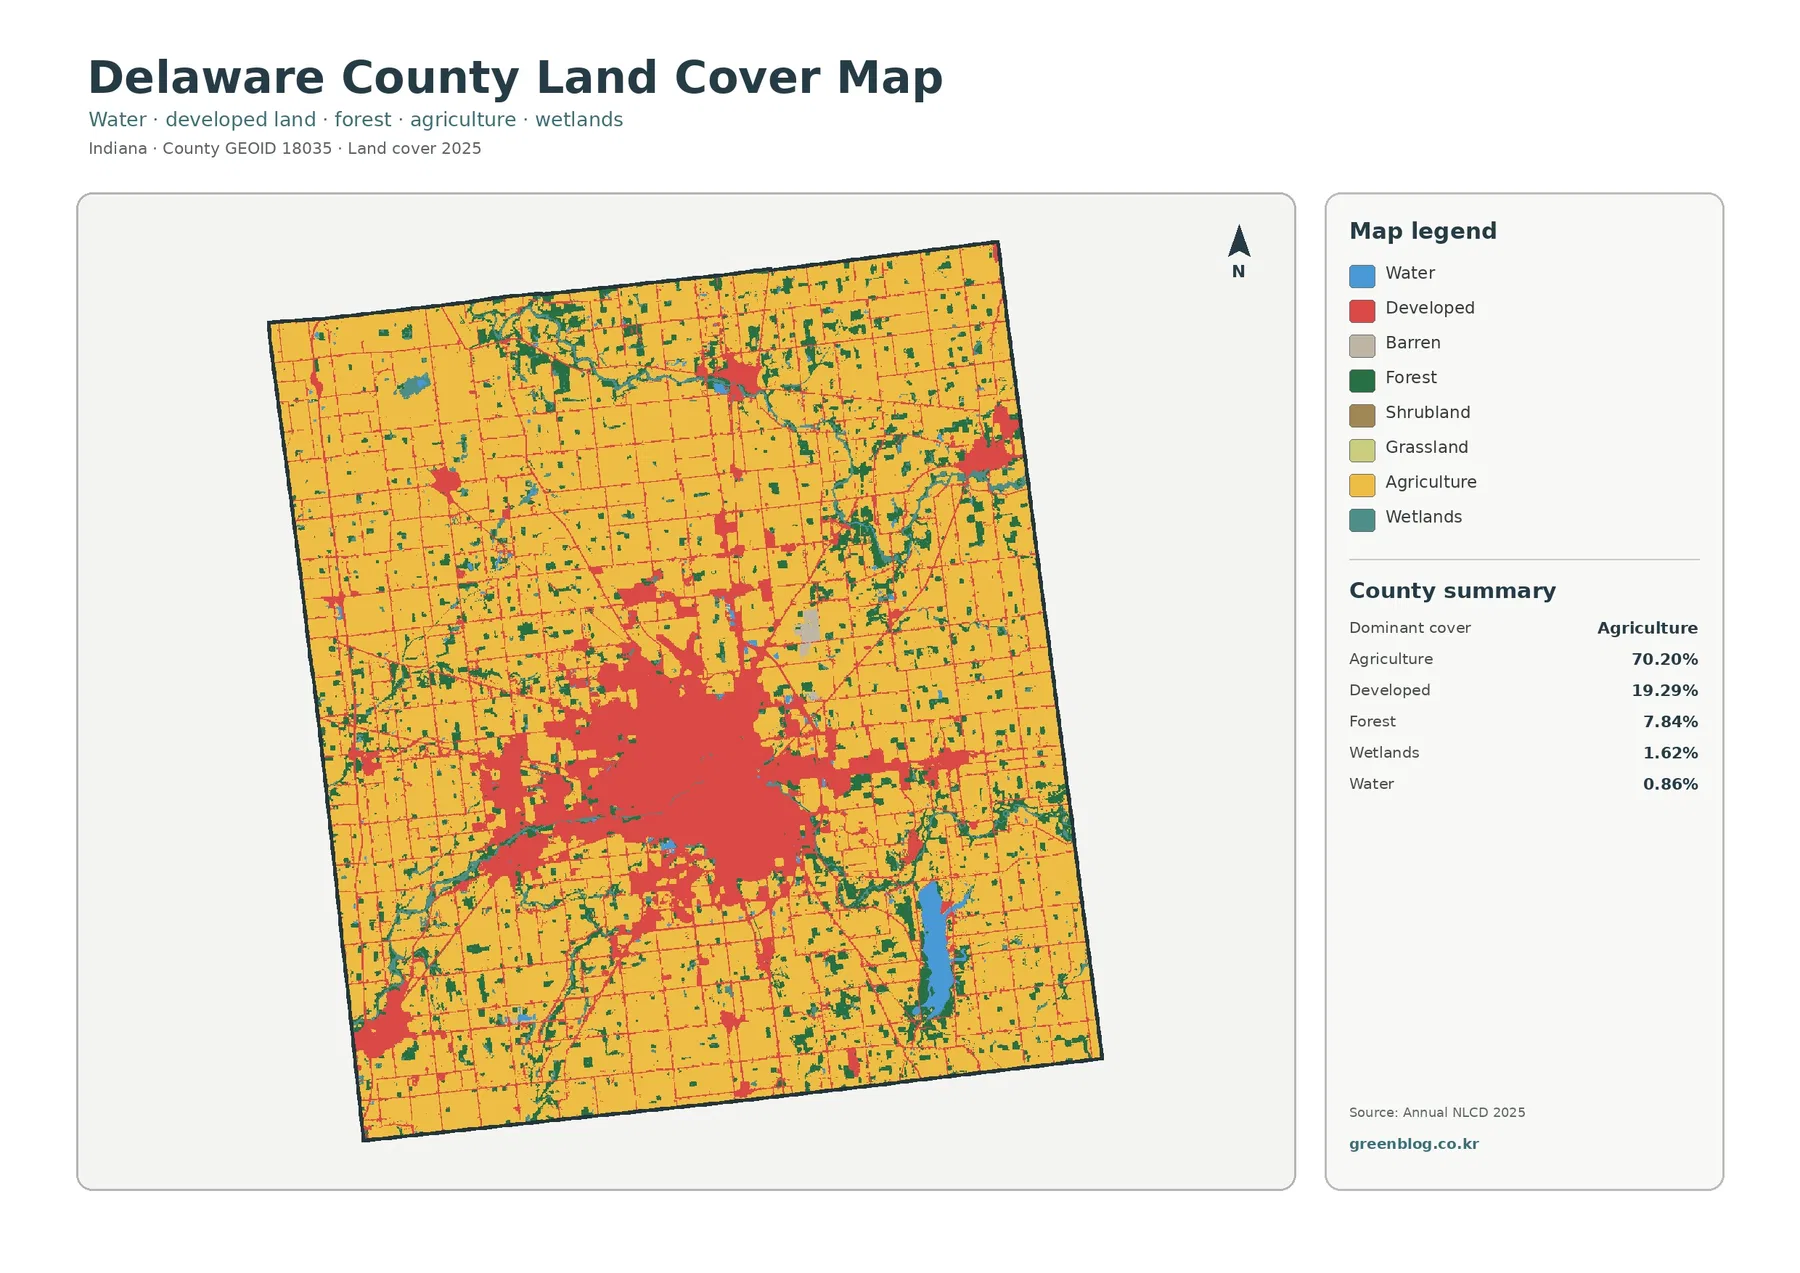
Agriculture supplies most of the map’s yellow background, especially across the northern, western, and southern parts of the county. Large field blocks remain continuous for long distances, but they are repeatedly interrupted by thin developed lines, small dark green woodland pieces, teal wetland cells, and scattered water. The 70.20% figure therefore describes the dominant countywide class without implying that every rural section looks identical. In some areas fields are nearly continuous; elsewhere natural-cover strips and built features divide them at short intervals.
The largest red concentration sits in the center and aligns with Muncie, which Delaware County identifies as the county seat and largest municipal area. Development spreads beyond that central mass along several outward traces and smaller clusters. The county’s official city-and-town boundary map also identifies Yorktown, Albany, Daleville, Eaton, Gaston, Selma, and Chesterfield. Those municipal boundaries are not drawn on the land-cover image, so a small red patch should not be treated as an exact city limit. What the image does show clearly is a county with one major built core plus several separate developed centers within a much larger agricultural setting.
Developed land reaches 19.29%, making it the second-largest class by a wide margin. That share includes more than downtown streets and commercial pavement. Annual land-cover classes can place lawns, trees, open soil, and other permeable surfaces inside developed categories when built features are part of the dominant setting. This matters when comparing the red land-cover map with the impervious-surface image later in the page: the two layers describe related but different properties of the surface.
Forest covers 7.84%. It appears as many small and medium patches rather than one countywide block, with noticeable concentrations and branching pieces in the eastern and northeastern portions and around some water-related features. Wetlands account for 1.62% and water for 0.86%. Although those percentages are small, blue and teal areas create visible breaks in the farm grid and often sit close to woodland, making local natural-cover patterns more noticeable than the countywide totals alone suggest.
Prairie Creek Reservoir makes the small countywide water share locally important
Water is only 0.86% of the supplied county summary, but the large blue feature southeast of Muncie is difficult to miss. Its location and shape correspond to Prairie Creek Reservoir. A City of Muncie planning reference describes Prairie Creek as a man-made reservoir of roughly 1,275 acres that also serves as a backup drinking-water source for Muncie. This is a useful reminder that a class covering less than one percent of a county can still be one of the most recognizable features in a local part of the map.
Dark green forest and teal wetland cells occur near parts of the reservoir and along other irregular natural-cover strips. Blue water and teal wetlands should not be combined, however. Open water marks exposed water surfaces, while wetland classes can include vegetation and seasonally saturated ground. The 0.86% water share and 1.62% wetland share are therefore separate measurements, and neither should be interpreted as a legal wetland boundary, floodplain, or regulatory buffer.
Indiana water-resource material for Delaware County discusses the White River, Mississinewa River, smaller streams, groundwater, and Prairie Creek Reservoir. Those named resources provide useful geographic context, but the land-cover previews do not label individual channels. A curving teal or green strip should not automatically be assigned a river name from appearance alone. Stream identity, drainage jurisdiction, flood risk, and wetland permitting require current hydrography and regulatory sources in addition to this countywide classification.
Fading the developed classes exposes the woodland and wetland interruptions between fields
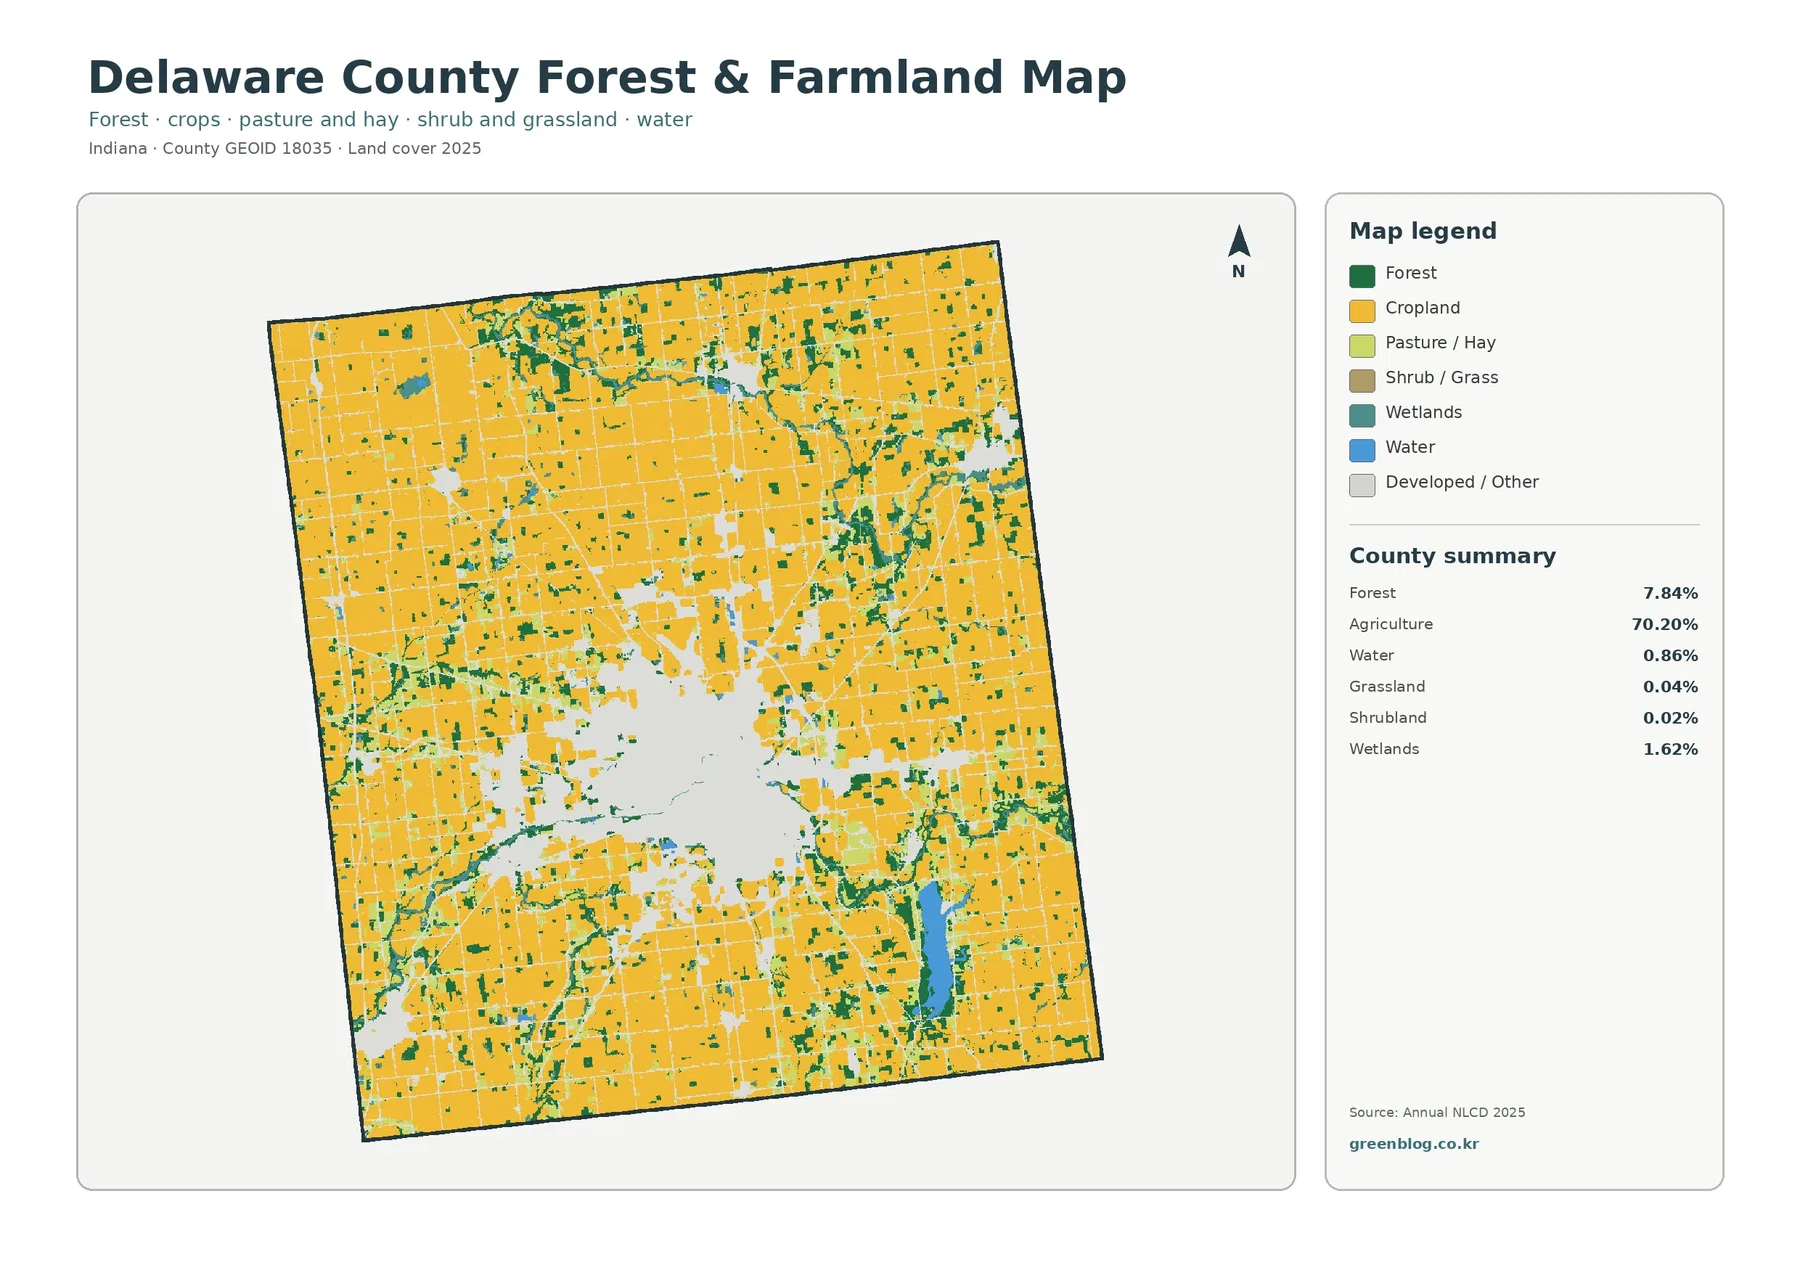
Once developed and miscellaneous surfaces are faded, the scale of the agricultural landscape becomes even clearer. Yellow cropland dominates the north, west, south, and much of the interior outside the central urban opening. Dark green forest appears as scattered blocks and narrow pieces between fields. The eastern and northeastern portions contain several of the more visible forest-wetland combinations, while many western farm sections show longer stretches of agricultural color with smaller natural-cover interruptions.
The large pale central opening corresponds to the strongest developed area on the general map. This makes the forest-and-farmland view especially useful for comparing rural cover immediately outside Muncie. Fields often approach the urban edge closely, but small woodland and wetland pieces remain between some farm blocks and developed areas. Farther from the center, the same types of natural-cover fragments appear in different sizes, so the county does not divide into a simple “city center versus empty farmland” pattern.
Grassland is listed at 0.04% and shrubland at 0.02%, making both very minor components in this package. They are present in the legend, but they do not define the county’s overall appearance. Agriculture, developed land, forest, wetlands, and water provide the more informative framework for describing Delaware County. Treating tiny classes as if they were major landscape zones would overstate what the supplied map actually shows.
Some agricultural edges look rectangular enough to resemble parcel boundaries, but the map is not a survey. Annual NLCD classifies the surface in roughly 30-meter raster cells. A single cell can contain crop rows, a ditch, a tree line, a farm road, grass, and part of a building while still receiving one predominant class. Zooming enlarges those cells without revealing ownership lines, field leases, or exact parcel geometry. Delaware County GIS or current survey and parcel records are the appropriate sources for property-level questions.
The 10.67% endpoint difference is led by the broad “other class difference” category
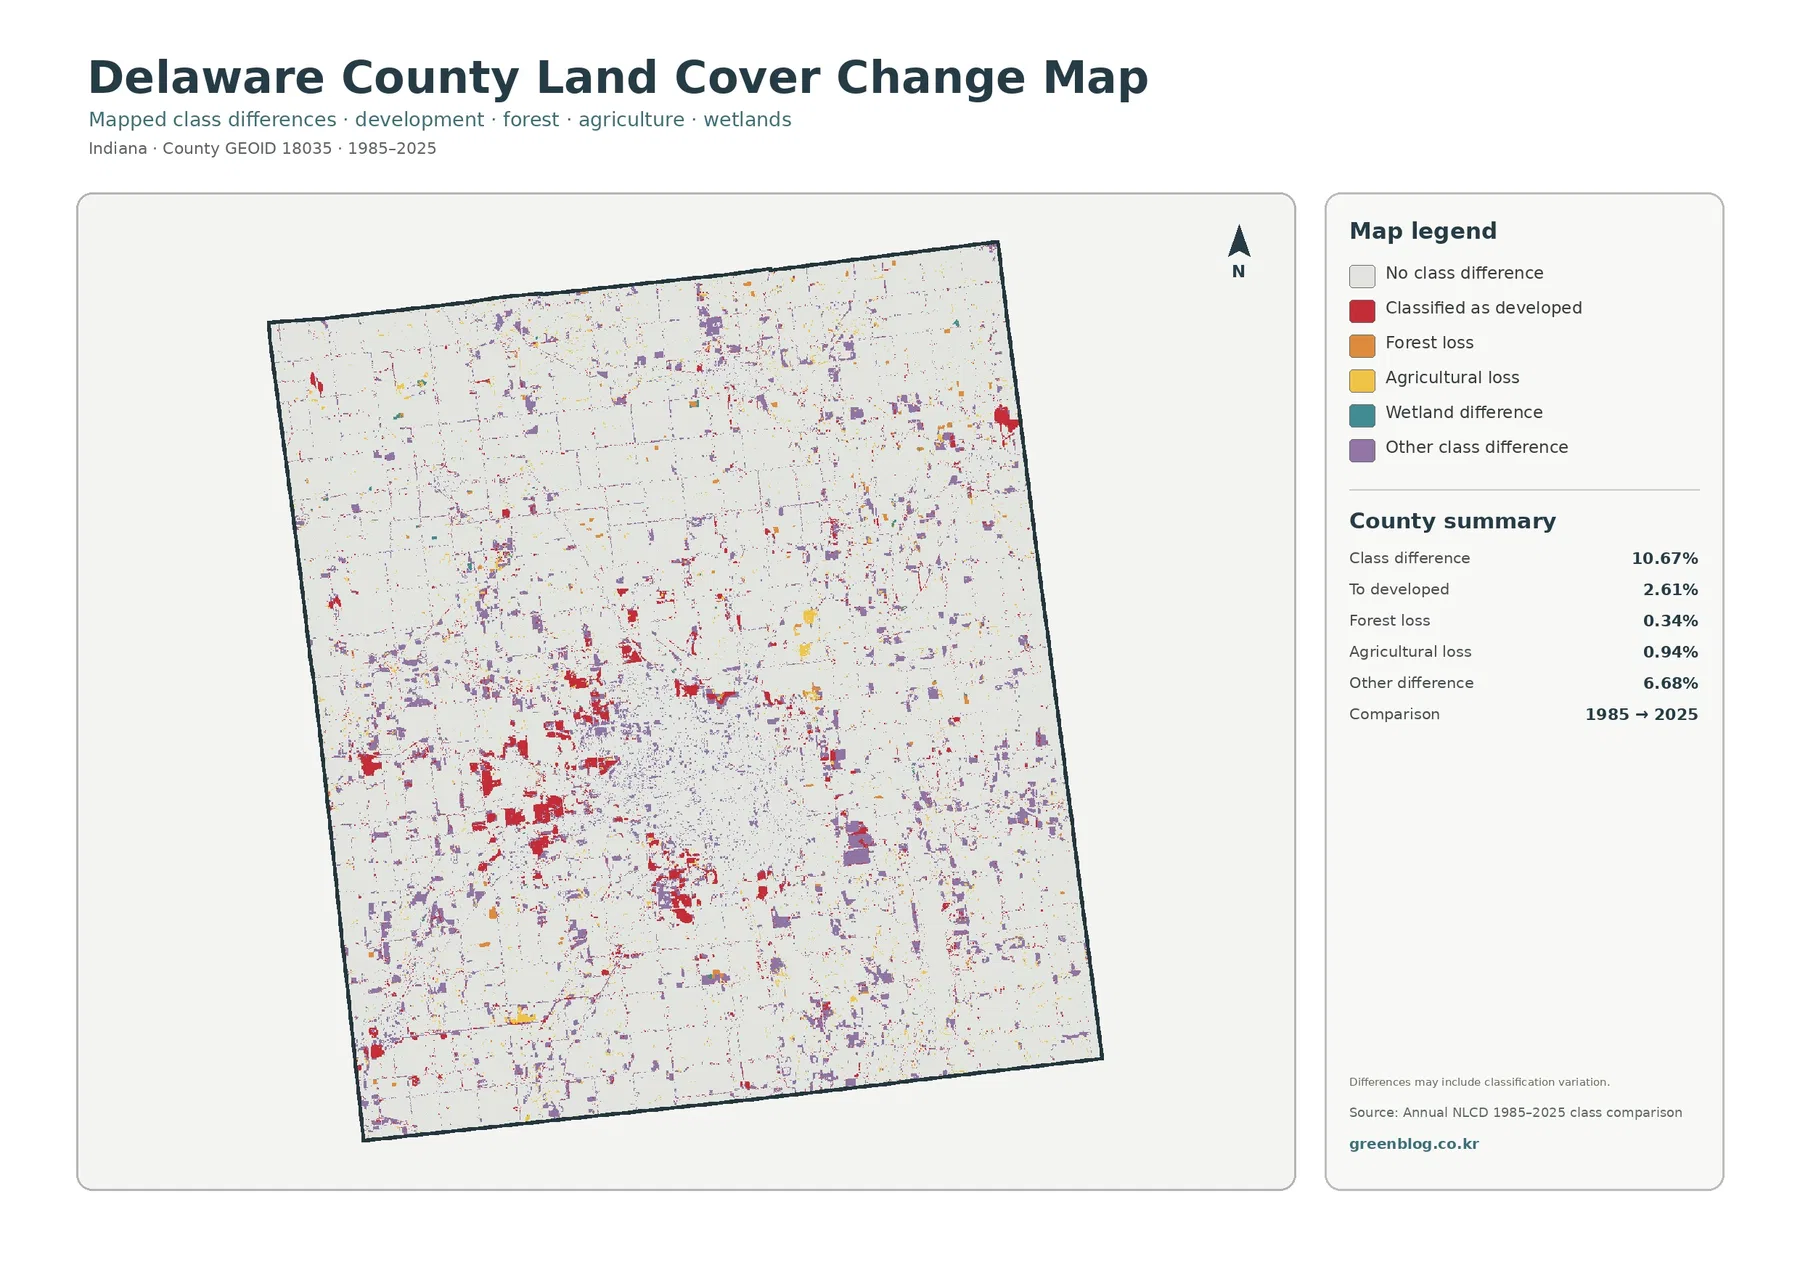
The supplied comparison reports 10.67% total class difference between 1985 and 2025. Listed components are 2.61% classified as developed, 0.34% forest loss, 0.94% agricultural loss, and 6.68% other difference. Wetland difference appears in the legend but has no separate percentage in the county summary, so a residual calculation or visual guess should not be presented as an official wetland-change value.
Red developed-conversion cells appear around portions of the current Muncie-area development and in several outlying clusters. They are also scattered along smaller built traces. These red cells are not the same as the full 19.29% developed share in 2025. They identify places where a cell had another class at the 1985 endpoint and a developed class at the 2025 endpoint. Land that was developed at both endpoints can remain in the no-difference background.
Purple other-class-difference cells are more widespread and account for 6.68%, the largest listed component. They occur across agricultural areas, near natural-cover edges, and around parts of the developed landscape. Because this category alone is much larger than the developed-conversion component, the county’s total 10.67% difference should not be described simply as urban growth. Several kinds of class movement, along with some classification variation, can contribute to the endpoint comparison.
Forest loss at 0.34% and agricultural loss at 0.94% are also endpoint classification terms rather than explanations of cause. A cell labeled forest in 1985 and another class in 2025 is counted as forest loss, but this image does not identify logging, construction, storms, farming changes, water conditions, or classification variation as the reason. The same limitation applies to agricultural loss. Intermediate annual data, aerial imagery, permits, and local records are needed to establish timing and cause.
Impervious cover separates the hard Muncie core from lower-density developed land
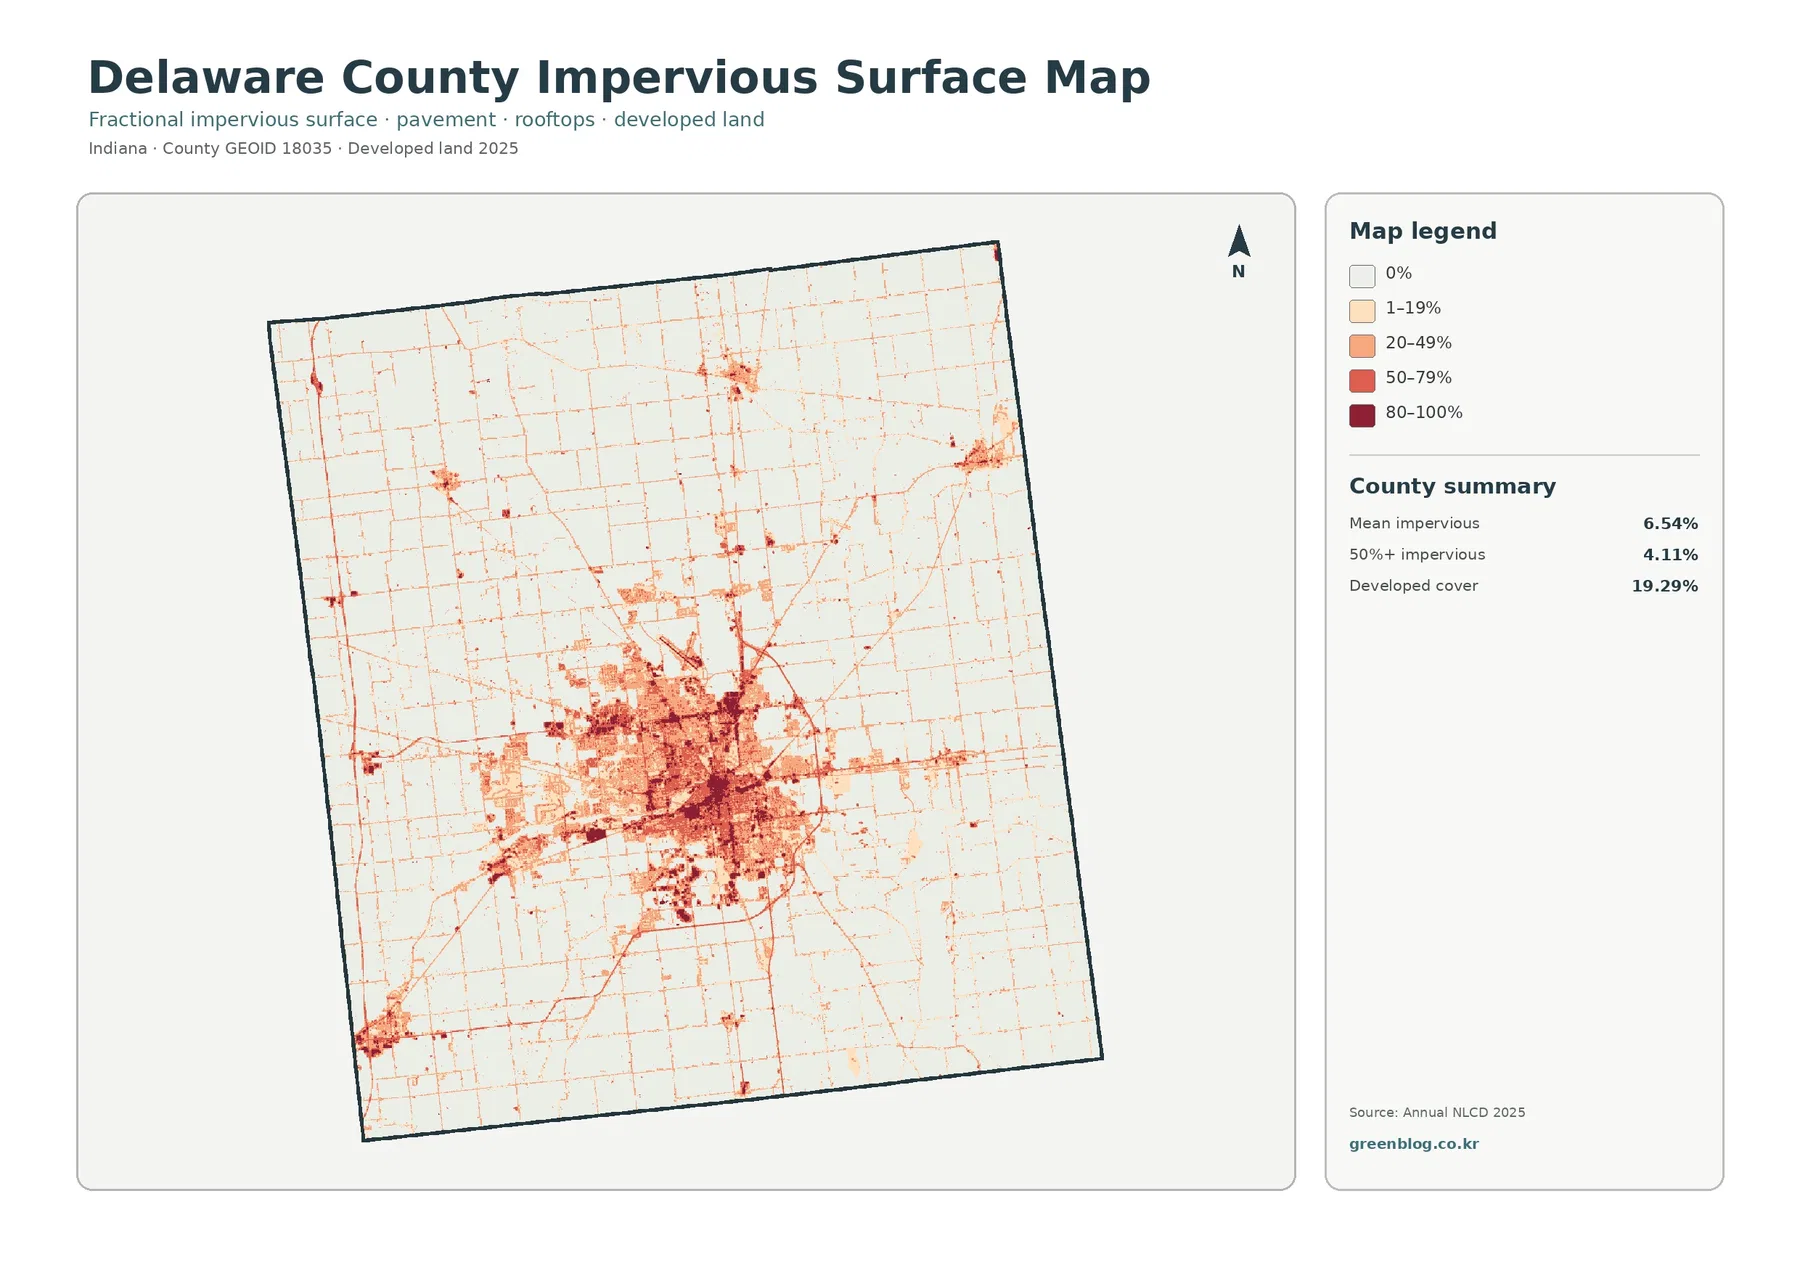
Mean impervious cover is 6.54%, while 4.11% of the county is mapped at 50% impervious or greater. Both figures are lower than the 19.29% developed-land share because developed classes can contain substantial permeable cover. A residential block with homes, streets, lawns, and trees may still be developed land even though much of the ground is not roof or pavement. The impervious layer is therefore better for comparing the intensity of hard surfaces within and around developed areas.
The darkest tones form a broad, connected Muncie cluster. Medium and high values spread outward along several routes, and smaller concentrated patches appear in other parts of the county. This matches the general land-cover observation of one dominant urban center with multiple outlying developed places, but the impervious image adds an important distinction: not every developed area has the same proportion of roofs and pavement.
A countywide mean of 6.54% combines extensive farm areas near zero with much higher values in the central urban area. For runoff or drainage discussions, the location and continuity of hard surfaces are more useful than the mean alone. Even so, impervious cover does not equal flood risk. Rainfall, soil, slope, storm drainage, streams, wetlands, and local infrastructure are also necessary before making a site-level conclusion.
Frequently Asked Questions
If agriculture covers 70.20% of Delaware County, why does the center look so urban?
Agriculture dominates the countywide area, but Muncie forms a large, concentrated developed core in the center. The broad rural farm area and the local urban concentration can both be true at the same time, which is why the countywide percentage and the central map appearance look very different.
Why is developed cover 19.29% when mean impervious cover is only 6.54%?
Developed classes can include lawns, trees, open soil, and other permeable surfaces around buildings and roads. Impervious cover focuses on roofs, pavement, parking areas, and similar hard materials, so its countywide mean is lower than the total developed share.
Does the 10.67% 1985–2025 class difference mean that much land was newly developed?
No. Developed conversion is listed at 2.61%, while other class difference is the largest component at 6.68%. Forest loss and agricultural loss are separate categories, and the actual timing or cause of a change requires intermediate imagery and local records.
Choose the map that matches the question, then keep the classification limits in view
For a general county profile, start with the 2025 land-cover overview. It presents the 70.20% agricultural background together with the Muncie urban core, smaller developed centers, forest and wetland fragments, and Prairie Creek Reservoir. If the goal is to discuss rural cover, add the forest-and-farmland view so the dominant urban red no longer controls the visual comparison.
Use the impervious map when the subject is roofs, pavement, parking areas, or the contrast between a dense urban core and lower-density surroundings. Place the change map after a current-cover map when discussing 1985–2025 differences. That order helps prevent the red change cells from being mistaken for all present-day development. The change image is most useful as a screening layer that points to places requiring closer historical review.
The supplied current maps represent the 2025 observation year. Construction, demolition, harvest, vegetation recovery, drainage changes, or water conditions after that observation may not appear. Mixed 30-meter cells can also simplify narrow roads, tree rows, ditches, small ponds, and building edges. Site work should therefore move to higher-resolution imagery and current local records after the countywide map has identified an area of interest.
Each original JPG measures 2480 × 1754 pixels. The files work well for screen viewing, document placement, presentations, classroom comparison, and general printing. The package does not identify them as meeting an A3 high-resolution reference, so test a large print before relying on very small legend text or fine cell detail at poster scale.
Map File Information
The ZIP contains four original JPG maps for comparing Delaware County's 2025 land cover, farmland and forest, impervious surfaces, and 1985–2025 class differences.
- Included Files: Use only the versions confirmed in the article and supplied images
- File Type: Use the confirmed download contents
- Intended Use: Printing, education, presentations, and map-based projects
Related Maps
- Delaware County New York Land Cover Map
- Kent County Delaware Land Cover Map
- New Castle County Delaware Land Cover Map
Sources and Reference Data
- MRLC Annual NLCD Data – official access point for annual land-cover and comparison products
- USGS Annual NLCD Land Cover Classification – definitions and guidance for agriculture, forest, developed land, wetlands, water, and related classes
- U.S. Census Bureau TIGER/Line Shapefiles – official county-boundary reference for Delaware County
- Delaware County City and Town Boundaries – official county map locating Muncie, Yorktown, Albany, Daleville, Eaton, Gaston, Selma, and Chesterfield
- Delaware County GIS – official local mapping for roads, parcels, water features, and other geography that is separate from land-cover classification
- City of Muncie Planning Reference – city source describing Prairie Creek Reservoir and its role in the local water system
Green Map creates custom-edited map images using open geographic data sources such as geoBoundaries, Natural Earth, OpenStreetMap, and government open data.
These maps are edited visual materials, not raw data files, and are provided for education, documents, presentations, and graphic reference.