Boone County is still overwhelmingly agricultural in the supplied 2025 summary, but its development is not evenly distributed. Farm cover dominates the north, west, and much of the interior, while Lebanon forms a strong central cluster and the southeast contains a much broader urban footprint. This Boone County Indiana Land Cover Map set compares that present-day pattern with vegetation, impervious surfaces, and mapped class differences from 1985 to 2025.
The article uses four WebP previews, and the four original 2480 × 1754-pixel JPG maps are available together in one ZIP. The files can support county profiles, classroom work, agriculture and development comparisons, and presentations where the current landscape needs to be placed beside hard-surface intensity or long-term endpoint change.
Table of Contents
Farm cover remains dominant even with a large developed southeast
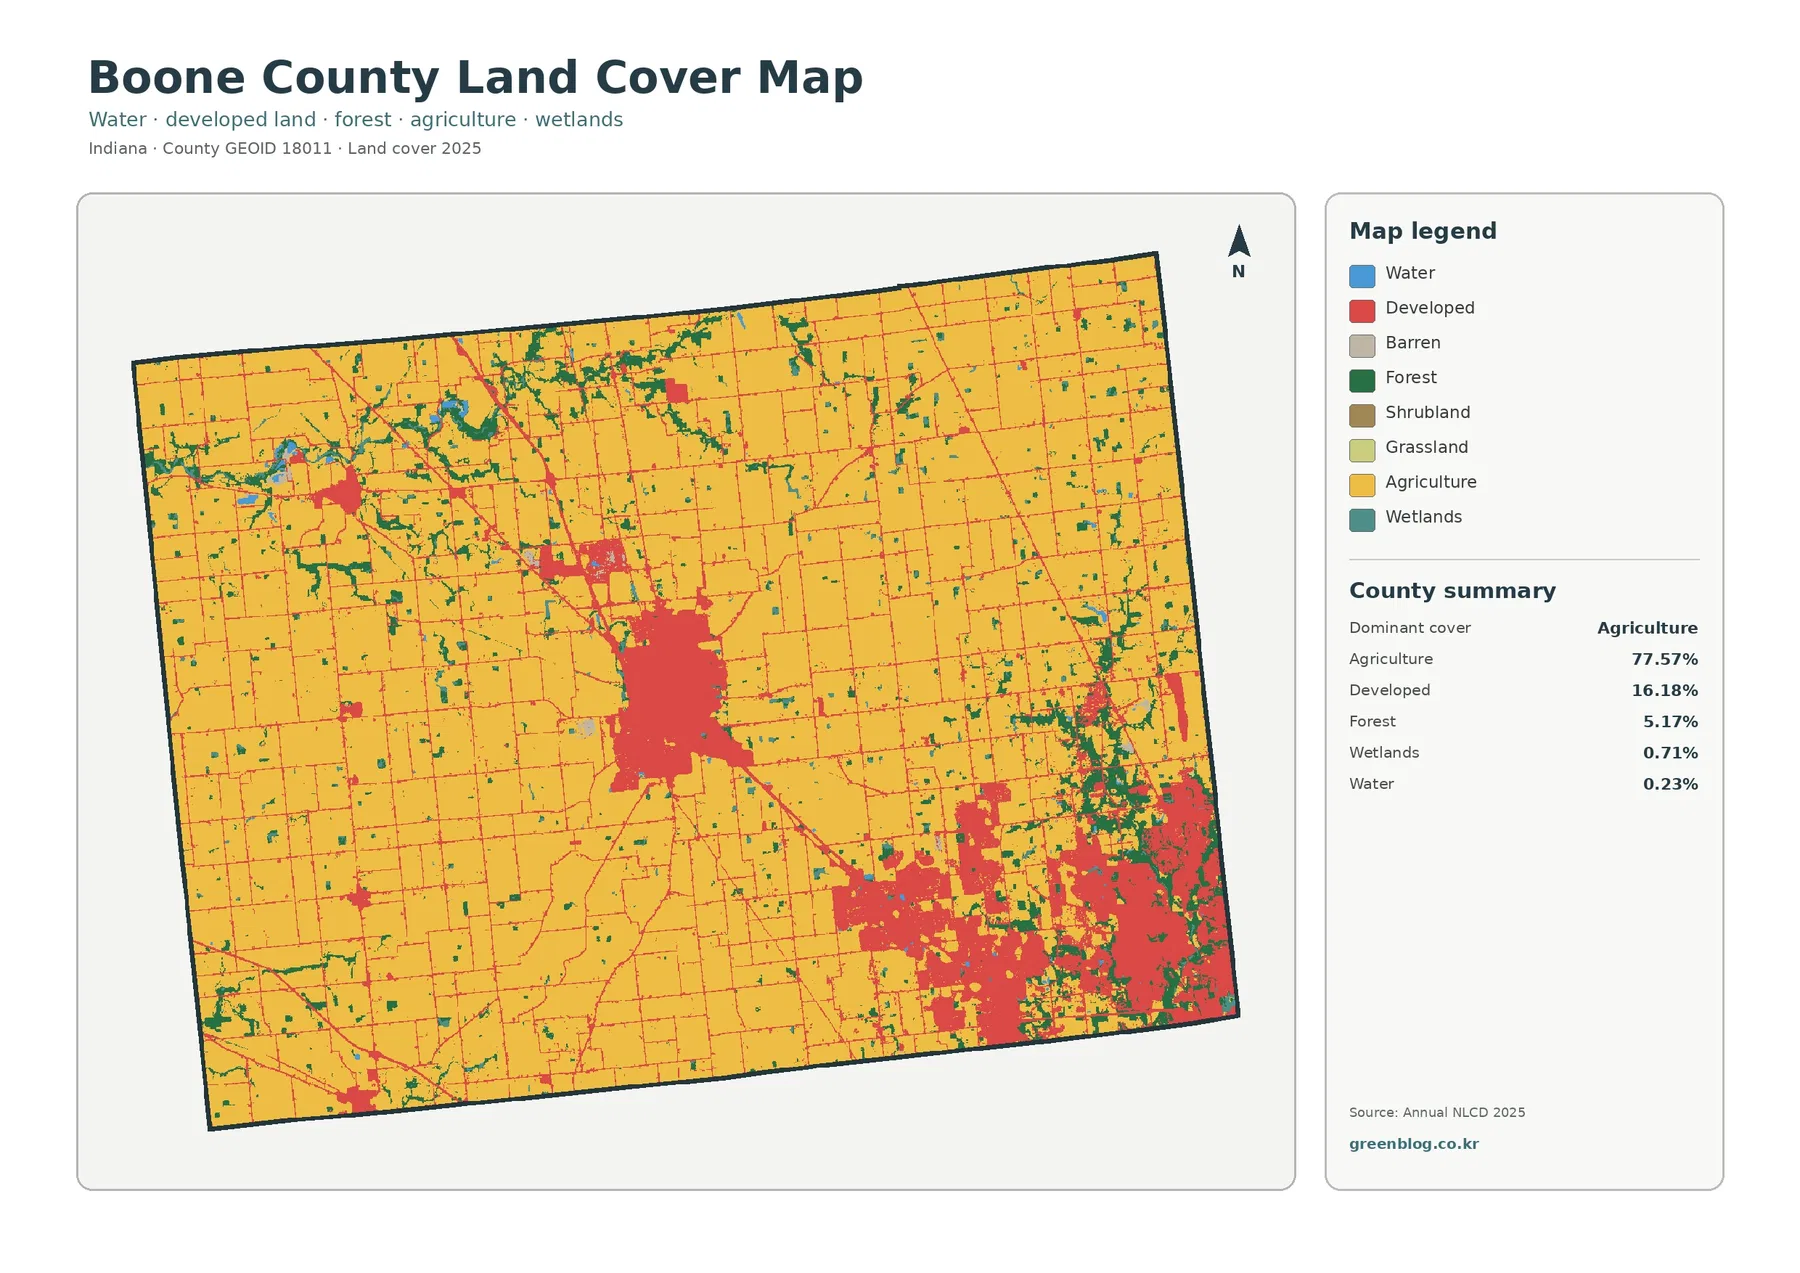
Agriculture accounts for 77.57% of Boone County, far ahead of every other class. Developed cover reaches 16.18%, forest 5.17%, wetlands 0.71%, and open water 0.23%. The yellow agricultural background therefore covers most of the county, yet the red developed cells are substantial enough to create several obvious breaks in that farm pattern rather than appearing only as isolated towns.
Lebanon stands out near the middle of the county as a compact developed center surrounded by farmland. To the southeast, red cells spread across a much larger area and continue to the county edge. Boone County’s official thoroughfare planning materials describe the southeast as part of the Indianapolis urbanized area and identify Lebanon, Zionsville, and Whitestown among the county’s largest municipalities. That makes the broad southeastern concentration consistent with the Zionsville–Whitestown side of the county, although the land-cover image itself does not draw municipal limits.
A separate developed cluster appears in the northwest and corresponds broadly with Thorntown on official county maps. Smaller red patches and thin lines are scattered through the rural grid elsewhere. These marks are useful for seeing where built surfaces interrupt cropland, but they should not be assigned to a named town, subdivision, or individual road unless a boundary or transportation map is used alongside the land-cover layer.
Forest is much less extensive than agriculture and does not form one countywide block. Dark green patches are most noticeable around irregular edges of the developed southeast, along parts of the north and east, and in smaller pieces across the interior. Wetland and water cells are limited. They can help identify places where vegetation and wetter surfaces interrupt the farm grid, but the preview does not label streams or establish regulatory wetland boundaries.
Impervious cover makes the Lebanon–southeast contrast even sharper
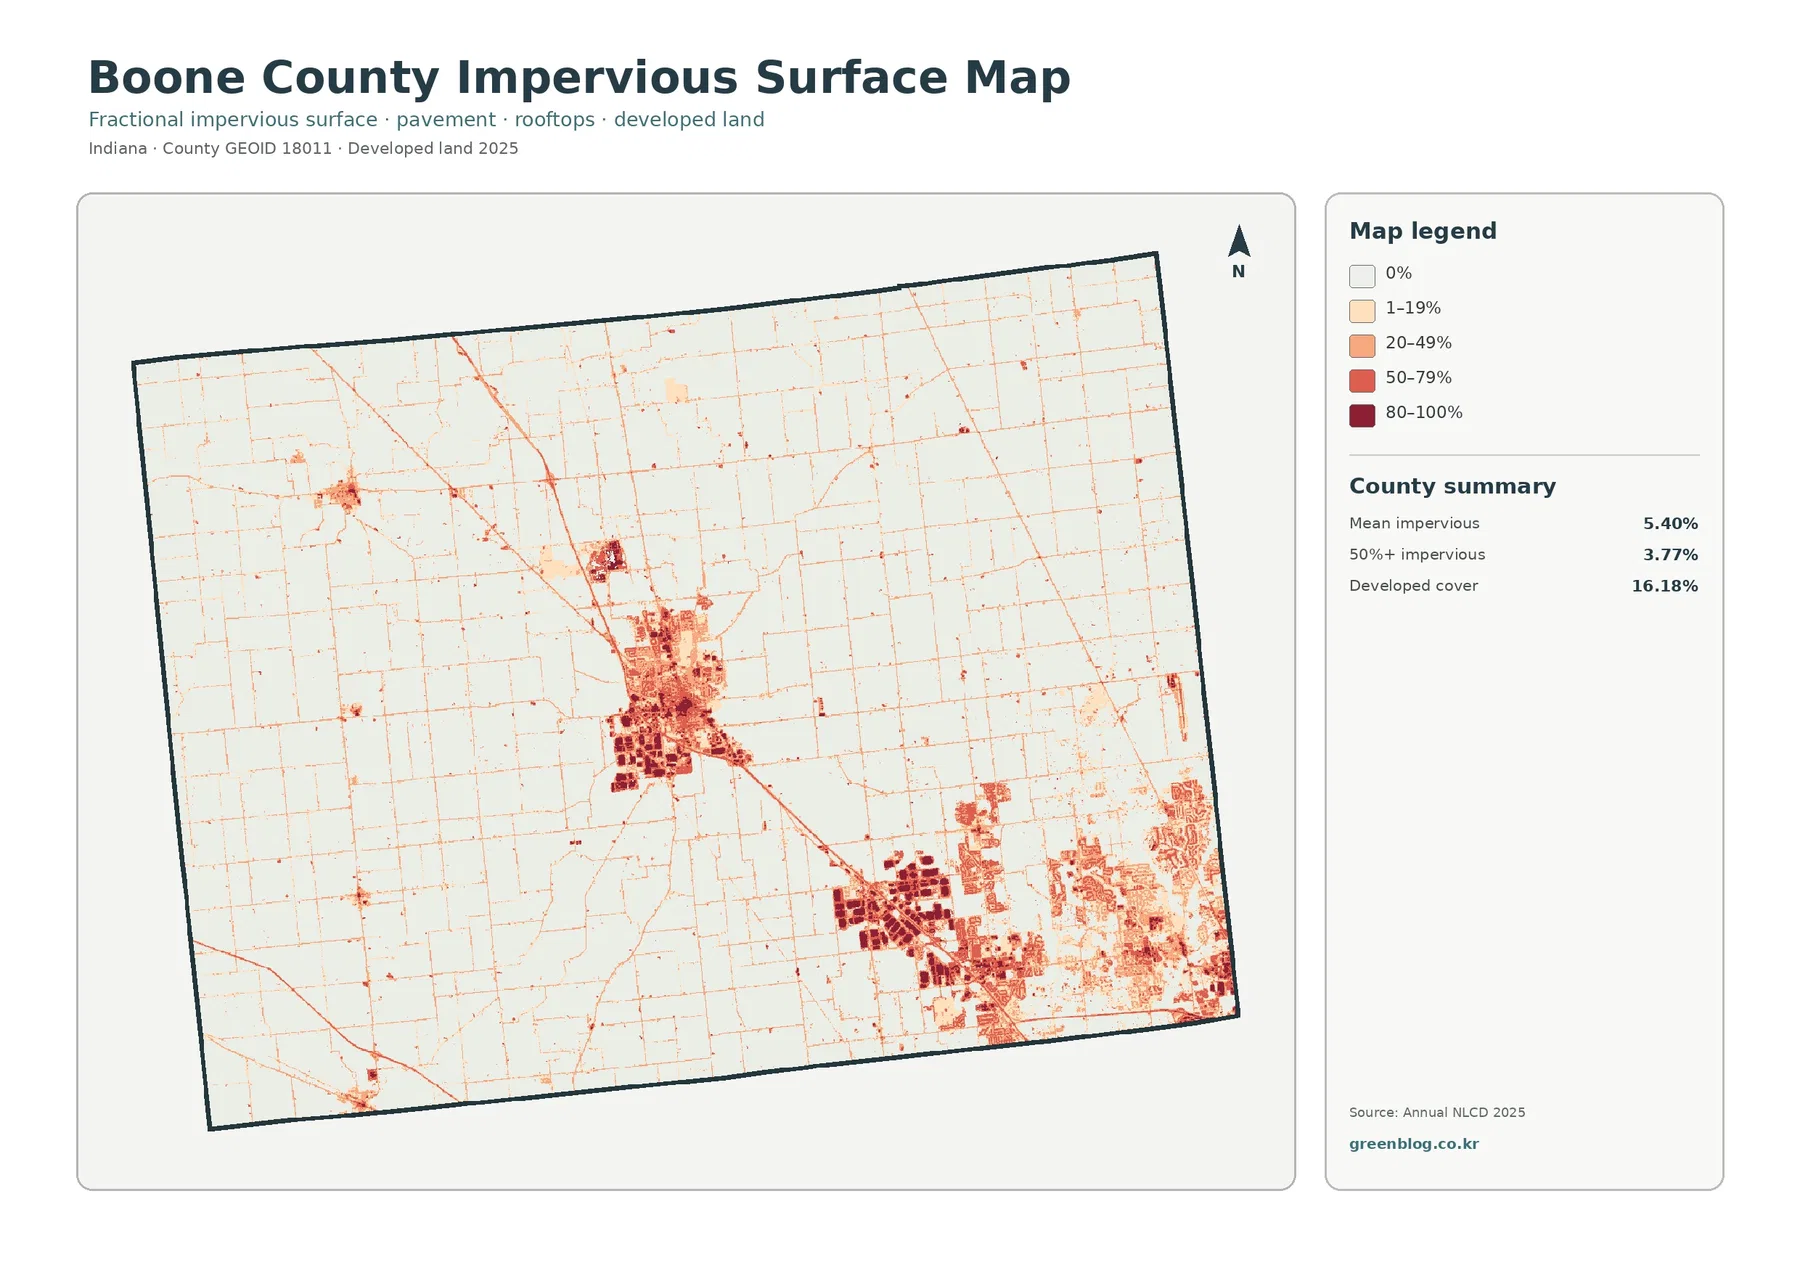
Impervious surface means rooftops, pavement, parking lots, and other hard materials that do not readily absorb rainfall. Boone County has a mean impervious value of 5.40%, while 3.77% of the county is mapped at 50% impervious or greater. Those numbers are lower than the 16.18% developed-land share because developed classes can include lawns, trees, bare soil, and other permeable surfaces around buildings and streets.
The darkest tones appear in central Lebanon and across the southeast, where many high-value patches join into broader developed areas. Thorntown produces a smaller but still visible concentration in the northwest. Between these places, fine low-impervious lines cross the agricultural interior in a regular network. The resulting image separates compact urban hard surfaces from the much lighter rural grid more clearly than the general land-cover map does.
One strong diagonal trace runs from Lebanon toward the southeast. Boone County’s official Thoroughfare Plan places I-65 along the same general connection between central Boone County and the Indianapolis side of the county, so the two can be compared at a broad scale. The preview has no route labels, however, and a visible line should not be named as I-65 or another highway without checking the official road map at the same location.
The countywide mean also hides substantial local variation. Large rural areas are close to zero impervious cover, while city centers and major developed sites contain much higher values. For runoff or drainage questions, the location of dark surfaces matters more than the average alone. Even then, impervious cover is only one input; rainfall, soils, elevation, streams, wetlands, and drainage infrastructure are also needed before making a flood or stormwater judgment.
Cropland forms the continuous background, while forest stays fragmented
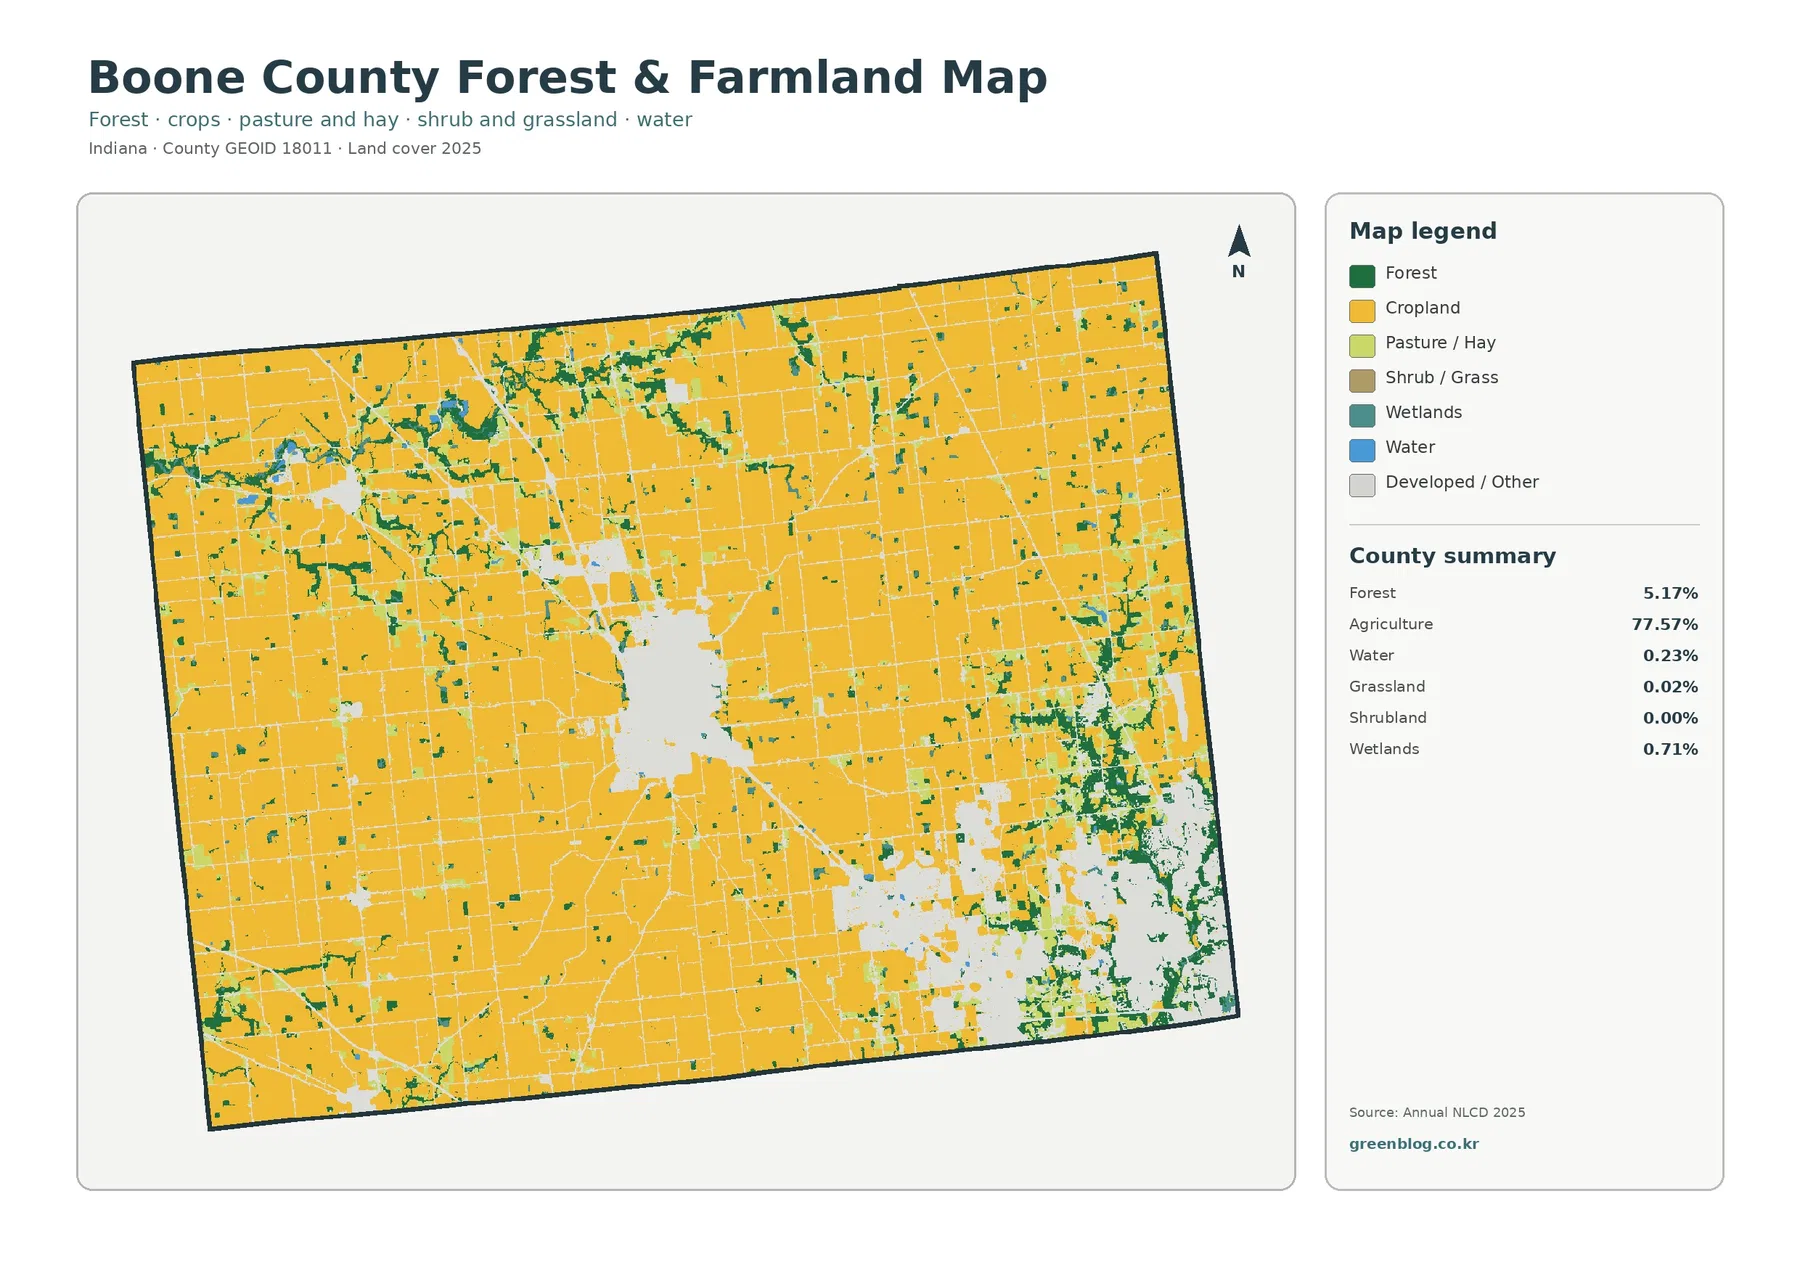
With development faded, the scale of Boone County’s agricultural cover becomes difficult to miss. Cropland fills broad blocks through the north, west, center, and southwest. The largest blank openings correspond to Lebanon and the developed southeast, while smaller openings mark other towns and built sites. Forest, at 5.17%, appears mostly as small irregular patches and narrow strips rather than a continuous woodland region.
The other summarized natural classes are small. Wetlands account for 0.71%, open water for 0.23%, grassland for 0.02%, and shrubland is listed as 0.00% in the supplied summary. This is therefore not a county where water, wetland, grassland, or shrubland compete with agriculture for the largest share. Their value on the map comes from showing local interruptions and edges within an overwhelmingly farmed landscape.
Purdue Extension Boone County describes the county as one of Indiana’s prominent agricultural counties, particularly for corn and soybeans. Its local agriculture page reports that 85% of the county’s land area was in farms in the 2017 Census of Agriculture and that 62% was planted to corn or soybeans in 2019. Those figures should not be substituted for the 2025 NLCD value of 77.57% agriculture because the years, definitions, and measurement methods differ. They do, however, provide useful local context for why agriculture is such a strong visual feature.
Straight agricultural edges may resemble parcel boundaries, but Annual NLCD is a raster classification rather than a cadastral map. A 30-meter cell receives one predominant cover class even when crops, a ditch, a tree line, pavement, grass, and a building share the same area. The map is well suited to county-scale comparison, not to determining ownership, field acreage, crop type, or an exact farm boundary.
The 12.17% endpoint difference is broader than new development alone
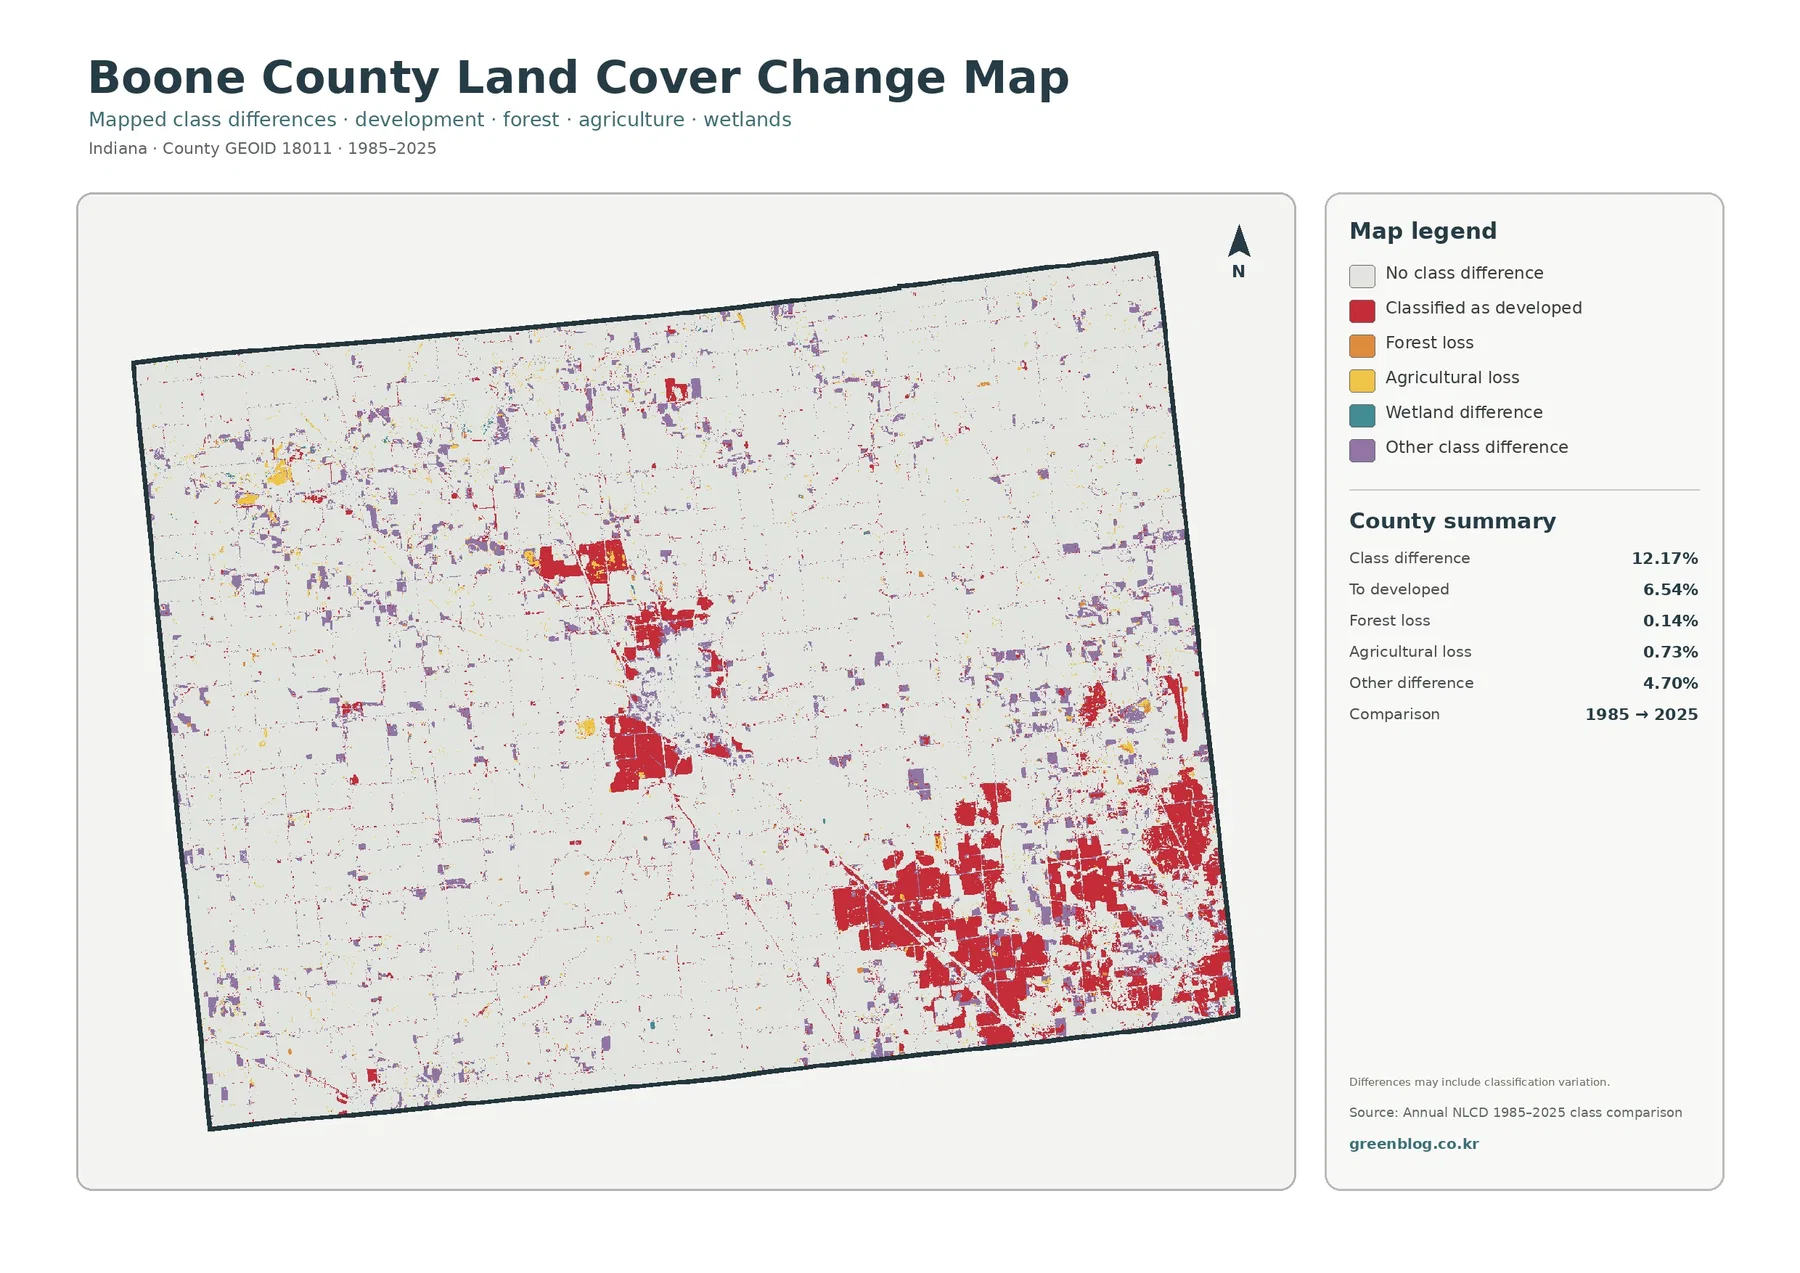
The change summary reports 12.17% total class difference between 1985 and 2025. Cells classified as developed account for 6.54%, forest loss for 0.14%, agricultural loss for 0.73%, and other class difference for 4.70%. Wetland difference appears in the legend but has no separate percentage in the summary. A residual calculation or visual estimate should therefore not be presented as an official wetland-change value.
Red developed-conversion cells are especially extensive in the southeast and are also visible around Lebanon and the northwestern developed cluster. Some red traces extend between the larger concentrations. Agricultural-loss and forest-loss colors are much less prominent, while purple other-difference cells are scattered more widely across the county. The change image therefore contains both concentrated development-related differences and a broader background of smaller classification changes.
“Classified as developed” does not provide a construction date or identify a specific project. It means a cell had another class at the 1985 endpoint and a developed class at the 2025 endpoint. Likewise, forest loss and agricultural loss do not name logging, abandonment, road work, housing, industrial development, weather, or classification variation as the cause. Intermediate imagery, permits, planning records, and local histories are needed to explain when and why a particular site changed.
The 12.17% figure should not be described as the share of Boone County that was damaged or newly urbanized over forty years. It includes several kinds of endpoint difference and may also reflect mixed pixels or classification variation. A place that changed and later returned to its original class might not appear as different at the two endpoints. For present conditions, the 2025 map remains the primary reference; the change map adds historical comparison rather than replacing it.
Planning maps answer different questions from land-cover maps
Boone County’s Area Plan Commission maintains planning, zoning, floodplain, and long-range development resources, and its current site points readers to a 2025–2026 comprehensive-plan update. Those documents concern legal and policy decisions about future growth. The land-cover images on this page describe what the surface was classified as in 2025. A developed cell is not a zoning district, and an agricultural cell is not proof that a parcel is legally zoned for agriculture.
This distinction matters in the southeast, where the land-cover maps show a large urban footprint beside extensive remaining farmland. Zionsville, Whitestown, county planning areas, and unincorporated land have different jurisdictional and planning boundaries. The red surface class cannot be used to draw those boundaries. Anyone checking development rights, setbacks, ownership, or a proposed project needs current local GIS and zoning records rather than the NLCD color alone.
The same caution applies to wetlands and forest. A teal wetland-class cell is a remotely classified surface, not an automatic jurisdictional wetland determination. A forest cell does not create a conservation easement or prohibit development. Land cover is most useful for broad landscape description, screening, education, and comparison; legal decisions require the agencies and records responsible for those questions.
How to use the four maps without mixing their meanings
Start with the 2025 countywide map when the goal is to explain Boone County in one image. It captures the 77.57% agricultural background, the Lebanon center, the large southeastern developed area, and smaller natural-cover patches. The vegetation-focused map is better when the question is about cropland and forest. The impervious image is better for rooftops and pavement, while the 1985–2025 comparison should be introduced only after current cover is clear.
For an agriculture lesson, the general and forest-farmland maps work well together because they show both the countywide farm share and the way development interrupts it. For an urbanization discussion, pair the general map with the impervious image to compare developed classes with actual hard-surface intensity. A planning presentation can use the change map as a screening layer, but any statement about a specific development project should be checked against official planning and permit records.
Annual NLCD uses 30-meter square cells. That scale is appropriate for countywide patterns but too coarse for a property survey. Small ponds, narrow tree rows, drainage ditches, road shoulders, and individual buildings may be generalized into a neighboring or predominant class. Enlarging the image makes the cells look bigger; it does not create missing parcel detail. Site-level work requires higher-resolution imagery and current local data.
The current maps represent the supplied 2025 observation year. Later construction, crop rotation, tree removal, vegetation recovery, temporary standing water, or other surface changes may not appear. The 1985–2025 image is also an endpoint comparison rather than a year-by-year record. When the question is current zoning, construction, ownership, or infrastructure, the most recent government source should take priority over this static reference set.
What is included in the four-JPG download
The ZIP contains one JPG each for 2025 land cover, forest and farmland, impervious surface and developed land, and 1985–2025 land-cover change. Every image measures 2480 × 1754 pixels. The countywide map works as the main reference, and one of the specialized views can be added according to the question being discussed. The package does not mark these files as meeting an A3 high-resolution reference, so a test print is sensible before using them for a large poster.
These graphics are suitable for general reference, lessons, presentations, and county-scale comparison. They are not survey plats, parcel maps, official wetland determinations, flood-insurance products, engineering drawings, or zoning maps. Keeping those limits clear allows the maps to do what they do well: provide a readable overview of how agriculture, development, forest, water-related cover, hard surfaces, and endpoint differences are distributed across Boone County.
Frequently Asked Questions
If agriculture is 77.57%, why does southeast Boone County look so developed?
The 77.57% figure is a countywide share, so large farm areas in the north, west, and interior coexist with a concentrated southeastern urban footprint. Official county planning materials also place the southeast within the Indianapolis urbanized context. The land-cover image shows that concentration, but it does not define municipal boundaries or explain every development project.
Why is developed cover 16.18% when mean impervious cover is only 5.40%?
Developed land-cover classes can include lawns, trees, bare soil, and other permeable surfaces around buildings and roads. Impervious cover isolates hard materials such as rooftops, pavement, and parking areas, so its countywide mean is lower than the broader developed-class share.
Does the 12.17% class difference mean that much of the county became developed?
No. The 12.17% total includes 6.54% classified as developed plus forest loss, agricultural loss, other class difference, and wetland difference that has no separate summary percentage. It represents cells classified differently at the 1985 and 2025 endpoints, not a single development or damage measure.
Sources and Reference Data
- MRLC Annual NLCD Data – official access point for annual land-cover and comparison products
- USGS Annual NLCD Land Cover Classification – definitions and guidance for agriculture, forest, developed land, wetlands, and related classes
- U.S. Census Bureau TIGER/Line Shapefiles – official boundary reference for Boone County
- Boone County Area Plan Commission – Comprehensive Plan – official long-range planning and growth information for the county
- Purdue Extension Boone County – Agriculture and Natural Resources – local agriculture context, including farm, corn, and soybean statistics
- Boone County Thoroughfare Plan – official transportation and urbanization context for Lebanon, Zionsville, Whitestown, and I-65
Map File Information
The ZIP contains four original JPG maps for comparing Boone County's 77.57% agricultural cover, Lebanon and southeast development, impervious surfaces, and 1985–2025 class differences.
- Included Files: Use only the versions confirmed in the article and supplied images
- File Type: Use the confirmed download contents
- Intended Use: Printing, education, presentations, and map-based projects
Related Maps
- Adams County Indiana Land Cover Map
- Allen County Indiana Land Cover Map
- Bartholomew County Indiana Land Cover Map
Green Map creates custom-edited map images using open geographic data sources such as geoBoundaries, Natural Earth, OpenStreetMap, and government open data.
These maps are edited visual materials, not raw data files, and are provided for education, documents, presentations, and graphic reference.