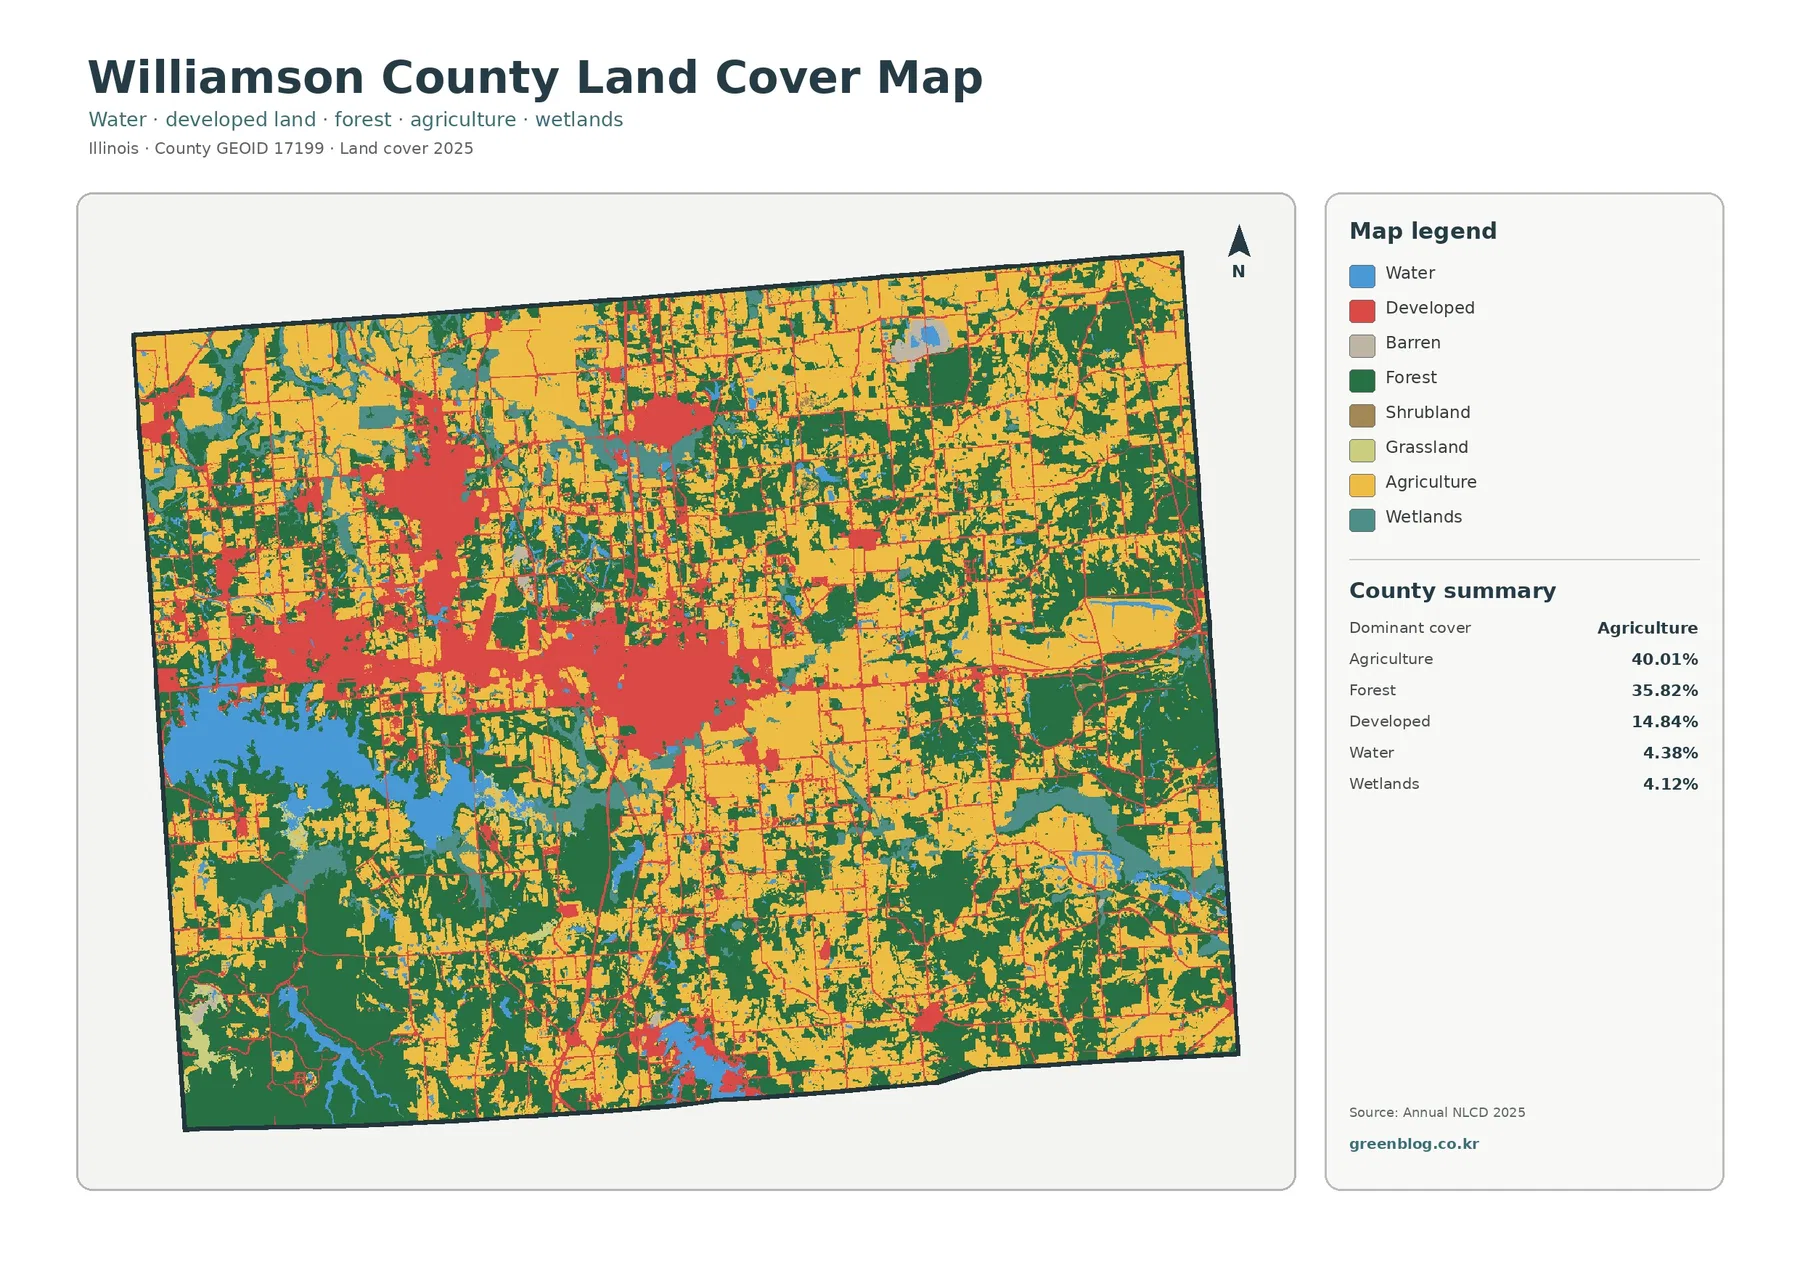
Williamson County has a more mixed land-cover pattern than many farm-dominated Illinois counties. The 2025 summary places agriculture at 40.01% and forest at 35.82%, so neither category overwhelms the county. Developed land accounts for 14.84%, while water and wetlands add another 4.38% and 4.12%. On the map, the strongest built-up cluster runs across the central and western part of the county, large water areas stand out toward the west and southwest, and broad forest blocks become more common to the south and east.
The four map views separate those patterns so they are easier to compare. One shows the full 2025 land-cover mix, another isolates forest and farmland, a third maps impervious surface and developed land, and the last compares 1985 with 2025. The original JPG set is available in one download farther down the page for printing, reference work, classroom use, or side-by-side map comparison.
Table of Contents
A county split between fields and woods rather than one dominant cover
Agriculture is the largest 2025 class at 40.01%, but forest is close behind at 35.82%. That balance is immediately visible because the yellow agricultural areas and dark-green forest areas both occupy large, continuous parts of Williamson County. Farmland is generally more open across the northern portion and across parts of the interior, while forest becomes more extensive toward the south and east. The boundary between the two is irregular, with many farm openings surrounded by wooded strips and many forest blocks interrupted by fields.
Water and wetlands are smaller by percentage, yet they have a strong visual effect. Water covers 4.38% of the county and wetlands 4.12%. Large blue areas in the west and southwest interrupt both forest and farmland, and wetland colors frequently appear near those water features and in scattered low-lying patches elsewhere. Because these classes occur in recognizable clusters rather than being evenly sprinkled across the county, their importance is easier to understand from the map than from percentages alone.
The developed center stands apart from the wooded south and open north
Developed land covers 14.84% of Williamson County, but it is not distributed evenly. The most conspicuous built-up area stretches through the central and western portion of the map, with several branches extending north, south, and east from the main concentration. Smaller developed patches appear elsewhere, but they do not match the size or continuity of the central cluster. Moving away from that area, red developed pixels give way to farmland, forest, and scattered wetlands rather than ending at a single clean edge.
This transition matters because land cover is not the same thing as zoning or legal land use. A place classified as developed by Annual NLCD is being described by its visible surface cover—such as buildings, streets, or other developed surfaces—not by its ownership or development rights. Likewise, a yellow agricultural area represents land classified in an agricultural cover category, not a statement that every parcel is actively growing the same crop in the same season.
Forest and farmland form different patterns on opposite sides of the county
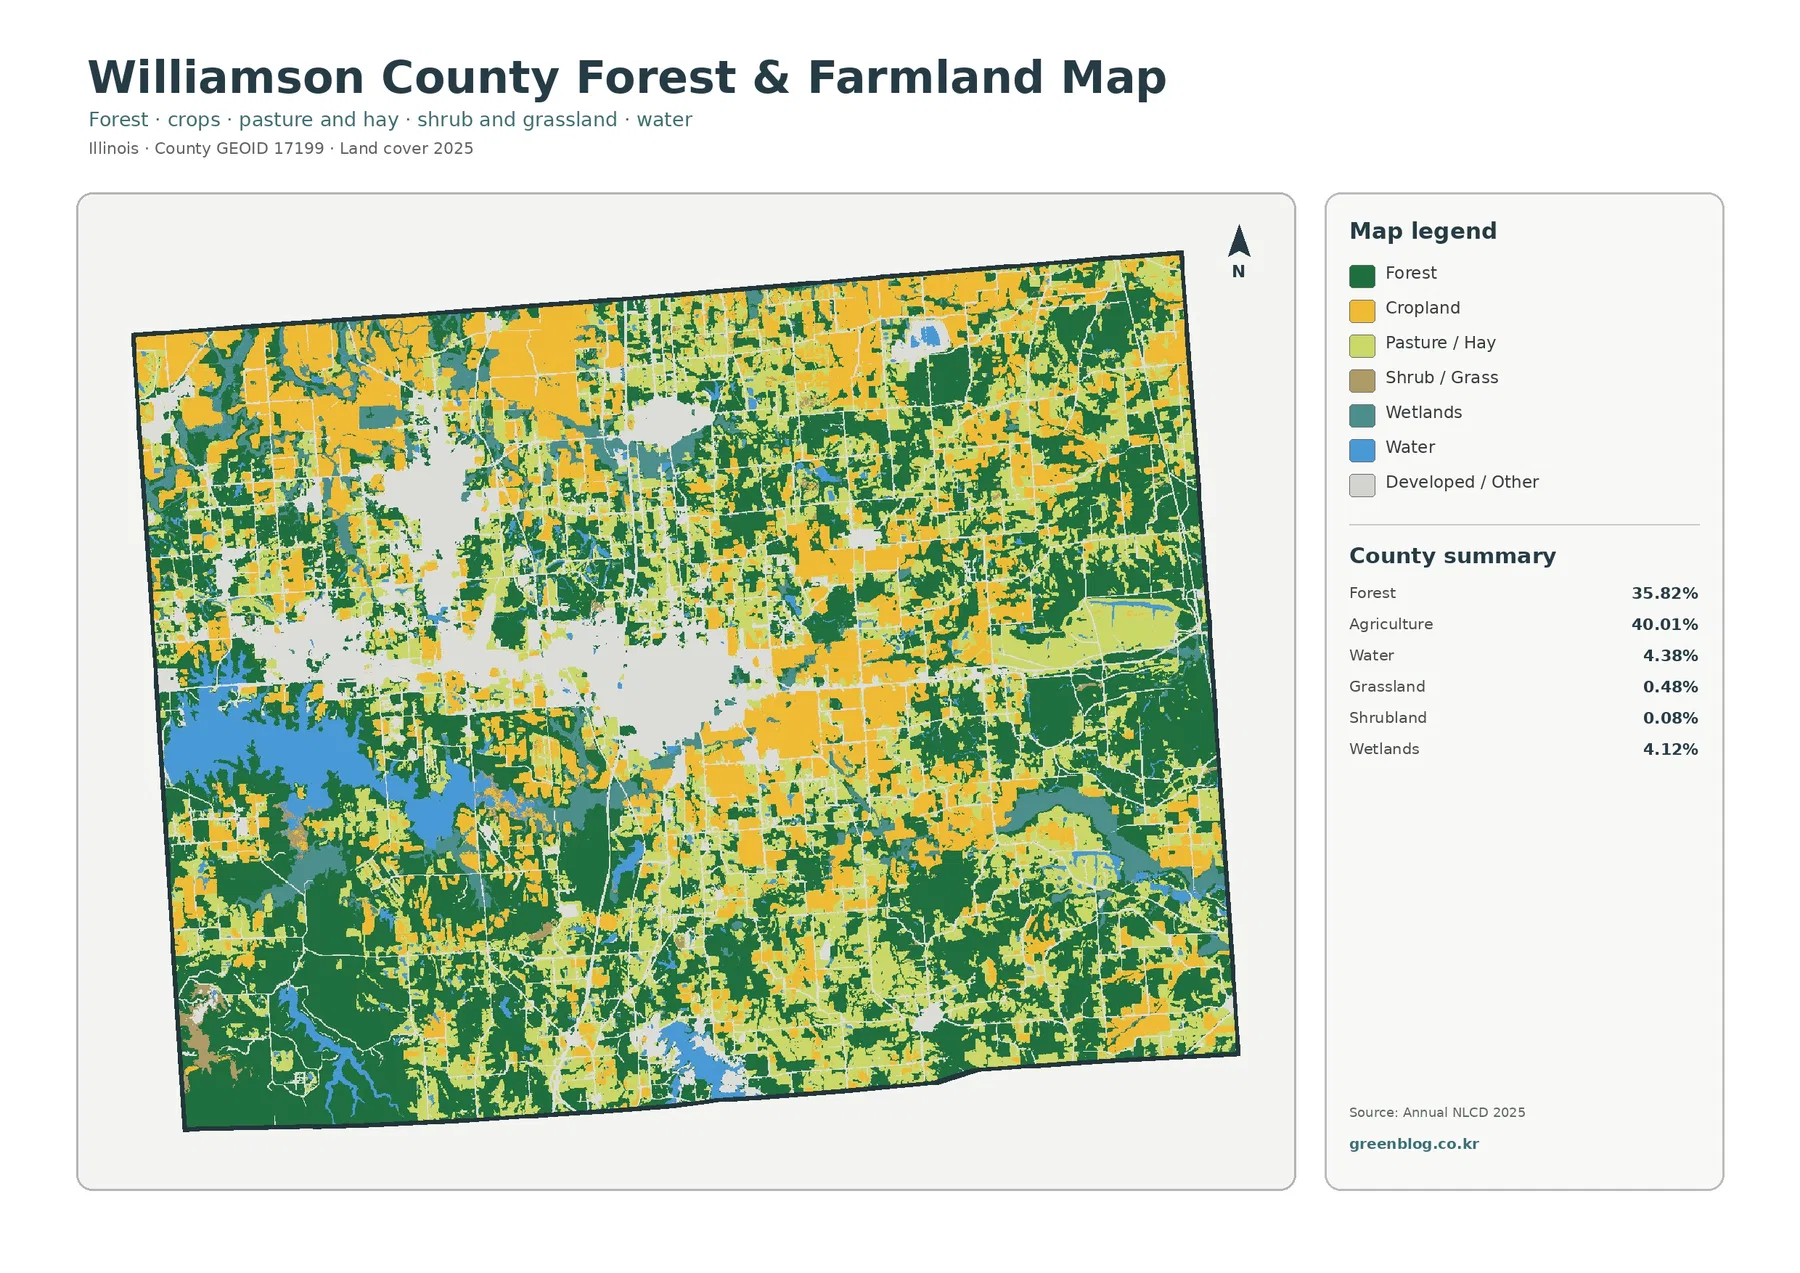
The forest-and-farmland view removes much of the visual competition from developed and other classes. That makes the north-to-south contrast easier to see. Cropland forms broad open blocks through much of the north, while forest becomes increasingly continuous in the south and along several corridors in the east. In the southwest, water breaks up large wooded areas, creating a mosaic of forest, shoreline, wetland, and smaller farm openings.
Forest does not form one single solid mass. Narrow wooded connectors and irregular patches extend between the larger blocks, especially around places where farm fields are more fragmented. Agriculture also continues well into the southern half, but it tends to appear in smaller openings where the surrounding forest cover is stronger. Reading the two classes together gives a better sense of the county than treating the 40.01% agricultural share and 35.82% forest share as separate statistics.
Impervious surface reveals the densest built areas inside the developed class
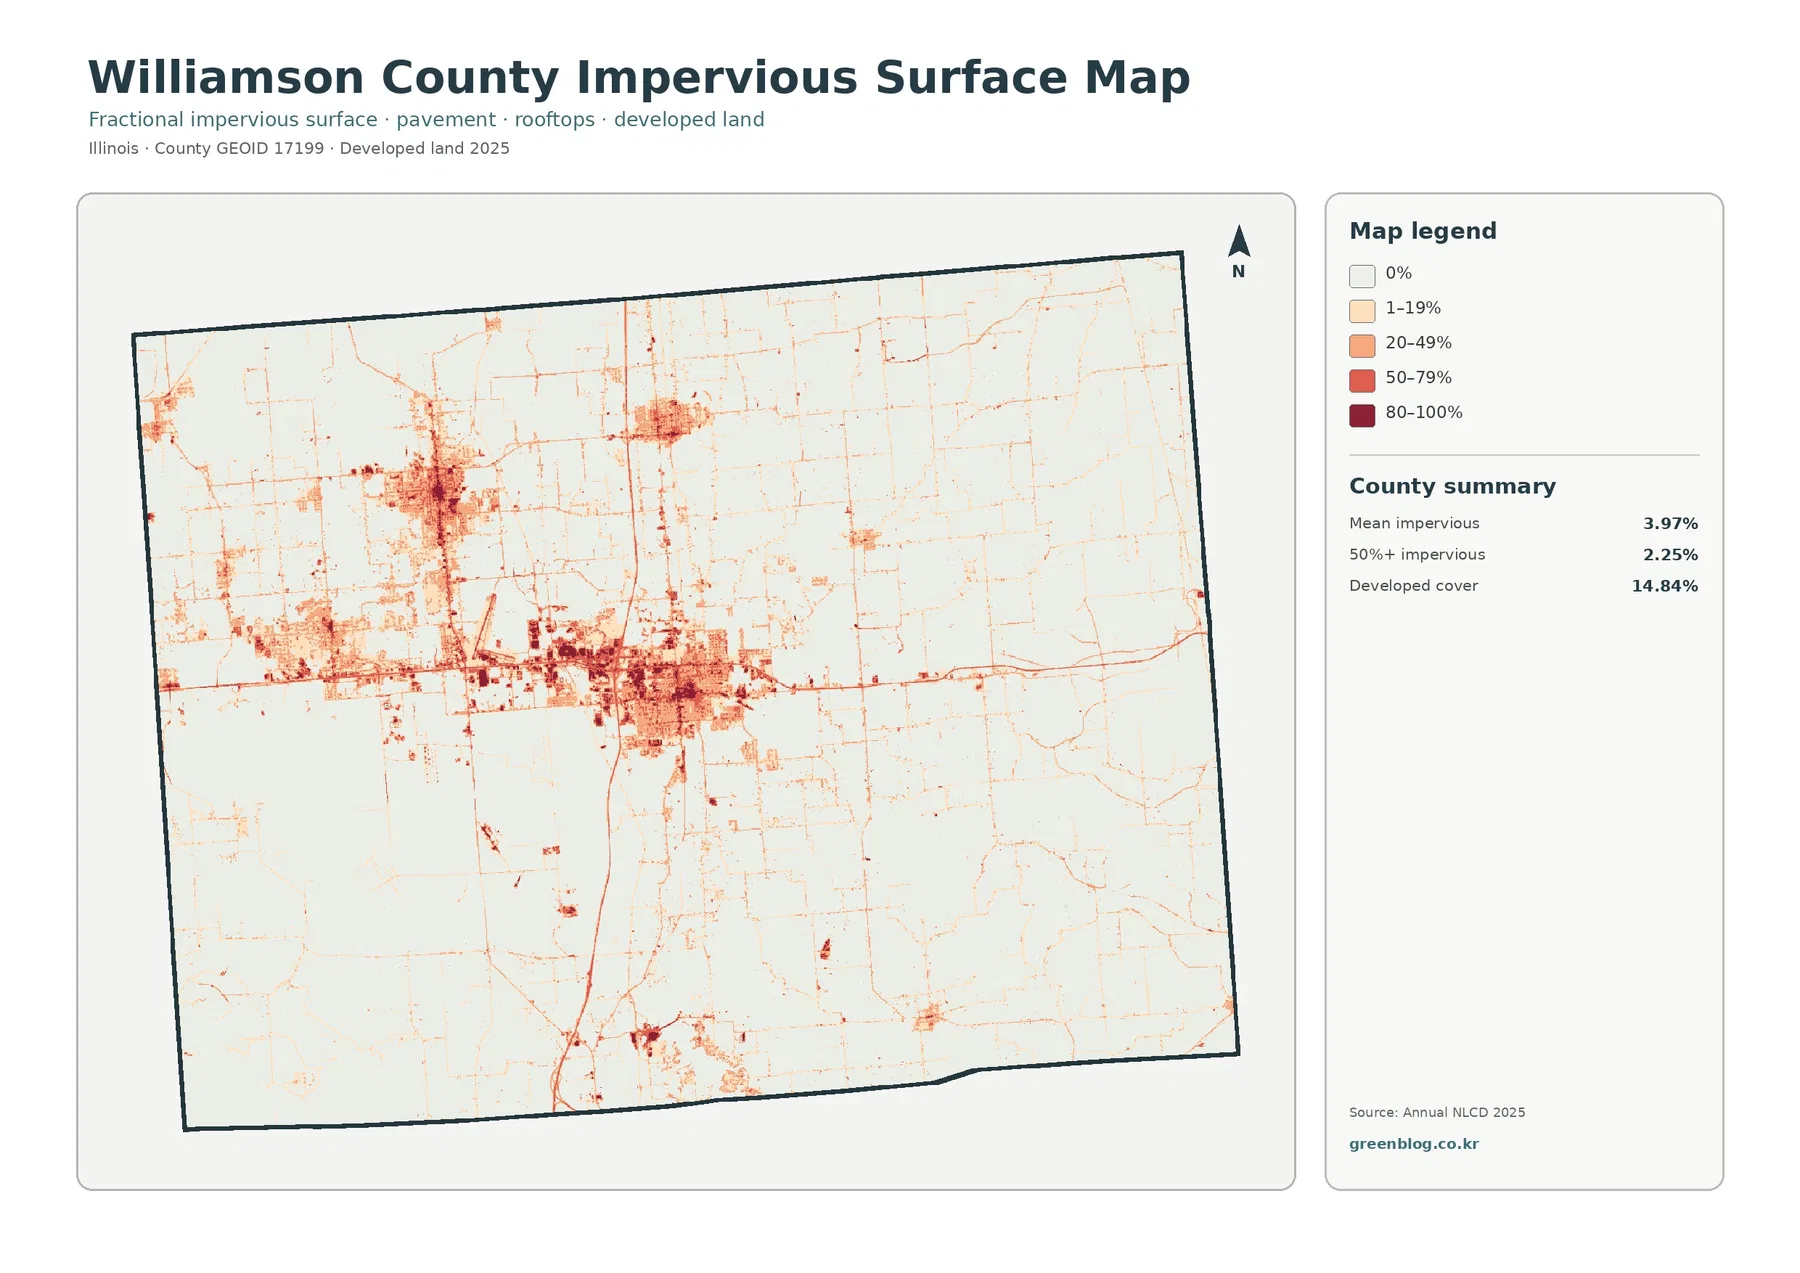
Impervious surface means pavement, rooftops, and similar surfaces that do not readily absorb water. Williamson County has a mean impervious value of 3.97%, and 2.25% of the county is mapped at 50% impervious or higher. The average is modest because large agricultural and forest areas have very low values, yet the central developed zone contains obvious dark clusters. Major road lines and compact built locations are much easier to pick out here than on the general land-cover map.
Outside the central cluster, the map becomes pale quickly. Thin road traces cross the rural landscape, with occasional small developed nodes, but most forest and farmland remains close to zero or in the lowest impervious classes. Comparing this image with the 14.84% developed-land figure is useful because developed cover can include lower-intensity areas that are not dominated by pavement or roofs. Impervious percentage should also not be treated as a direct substitute for population density or building counts.
The 1985–2025 comparison shows widespread class differences, not one simple change
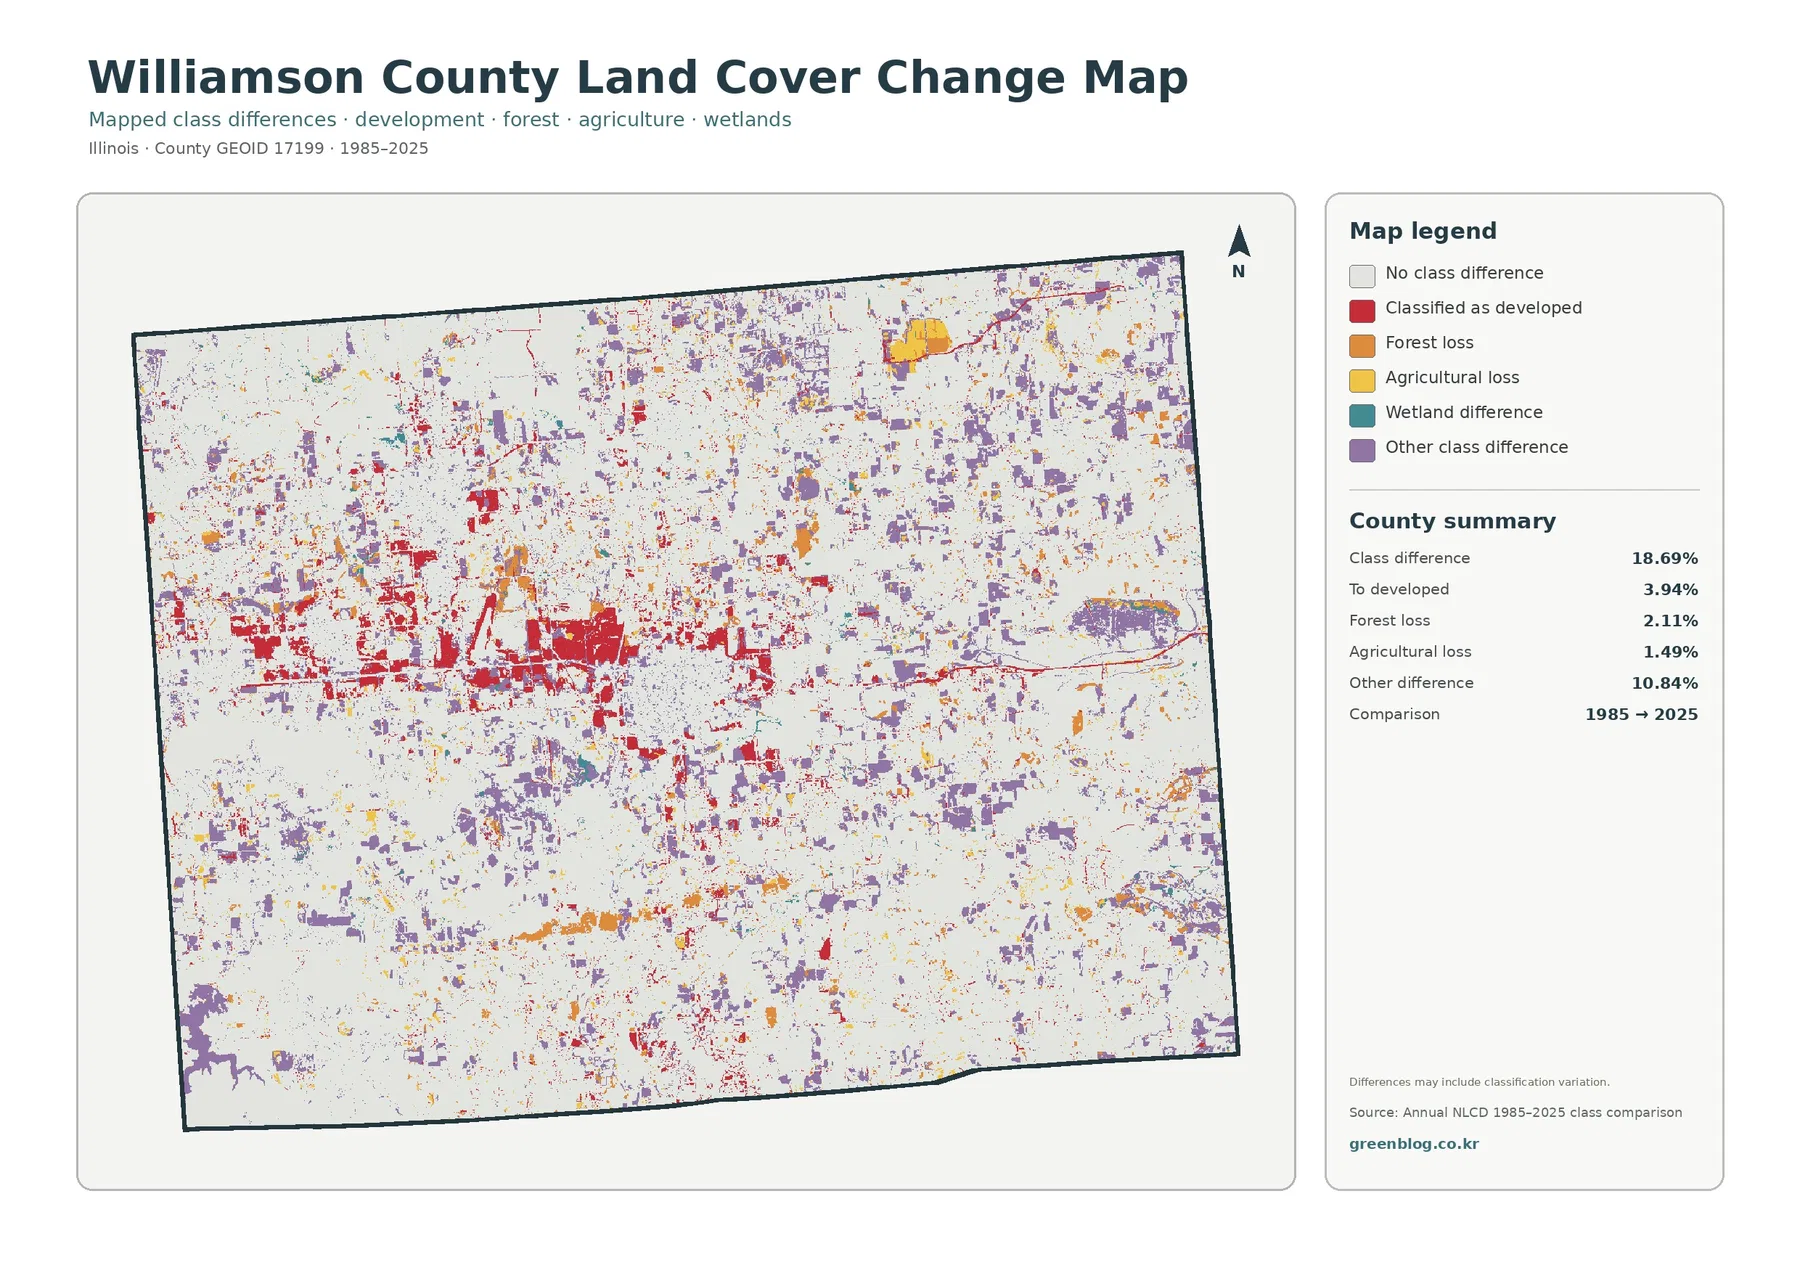
The long-term comparison reports a total class difference of 18.69% between 1985 and 2025. Within that total, 3.94% is mapped as change to developed, 2.11% as forest loss, and 1.49% as agricultural loss. The largest single summary category is “other difference” at 10.84%. That last figure is important because the map itself warns that some differences may include classification variation rather than a straightforward physical conversion on the ground.
Red areas classified as developed change are most concentrated around the established central built-up zone, with smaller patches scattered elsewhere. Orange forest-loss areas and purple other-class differences appear much more broadly across the county. The south still contains extensive forest in 2025 even though change colors are present there, while northern agricultural areas also contain many small differences. The comparison is therefore best used to locate areas worth closer review rather than to claim that every colored pixel represents a confirmed land-use event.
How the four maps answer different questions about the same place
The general land-cover map is the best starting point when the goal is to see the whole county at once. It shows where fields, woods, development, water, and wetlands meet. The forest-and-farmland version is more useful when the question is specifically about the relationship between the two dominant cover types. The impervious map then narrows attention to the most built surfaces, while the change map introduces the time dimension without mixing it into the 2025 cover totals.
A practical comparison can begin with the central developed area. First locate its extent on the general map, then check where the impervious map becomes darker inside that same area. For the south, identify the large forest blocks on the forest-and-farmland map and then compare them with the scattered orange and purple differences on the change image. In the west and southwest, the general map is especially useful because the shape of the water areas gives a clear geographic reference for the neighboring forest and wetland cover.
Using the JPG set for printing, reference, and map comparison
The four JPG files work well as a coordinated set because each one keeps the same county boundary while changing the information displayed inside it. For a simple reference sheet, use the general land-cover map first and add one specialized map that matches the subject. A forest or agriculture discussion benefits most from the forest-and-farmland view, while a development discussion is clearer when the impervious map is placed beside the full land-cover map.
The change map should be labeled carefully in presentations because its colors describe differences between two classification years, not current land-cover percentages. The legend is part of the map and should remain visible when the image is cropped or printed. If a project depends on parcel-level accuracy, narrow roads, small ponds, or a specific property boundary, these county-scale maps should be treated as overview material and supplemented with more detailed local data.
Williamson County land cover JPG download
Reading limits and classification notes
Annual NLCD is a land-cover classification, so it describes what the surface is covered by rather than what a parcel is legally allowed to be used for. A developed pixel does not define zoning, ownership, or building rights. Agricultural cover does not mean that every pixel represents the same crop at the same time. Forest, wetland, and water classes also depend on the scale and classification rules used by the dataset.
County-scale raster data can simplify narrow features and small sites. A thin stream, a narrow wooded edge, or a small road may occupy too little area to appear exactly as it would in a high-resolution aerial image. Differences between 1985 and 2025 also include possible classification variation, as noted on the map. These maps are therefore strongest for recognizing broad patterns, comparing major cover types, and selecting areas for closer investigation.
Frequently Asked Questions
Is Williamson County mainly farmland or forest?
Farmland is slightly larger in the 2025 summary at 40.01%, while forest covers 35.82%. The difference is only 4.19 percentage points, so both are major parts of the county landscape. Farmland appears more continuously across much of the north, while forest is broader through the south and east and around some of the larger water areas.
Why is developed land 14.84% when mean impervious cover is only 3.97%?
The developed category can include lower-intensity built areas that still contain grass, trees, or other pervious surfaces. Impervious cover measures the fraction occupied by surfaces such as pavement and rooftops. Williamson County therefore has a visible developed zone without having the whole developed class covered by highly impervious surfaces.
Does the 18.69% class difference mean that nearly one-fifth of the county definitely changed land use?
No. The map compares classifications from 1985 and 2025, and its note states that some differences may include classification variation. The mapped categories—3.94% to developed, 2.11% forest loss, 1.49% agricultural loss, and 10.84% other difference—are useful for identifying broad areas of change, but parcel-level conclusions need additional evidence.
Map File Information
The ZIP contains the general land-cover map, forest and farmland map, impervious/developed land map, and the 1985–2025 change map.
- Included Files: Use only the versions confirmed in the article and supplied images
- File Type: Use the confirmed download contents
- Intended Use: Printing, education, presentations, and map-based projects
Related Maps
- Adams County Illinois Land Cover Map
- Alexander County Illinois Land Cover Map
- Bond County Illinois Land Cover Map
Sources and references
- MRLC Annual NLCD Data — official access point for Annual NLCD land-cover data used for the mapped classes.
- USGS Annual NLCD Land Cover Classification — definitions and interpretation guidance for the land-cover classes.
- U.S. Census Bureau TIGER/Line Shapefiles — county boundary and related geographic reference data.
Green Map creates custom-edited map images using open geographic data sources such as geoBoundaries, Natural Earth, OpenStreetMap, and government open data.
These maps are edited visual materials, not raw data files, and are provided for education, documents, presentations, and graphic reference.