Tazewell County combines two landscapes that are easy to distinguish on the 2025 maps. Agriculture covers 73.30% of the county and dominates much of the central, southern, and eastern area, while the Illinois River side and the northern part of the county contain larger concentrations of developed land, forest, water, and wetlands. This page brings together the general land-cover map, a forest-and-farmland view, an impervious-surface map, and a 1985–2025 change comparison so each pattern can be read in the right context.
After viewing the maps on the page, you can download the four original JPG files together in one ZIP. The set works well for comparing the broad farm landscape with the river edge, locating the county’s main developed areas, seeing where pavement and rooftops are most concentrated, and identifying places where the mapped class differs between 1985 and 2025. Land cover describes what physically covers the ground in the imagery; it is not the same as zoning, ownership, parcel boundaries, or a legal land-use designation.
Table of Contents
A 73.30% agricultural landscape changes noticeably near the river and cities
The countywide land-cover map is mostly agricultural yellow, but the pattern is not uniform from one edge of Tazewell County to the other. Agriculture accounts for 73.30% of the 2025 summary, followed by developed land at 13.79% and forest at 8.79%. Water covers 1.74%, while wetlands account for 1.73%. Those percentages make agriculture the clear dominant class, yet the western and northern parts of the map contain enough other cover types to create a much more mixed appearance than the broad farm areas farther south and east.
Along the western side, the Illinois River forms a strong water feature and sits next to a patchwork of forest, wetland, farmland, and developed land. The northwest contains one of the largest developed concentrations in the county, with additional built-up areas farther north and inland. The county’s official history page places it on the Illinois River next to Peoria and identifies Pekin as the county seat. That local context helps explain why the river side looks different from the large agricultural blocks that occupy much of the rest of the county, without treating the land-cover map as a municipal-boundary map.
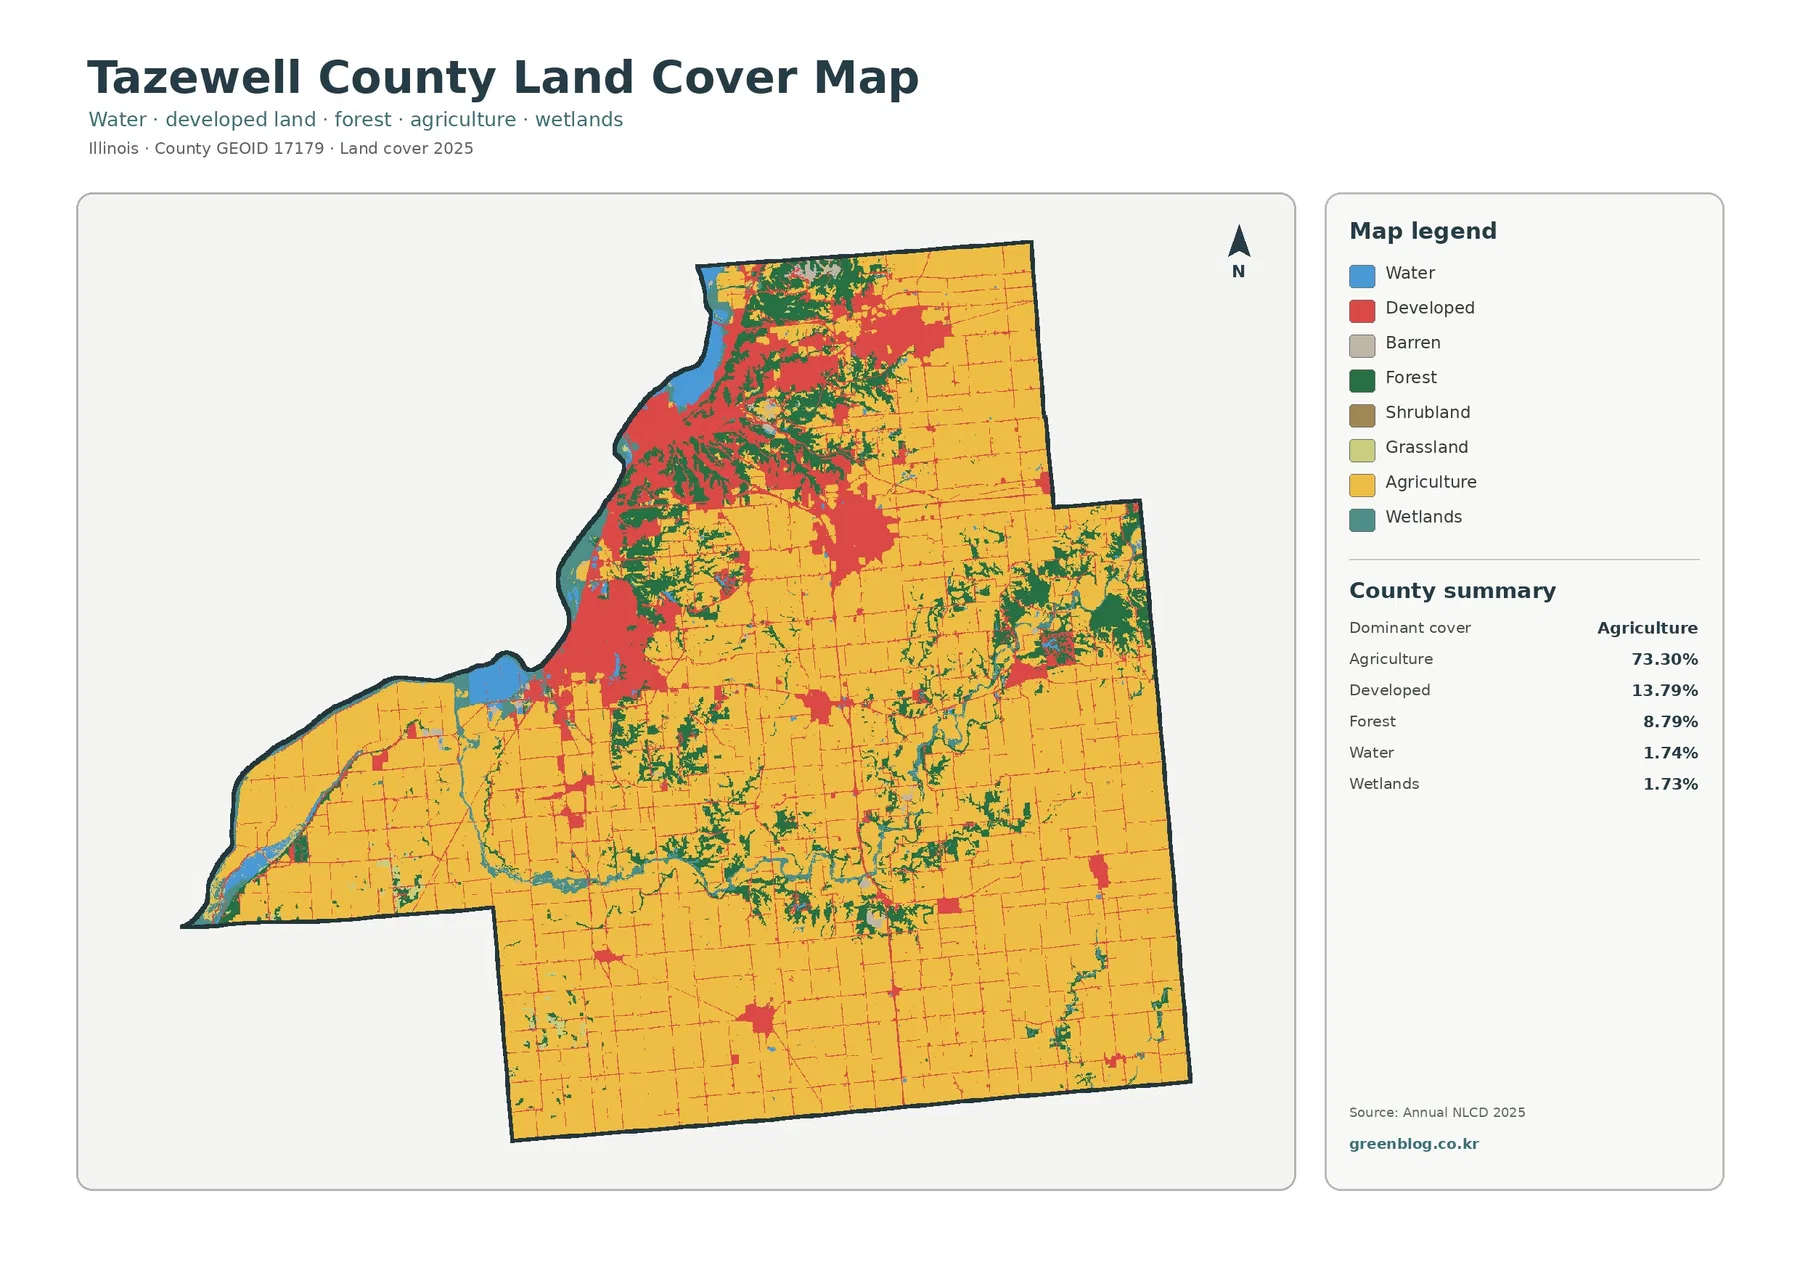
The shape of each class also matters. Farm areas tend to appear as large, regular blocks crossed by a grid of roads. Forest is more irregular, often following narrow or branching areas rather than filling large rectangular fields. Developed land forms broad clusters in the urbanized parts of the county and thin lines or small spots in rural areas. A reader looking only at the 13.79% developed figure could miss this concentration: the developed class occupies a meaningful share of the county, but most of it is not spread evenly across the agricultural interior.
Wooded areas stand out along the Illinois River and branching drainages
The forest-and-farmland map removes much of the visual competition from developed classes and makes the agricultural pattern easier to compare with wooded land. Cropland covers the broad interior, especially across the southern and eastern portions of the county. Forest, totaling 8.79%, appears in many narrow and uneven shapes. Several of the most visible wooded areas are near the western river side, while other green bands and clusters branch through the central and eastern parts of the county. This is not a county with one isolated forest block; wooded cover is distributed through many separate landscape features.
An official description of the local landscape mentions flat fertile fields along with wooded slopes, ravines, and forested riparian areas. The supplied map is consistent with that broad description because many green areas occur near water or in long, irregular forms between fields. The map does not prove why a particular strip of forest is located where it is, so it is better to describe the visible relationship than to claim a cause. Soil, topography, drainage, property history, and conservation decisions would require other sources if the reason for a specific woodland were important.
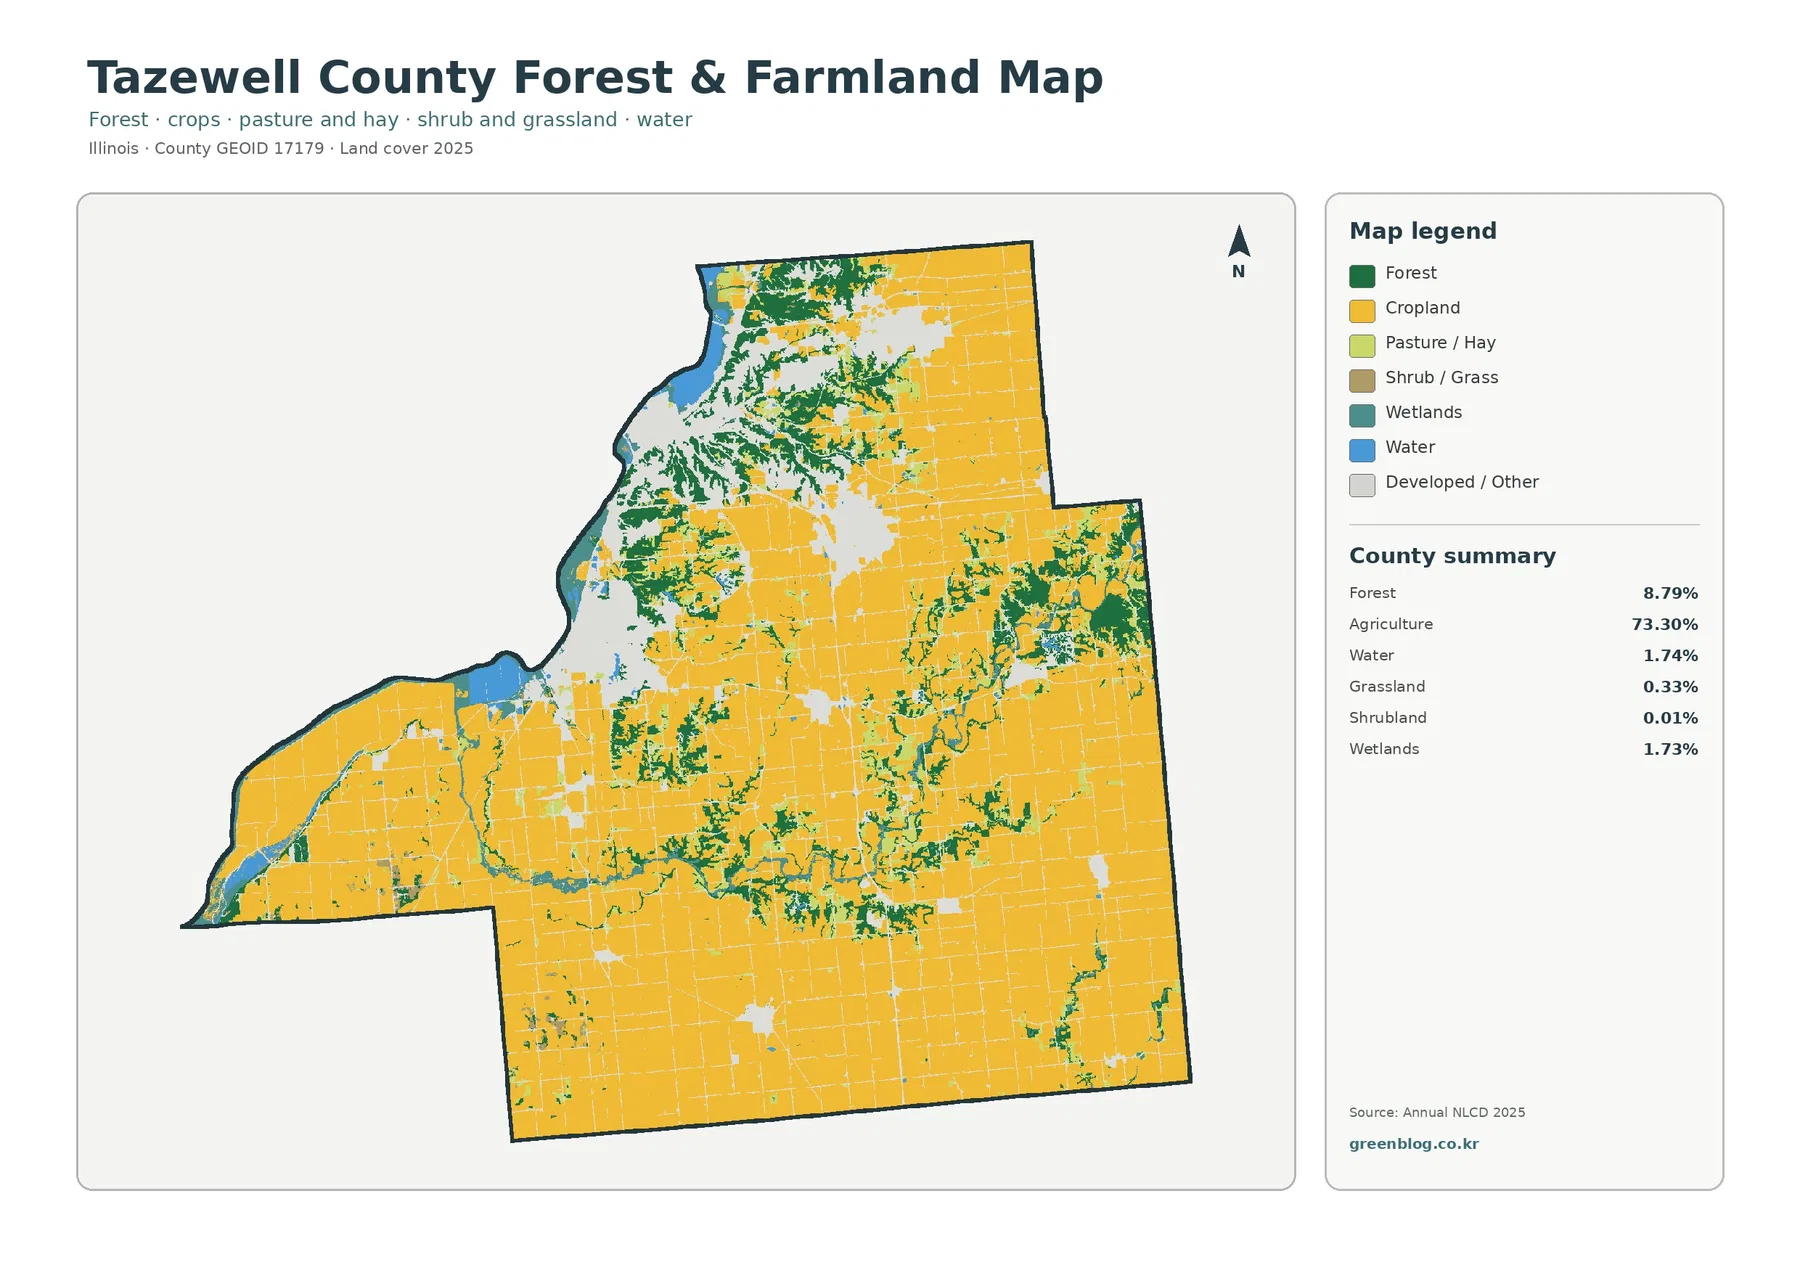
Water and wetlands are smaller classes but remain important to the map’s appearance. Water covers 1.74% and is most obvious along the Illinois River boundary, with smaller channels and water bodies elsewhere. Wetlands cover 1.73% and often appear in narrow areas near water and wooded land. These classes are easy to overlook when reading the county summary because each is below 2%, yet they help separate the river side and drainage areas from the large rectangular farm pattern. For a classroom or regional comparison, viewing water, wetland, and forest together gives a more complete picture than discussing agriculture alone.
Developed land is concentrated rather than evenly spread across the county
The red developed class is most substantial in the northwest and north, with another notable built-up cluster inland. Smaller communities and roads appear as separate spots and lines farther into the agricultural landscape. This concentration is important because Tazewell County is both part of the Peoria-Pekin metropolitan area and a county with extensive rural land. The general map captures that contrast clearly: a reader can move from large urbanized patches near the river and northern edge to broad agricultural sections within a relatively short distance on the same county map.
Developed land in NLCD should not be read as a map of pavement alone. The developed classes can include neighborhoods where buildings, streets, lawns, and trees occur together. That is why the developed share of 13.79% is much larger than the county’s average impervious percentage. To understand how much of the ground surface is actually covered by materials such as pavement and rooftops, the impervious-surface map is the better view.
Impervious cover rises sharply in urban areas but remains low across most farm country
An impervious surface is a hard surface that water does not readily soak through, including many roads, parking areas, and rooftops. Across the county, mean impervious cover is 4.55%, while 3.27% of the area is mapped above the 50% impervious threshold. Those numbers are useful because they separate the amount of hard surface from the broader developed-land classification. A residential area can be classified as developed while still containing lawns, trees, bare soil, or other surfaces that allow some infiltration.
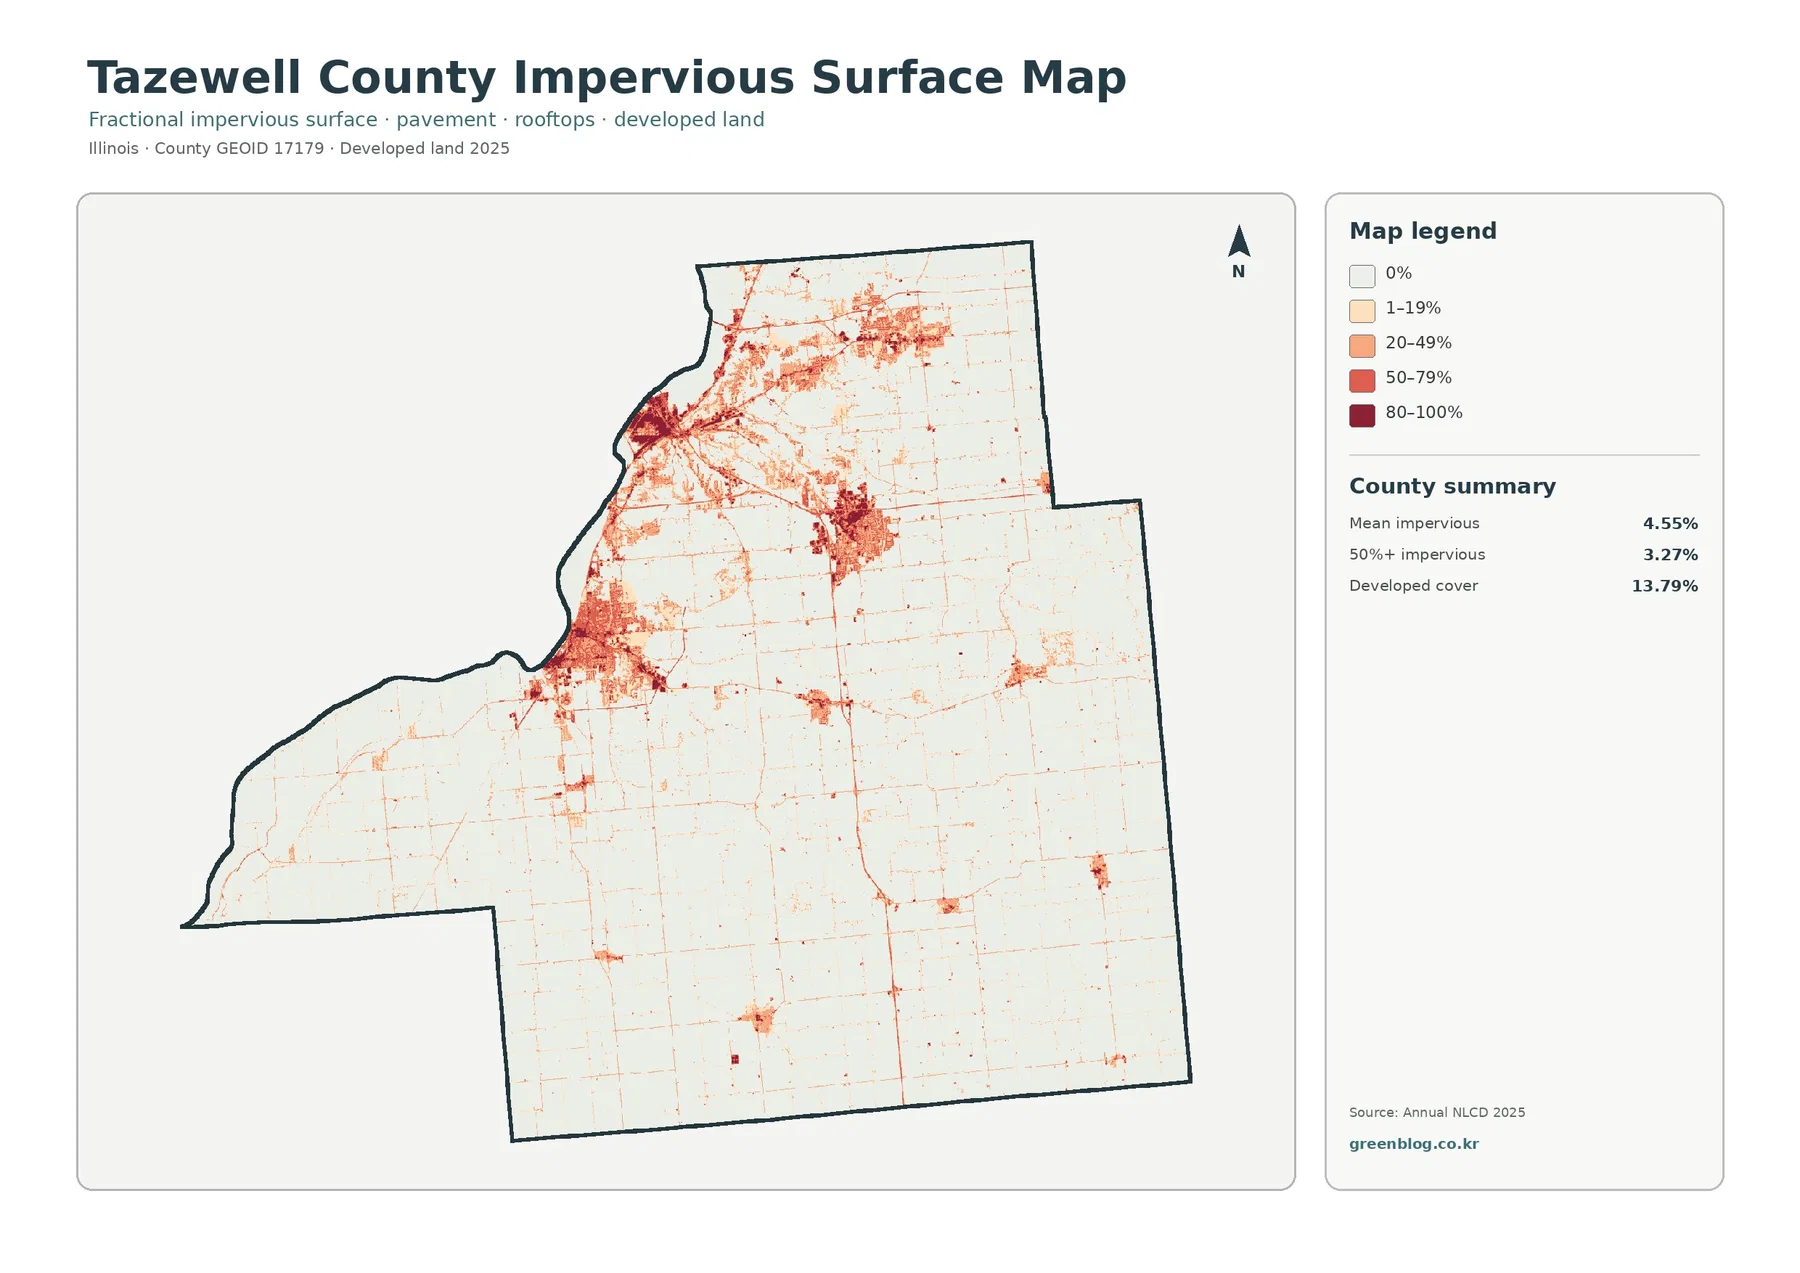
The darkest impervious values are strongly concentrated in the large developed areas, especially near the western river side and in the northern part of the county. Another dense cluster is visible farther inland, while most of the southern agricultural area remains pale. Rural roads form thin lines across the fields, and small settlements appear as isolated dots or compact patches. This map therefore gives a cleaner view of the urban-rural contrast than the general land-cover map when the question is specifically about pavement and building coverage.
Impervious cover can be relevant to runoff studies, but this map alone is not a flood-risk map. Flooding depends on terrain, rainfall, river levels, drainage systems, soils, and other conditions in addition to the amount of hard surface. A dark impervious area should not be interpreted as proof that a neighborhood will flood. A safer use is to identify places with concentrated hard surfaces and then compare them with official floodplain, stormwater, or drainage information when those questions matter.
The 1985–2025 comparison marks 7.89% of the county as a different class
The change map compares mapped classes from 1985 with those from 2025 rather than showing a simple before-and-after development total. Across Tazewell County, 7.89% is marked as a class difference. Of that summary, 2.44% is mapped as a transition to developed, 0.29% as forest loss, 0.65% as agricultural loss, and 4.37% as other class difference. Most of the county is gray, indicating no class difference in this comparison. The relatively small percentages for forest and agricultural loss are especially important when interpreting the colorful areas on the map.
Red areas representing a shift to developed are more visible around existing urban concentrations in the northwest and north, as well as near the inland built-up area. Purple “other difference” cells are more scattered across the county, and smaller yellow or orange patches appear in selected locations. The map is useful for finding places that deserve a closer look, but it does not say that every colored cell represents a major real-world land-use conversion. Some differences can arise from classification variation between years.
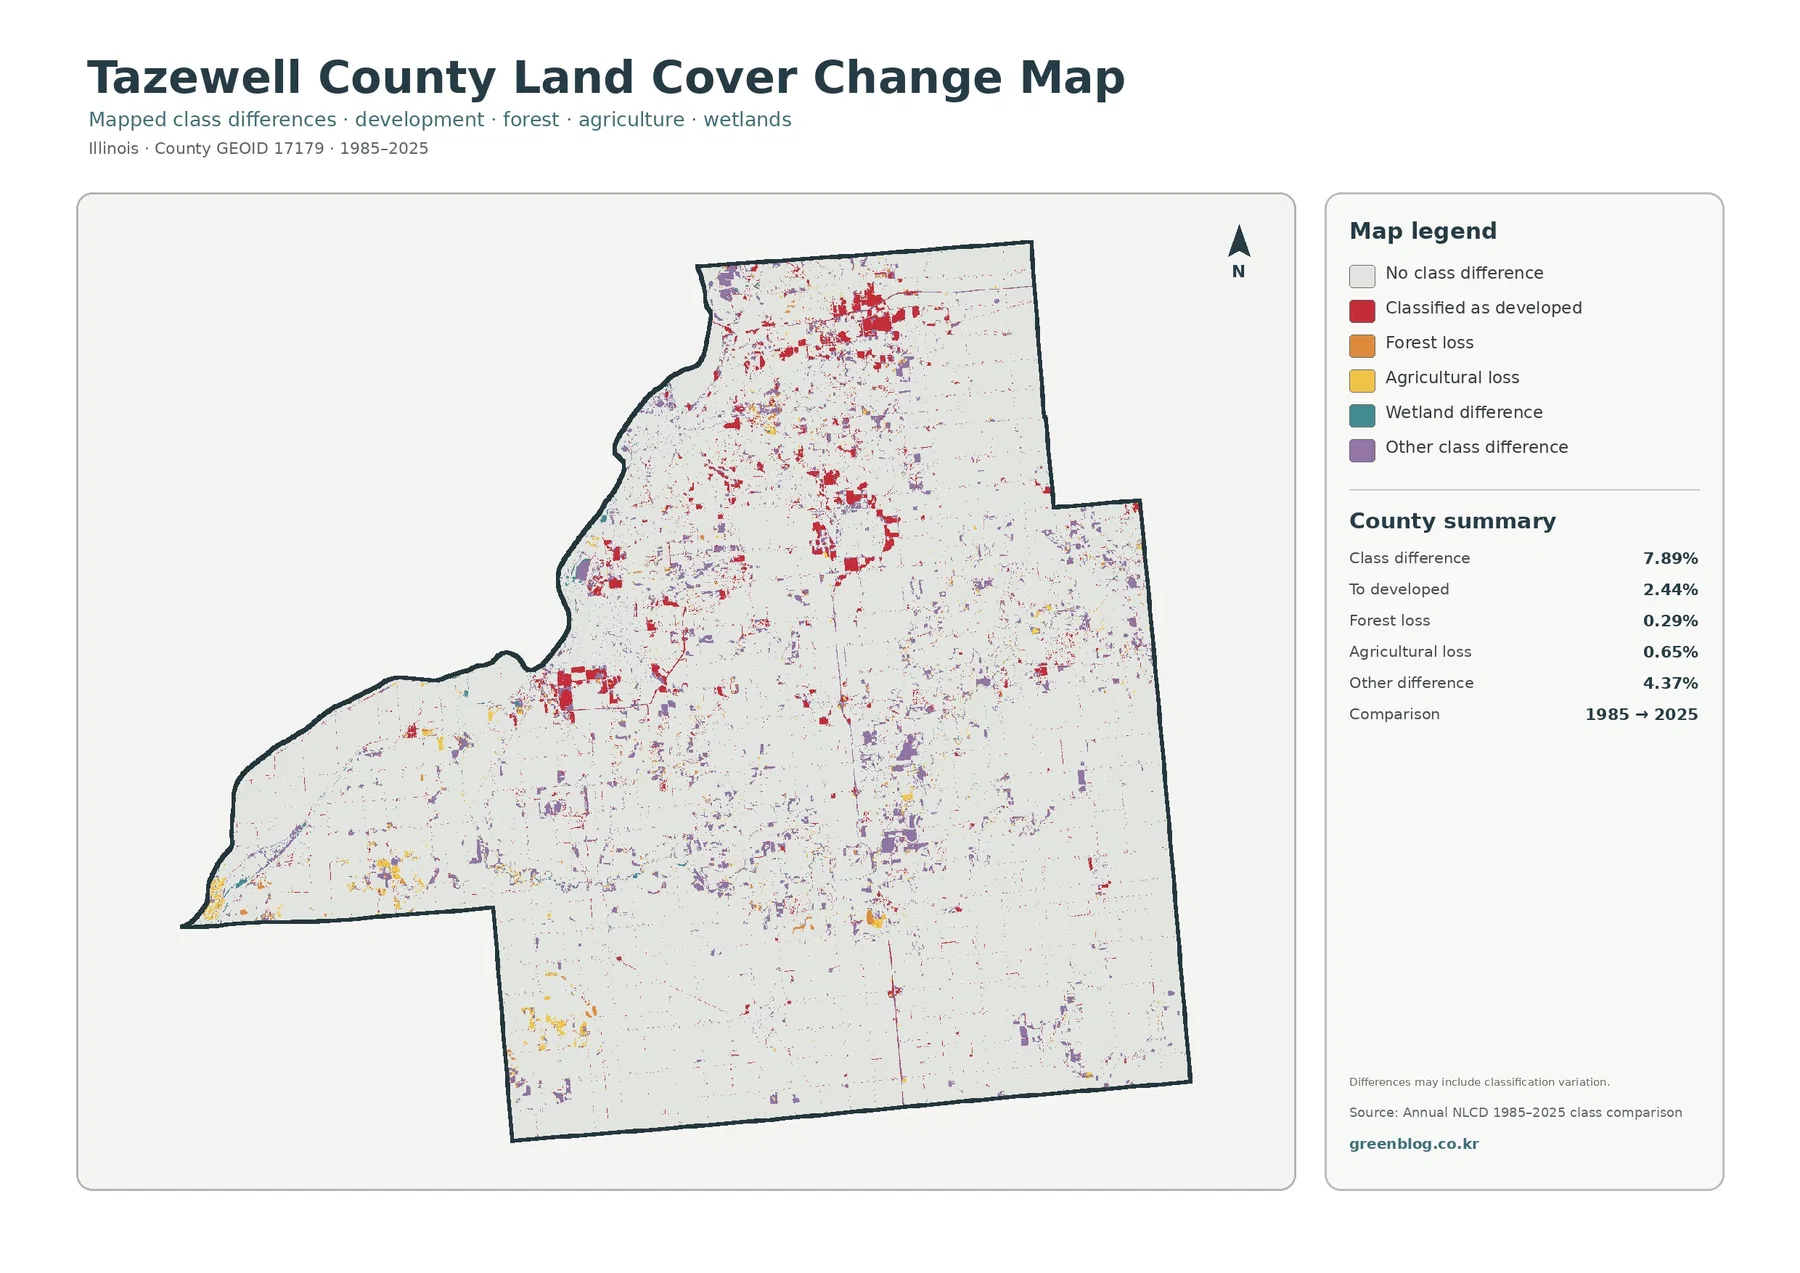
A classification difference should not automatically be reported as a verified change in legal land use. Satellite conditions, classification methods, mixed pixels, and edges between cover types can all affect how a cell is assigned. If a particular farm, woodland, or development site needs to be traced through time, the next step should be a comparison of multiple Annual NLCD years, historical aerial imagery, and local development records. For screening and comparison, the change map is useful, but it should not be treated as final evidence for a parcel-level claim.
The four map views answer different questions about the same county
For a quick county overview, start with the general land-cover map because it places agriculture, development, forest, water, and wetlands on one page. The forest-and-farmland version is better when the main question is how wooded land breaks up the agricultural landscape, especially around the Illinois River and branching drainage areas. The impervious view narrows the focus to hard surfaces in built-up locations. If the goal is to compare two dates and locate areas with different mapped classes, use the change map last.
This order also helps prevent common interpretation mistakes. A large red developed area on the general map does not mean the entire area is paved, and a colored patch on the change map does not automatically document a confirmed legal land-use change. By switching between the views, a reader can separate broad land-cover classification, actual hard-surface concentration, and long-term class differences. That distinction is especially useful in Tazewell County because the river-side urban areas and the large agricultural interior look very different depending on which measure is being mapped.
Thirty-meter raster cells are useful for county patterns, not parcel decisions
Annual NLCD is raster data, meaning the landscape is divided into regular cells and each cell receives a mapped value. At a 30-meter land-cover scale, a single cell can contain a field edge, a narrow road, trees, a small building, or several surfaces at once. The classification simplifies that mixed real-world scene into a value that can be compared consistently across a large area. As a result, narrow streams, small wooded strips, and sharp field boundaries may look less precise than they do in aerial photography.
That level of detail is appropriate for comparing countywide patterns, such as the broad agricultural share, the Illinois River edge, urban concentrations, and the distribution of forest along drainage features. It is not appropriate for deciding exactly where a parcel begins, whether a property can be developed, or what zoning applies. Official zoning and development information for unincorporated areas is available from Tazewell County Community Development, while parcel or survey questions require the appropriate local records rather than a land-cover classification map.
Download the four original JPG maps as one Tazewell County set
The downloadable ZIP contains four JPG files: the general land-cover map, the forest-and-farmland map, the impervious-surface and developed-land map, and the 1985–2025 land-cover change map. All four use the same county boundary, which makes them convenient to compare in reports, classroom materials, regional studies, or printed reference sheets. The WebP versions on this page are intended for quick viewing, while the JPG files are available when you need the original map images.
Choose the map that matches the question rather than treating all four as interchangeable. The first two are the most useful for agriculture and forest distribution. The impervious map is the clearest option for showing where hard surfaces cluster in the county’s developed areas. For long-term class differences, the change map helps identify candidate areas, but parcel-level history should be checked against other years and local records. Keeping each map’s legend with the image is also important because the colors and categories change from one view to another.
Frequently Asked Questions
Does the 73.30% agriculture figure mean that 73.30% of Tazewell County is legally zoned farmland?
No. The 73.30% figure is the share classified as agricultural land cover in the supplied 2025 map. It describes the physical surface seen in the land-cover dataset, not legal zoning, ownership, tax status, or permitted parcel use. For a zoning or development question, use Tazewell County Community Development information and the relevant parcel records instead of the NLCD land-cover percentage.
Why do forest, water, wetland, and developed land appear together along the western side of the county?
The supplied maps show those classes close together along the Illinois River side, and Tazewell County’s official information confirms that the county lies on the Illinois River next to Peoria and includes Pekin. The maps support describing that visible geographic association, but they do not establish a single cause for the pattern. Explaining why a specific forest, wetland, or developed area formed would require additional topographic, ecological, historical, or planning sources.
Can the 7.89% class difference from 1985 to 2025 be used as a confirmed land-use change rate?
It should not be used that way by itself. The 7.89% total includes 2.44% mapped to developed, 0.29% forest loss, 0.65% agricultural loss, and 4.37% other class difference. Classification methods, image conditions, mixed pixels, and cover boundaries can also create differences between years. A specific change should be checked against additional NLCD years, aerial imagery, and local records before it is described as confirmed land-use history. Map File Information Download four original JPG maps for Tazewell County to compare agriculture, forest, developed land, impervious surfaces, and mapped class differences from 1985 to 2025.
Map File Information
Download the map files associated with this page for reference, printing, and compatible visual projects.
- Included Files: Use only the versions confirmed in the article and supplied images
- File Type: Use the confirmed download contents
- Intended Use: Printing, education, presentations, and map-based projects
Related Maps
- Adams County Illinois Land Cover Map
- Alexander County Illinois Land Cover Map
- Bond County Illinois Land Cover Map
Sources and References
The map percentages and visual descriptions in this article come from the supplied Annual NLCD 2025 maps and the 1985–2025 class comparison. MRLC and USGS provide the underlying land-cover resources and classification guidance, while Census TIGER/Line data provides a standard source for county geography. Official county history and Community Development pages were used only for local context about the Illinois River, Pekin, agriculture, and the distinction between land cover and legal zoning or development rules.
- MRLC Annual NLCD Data – Annual land-cover and impervious-surface datasets
- USGS Annual NLCD Land Cover Classification – Land-cover classes and interpretation guidance
- U.S. Census Bureau TIGER/Line Shapefiles – Standard county boundary and geographic reference data
- Tazewell County History – Official county context for the Illinois River, Pekin, agriculture, and the local landscape
- Tazewell County Community Development – Official zoning and development information distinct from land-cover classification
Green Map creates custom-edited map images using open geographic data sources such as geoBoundaries, Natural Earth, OpenStreetMap, and government open data.
These maps are edited visual materials, not raw data files, and are provided for education, documents, presentations, and graphic reference.