McDonough County’s 2025 land-cover pattern is dominated by agriculture, which accounts for 79.38% of the mapped area, but the county is not visually uniform. Macomb forms a strong developed center near the middle of the county, while wooded bands become much more prominent to the west and southwest. The four maps on this page separate those features into current land cover, forest and farmland, impervious surface, and a 1985–2025 class comparison.
For quick viewing, the page uses WebP images, while the four original JPG maps are available together in one ZIP. Use the general land-cover map when you need the full surface mix, the forest-and-farmland version for the boundary between fields and woods, the impervious layer for hard surfaces around towns and roads, and the change map only when comparing the two endpoint years.
Table of Contents
Macomb stands out as the county’s largest concentration of developed and impervious surface
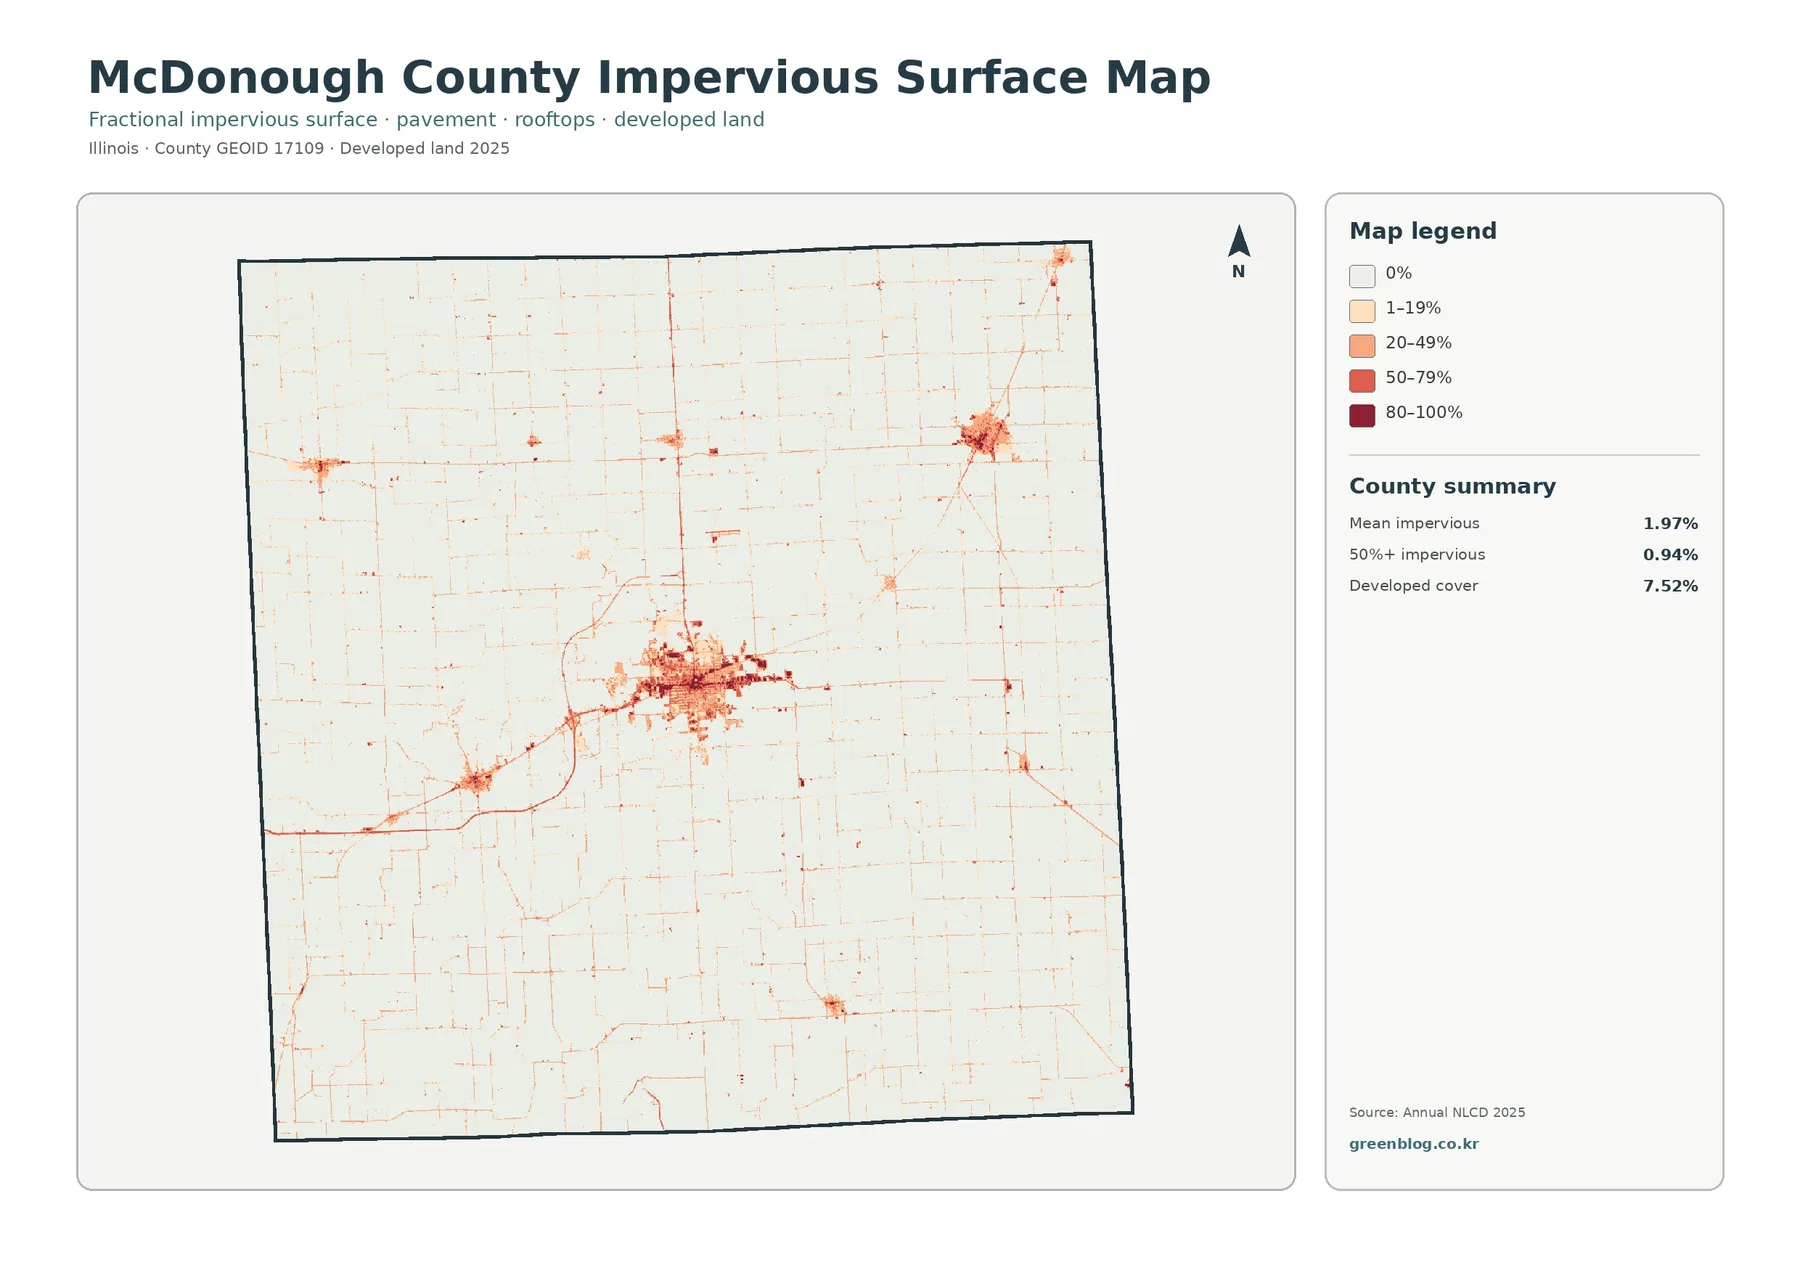
Impervious surface is a useful place to begin because this layer strips away most of the agricultural color that dominates the general map. The darkest cluster sits around Macomb, which the city’s official website describes as the county seat located near the center of McDonough County. From that core, thinner lines extend outward along roads, while several smaller developed clusters appear elsewhere in the county. Most of the surrounding countryside remains very pale on this layer.
Countywide mean impervious surface is 1.97%, and only 0.94% of the county is summarized as having more than 50% impervious cover. Those figures are much lower than the 7.52% developed-cover share on the general map. The difference is expected because “developed” is a land-cover class that can contain lawns, trees, exposed soil, buildings, and pavement, whereas impervious surface estimates the harder material within a cell, such as rooftops, parking areas, and paved roads.
Agriculture covers 79.38%, yet wooded corridors break up the western and southwestern interior
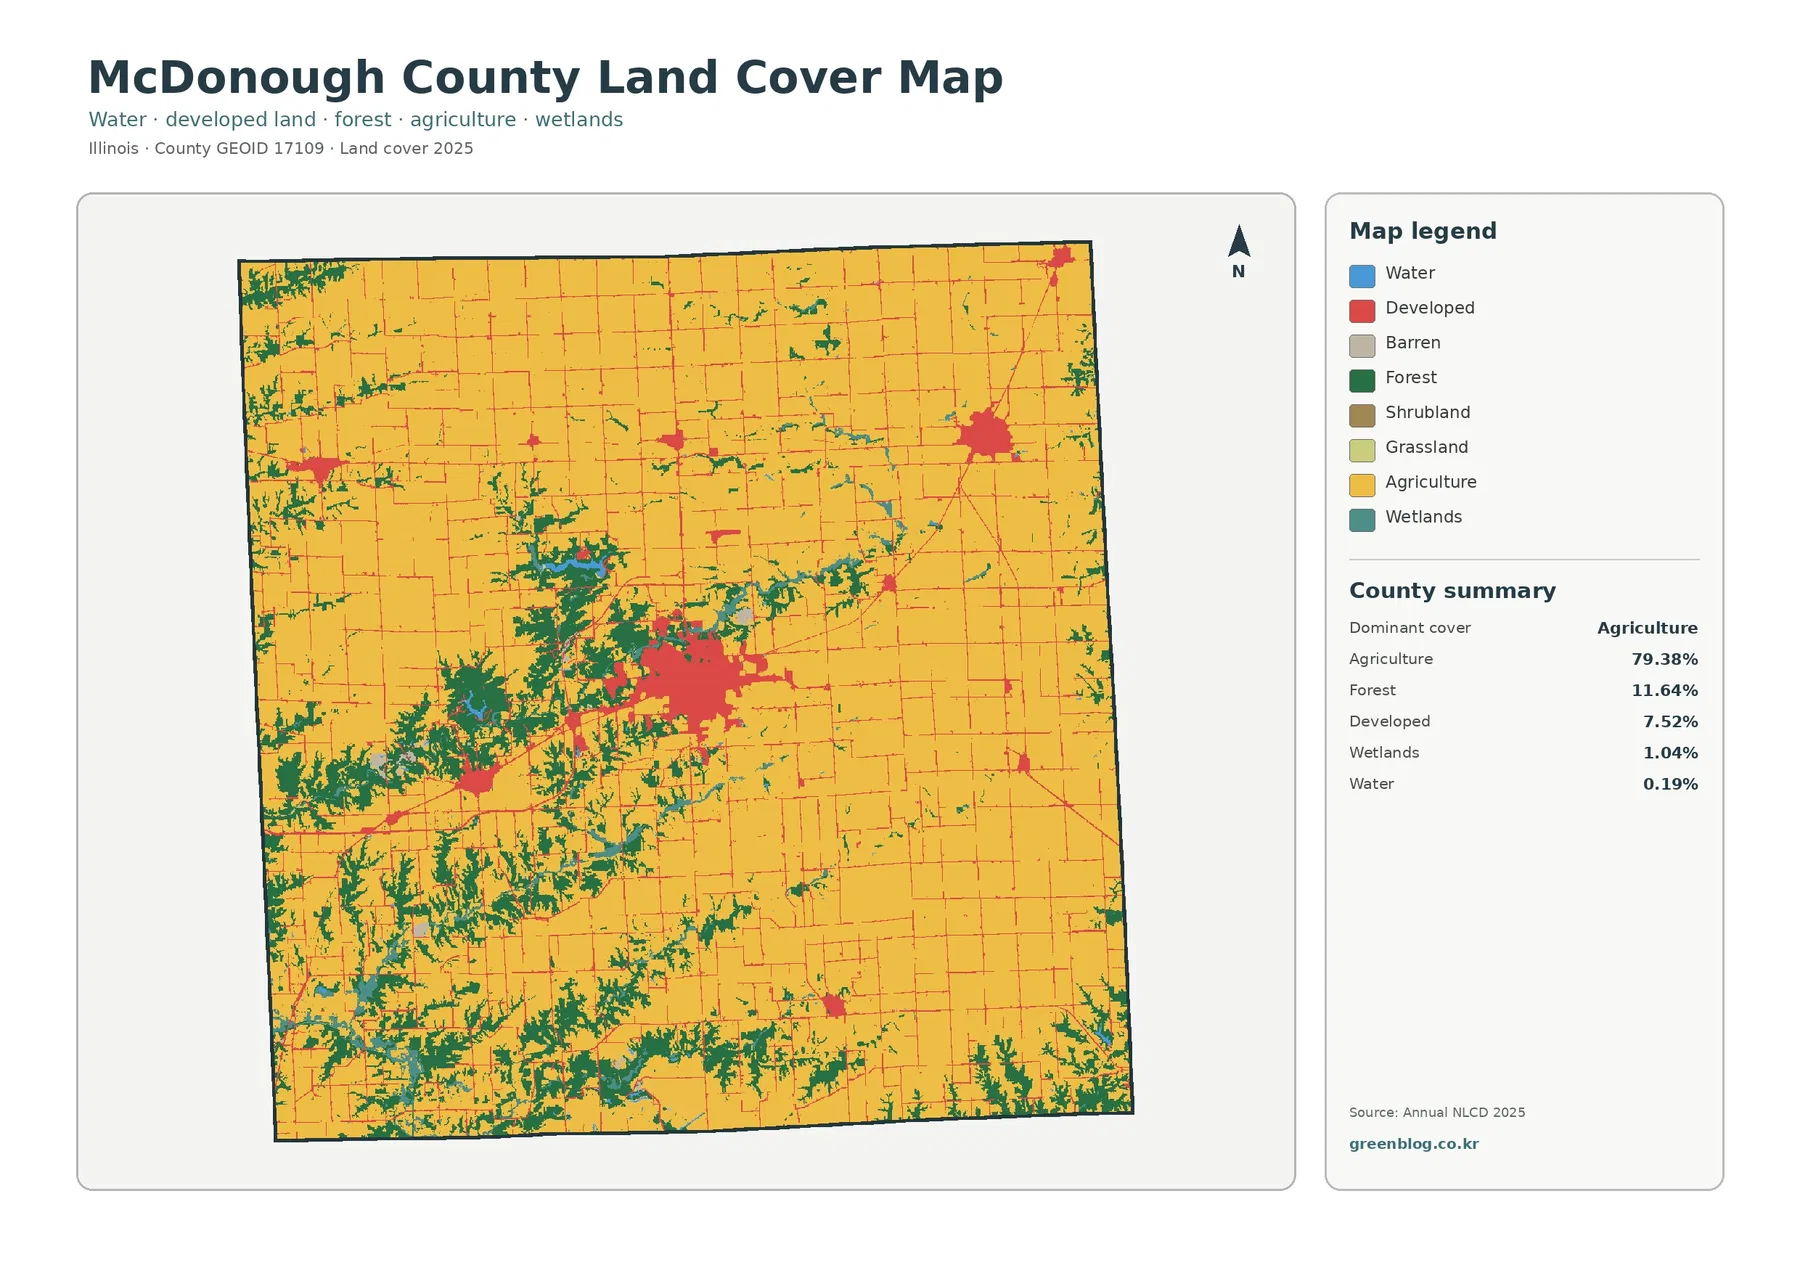
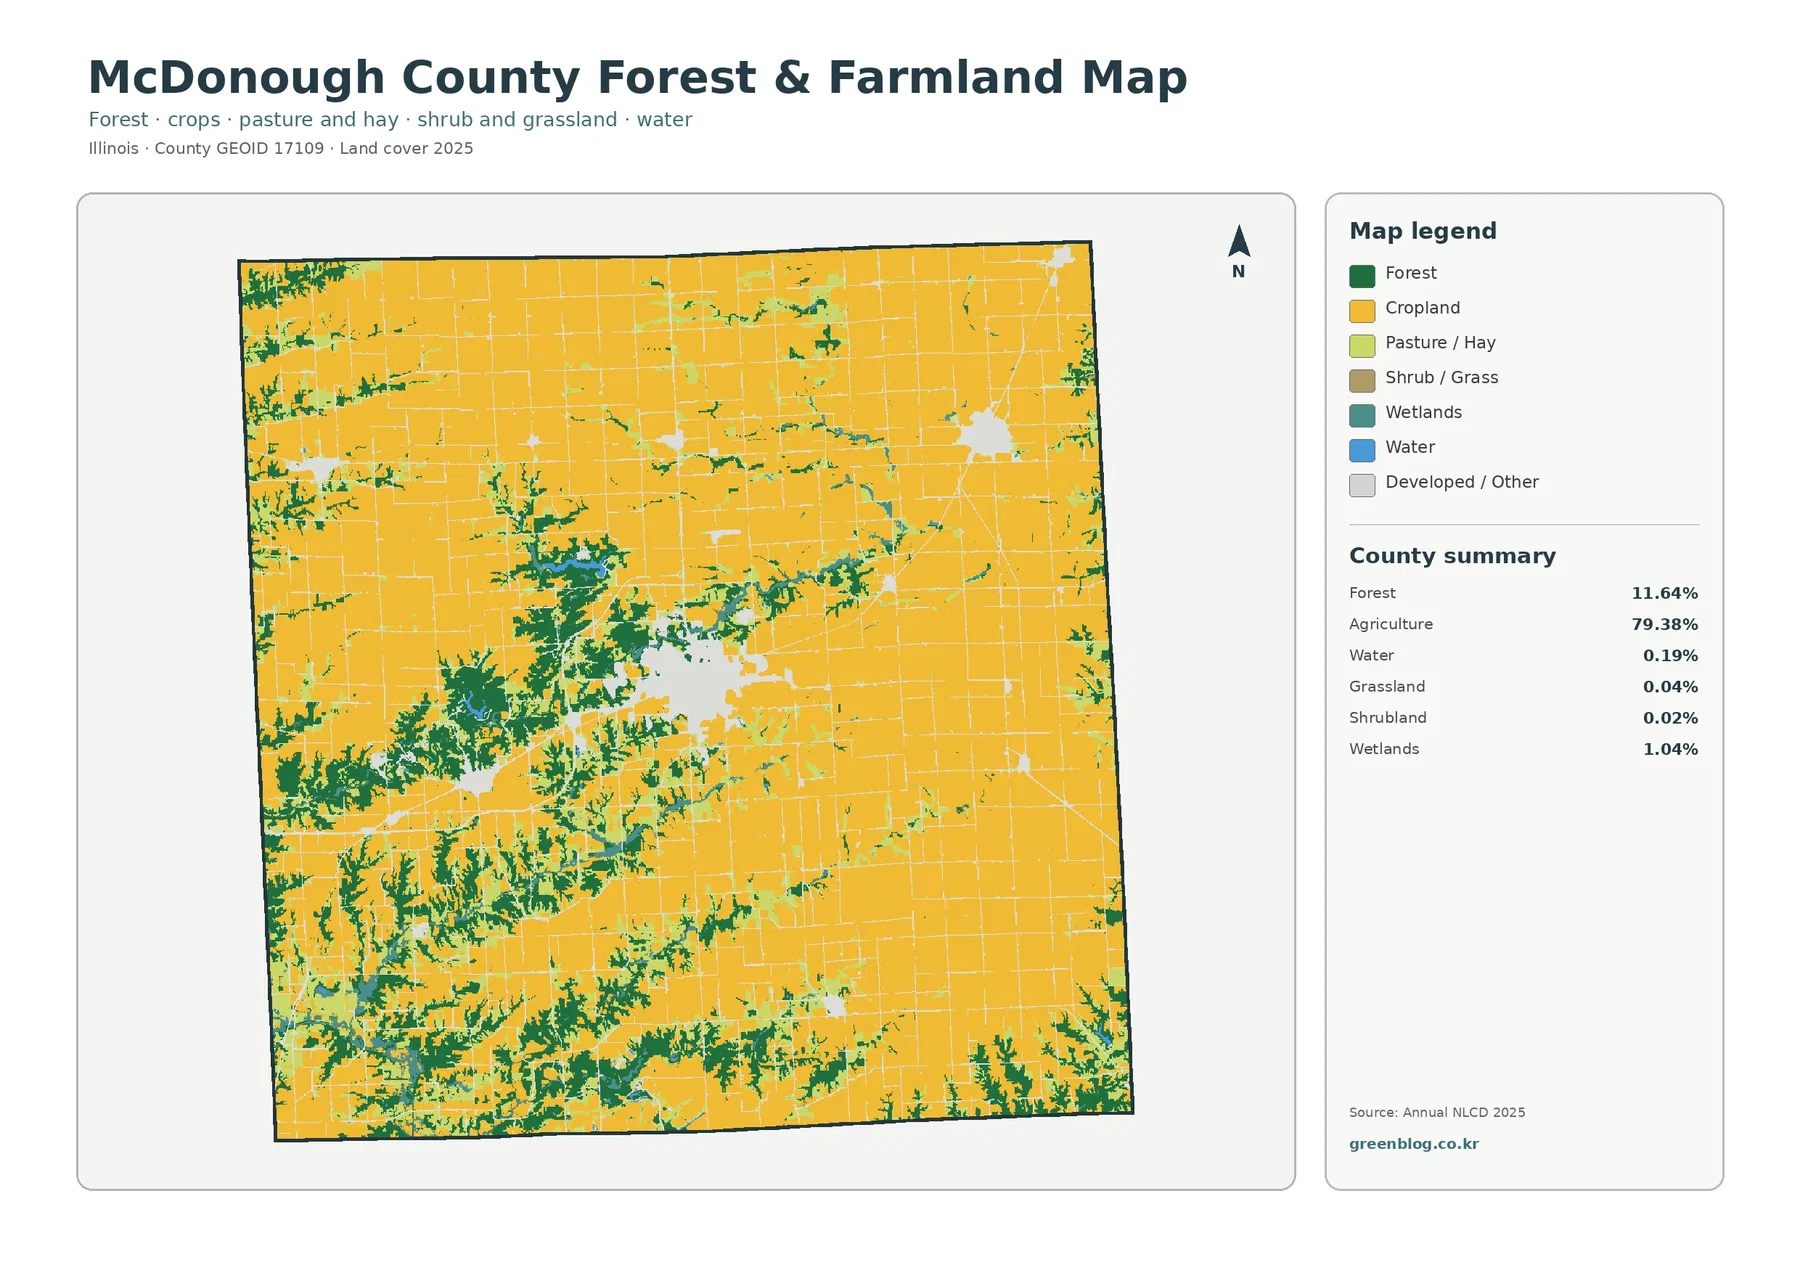
Switching to the full 2025 land-cover map puts the county’s dominant class back into view. Agriculture covers 79.38%, forest 11.64%, developed land 7.52%, wetlands 1.04%, and water 0.19%. Large yellow agricultural blocks fill much of the north and east. In contrast, green forest becomes increasingly visible west and southwest of Macomb, where irregular branches and patches interrupt the field pattern rather than following the rectilinear shape of the road-and-field grid.
A simplified forest-and-farmland view makes the southwest pattern easier to follow
Removing most developed detail changes what draws the eye. Broad cropland blocks remain dominant across the north and east, while forest becomes a more continuous system of green branches in the southwest and west-central part of the county. Around Macomb, the light developed area interrupts that pattern, with farmland and woodland meeting along its outer edges. The simplified view is especially useful when the question is where agricultural ground remains continuous and where wooded cover divides it.
The 8.37% 1985–2025 class difference is scattered rather than a single countywide conversion
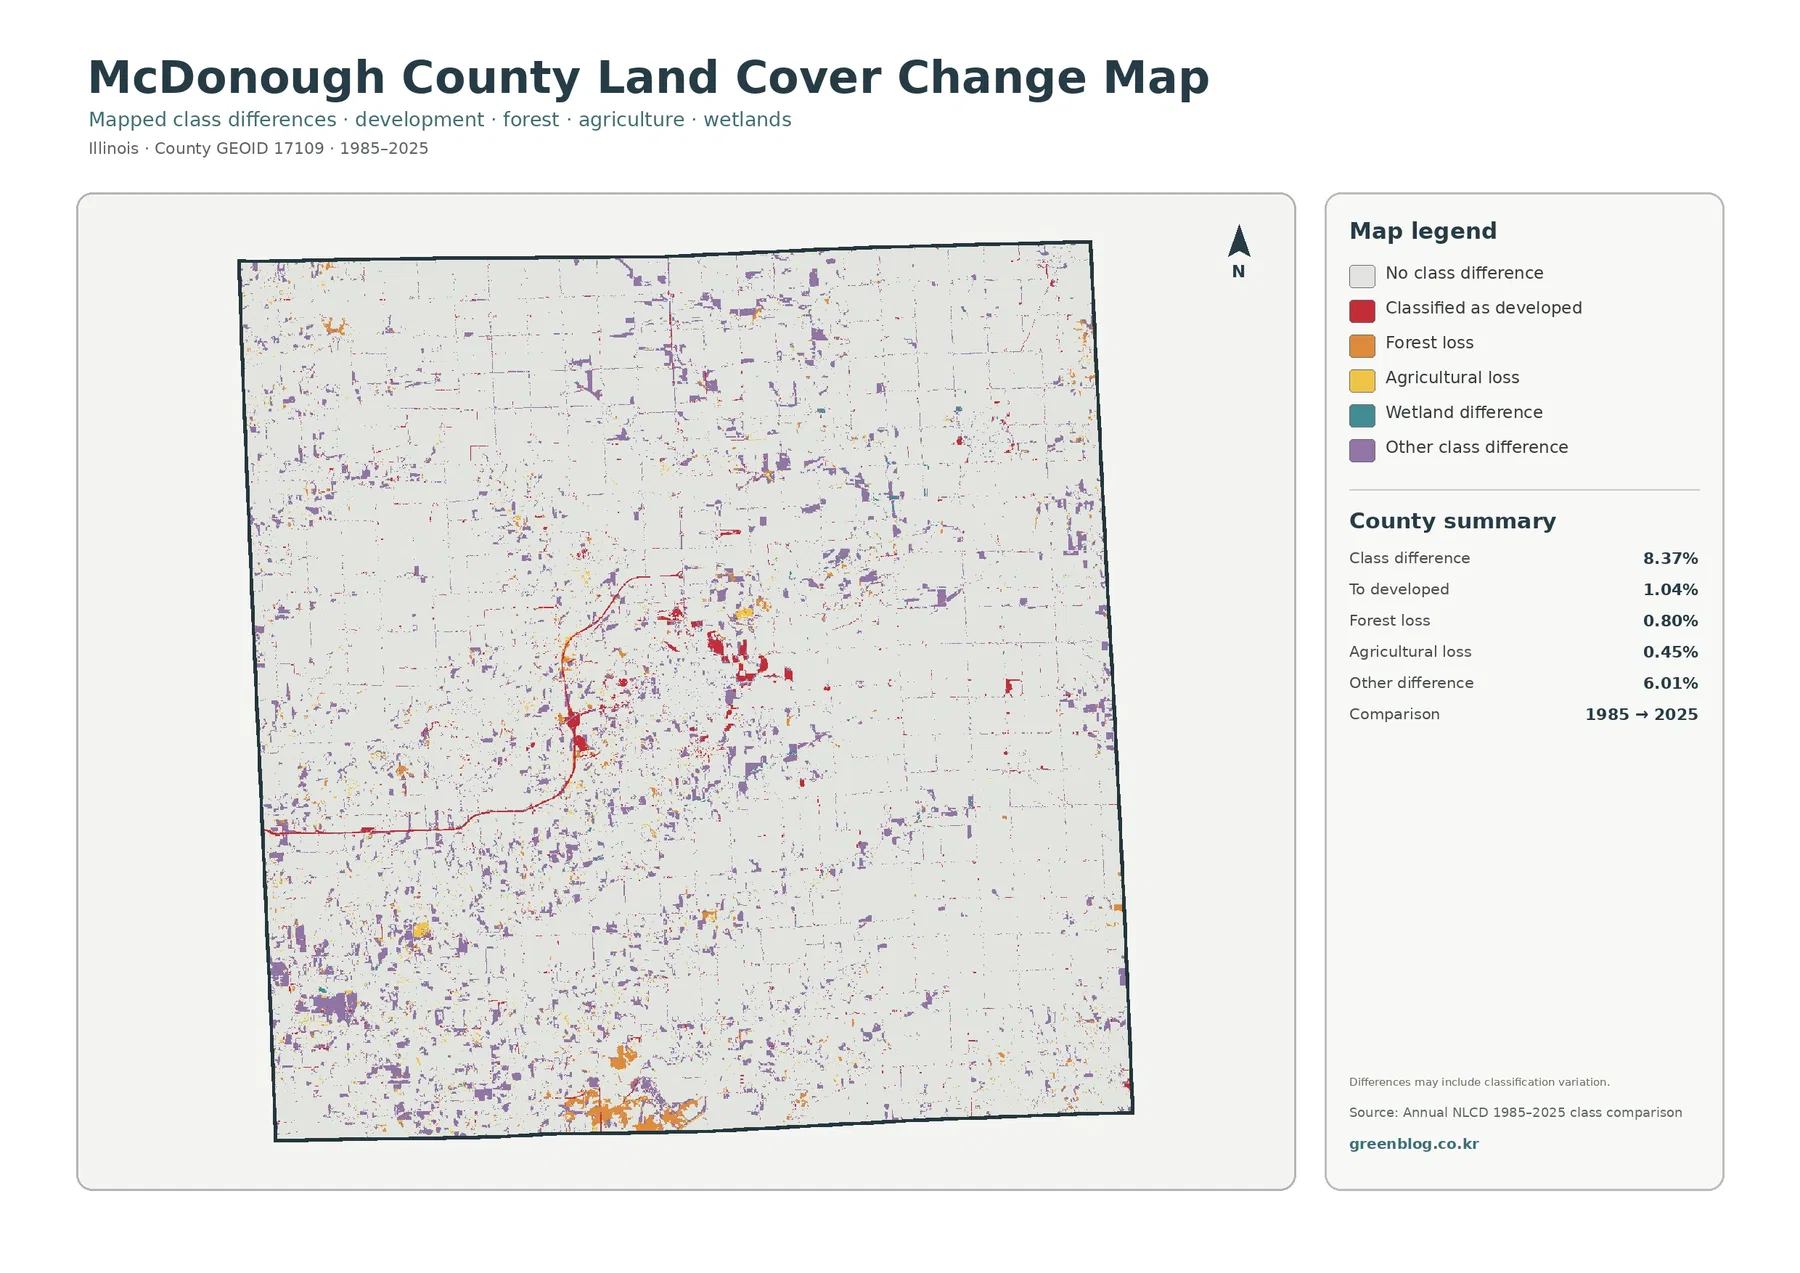
For the historical view, the map compares the representative land-cover class at two endpoints, 1985 and 2025. The county summary reports 8.37% total class difference. Of that total, 1.04% is mapped as change to developed, 0.80% as forest loss, 0.45% as agricultural loss, and 6.01% as other class difference. Wetland difference is shown as its own legend category, but the supplied summary does not print a separate percentage for it, so no exact value should be inferred.
Red change cells are most noticeable around Macomb, while orange, yellow, purple, and other small differences appear across rural parts of the county. The southwest contains many scattered changes around the complicated forest-field boundary, and smaller differences also occur through the northern and eastern agricultural areas. The map does not show a single broad band of one change type sweeping across McDonough County, which is why the total 8.37% should not be summarized as “8.37% urbanized” or “8.37% farmland lost.”
One location can look completely different across the four maps
Macomb provides the clearest example. On the general land-cover map, it appears as a broad developed area surrounded by agriculture and nearby forest. On the impervious map, only the harder portions of that built area become dark, revealing variation within the developed class. The forest-and-farmland version pushes the city into the background so the rural boundary is easier to trace. The change map then removes most current cover and highlights only cells whose endpoint classes differ.
County-scale raster cells are not parcel surveys, zoning maps, or regulatory wetland boundaries
Annual NLCD is raster data, meaning the landscape is represented by a grid of cells rather than surveyed parcel polygons. At the scale used for this type of classification, one cell can mix field edge, trees, pavement, a building, and water. A single representative class is assigned, so narrow woodland strips may look broken, small wetlands may be generalized, and boundaries can appear slightly wider or narrower than they do on high-resolution aerial imagery.
Keep the four JPG files together so the legend, year, and measurement stay attached to the right map
For a single current-condition reference, the general JPG gives the clearest full 2025 land-cover picture. The forest-and-farmland file is cleaner for comparing agricultural blocks with wooded corridors. The impervious version isolates the concentration of hard surfaces around Macomb and smaller centers, while the 1985–2025 map should be used only for the supplied endpoint classification comparison. Saving the full set makes it easier to switch views without confusing their statistics.
According to the asset manifest, each original JPG is 2480×1754 pixels. It does not mark the files as meeting the package’s A3 high-resolution reference, so large-format printing should be tested before the maps are used as final poster graphics. They remain useful for screen reference, ordinary printing, presentations, classroom comparison, and county-scale research context. Surveying, engineering, permitting, or parcel-level decisions require more detailed official data.
Frequently Asked Questions
Why does forest look so prominent in the southwest if it is only 11.64% of the county?
Forest is not spread evenly across McDonough County. Much of it forms connected or branching bands west and southwest of Macomb, while broad agricultural blocks dominate the north and east. A cover type that is concentrated in continuous shapes can be visually stronger than the same percentage scattered uniformly. The map therefore needs both the countywide percentage and the spatial pattern to be understood correctly.
Why is developed cover 7.52% while mean impervious surface is 1.97%?
They measure different characteristics. Developed land is a cover class that can include buildings, pavement, lawns, trees, and other surfaces within a built setting. Impervious surface estimates the harder portion that resists water infiltration. A developed cell can therefore remain partly permeable, which is why the developed-cover share can be several times larger than the countywide mean impervious value.
Does the 8.37% class difference mean that 8.37% of McDonough County was converted to a new use?
No. The total combines several mapped categories, including change to developed, forest loss, agricultural loss, wetland difference, and other class difference. Classification variation can also contribute, especially near mixed land-cover edges. The map compares two endpoint classes; it does not identify the date, cause, legal land use, or full sequence of changes for each cell.
Sources and Reference Data
Percentages for 2025, the impervious summary, and the 1985–2025 class-difference values in this article come from the supplied McDonough County maps and legends. The official resources below provide background on Annual NLCD classification, the county government, Macomb’s location, and the La Moine River setting. Statistics from these sources are not merged into the supplied land-cover totals.
- MRLC Annual NLCD Data – official Annual NLCD data access and product information
- USGS Annual NLCD Land Cover Classification – definitions and guidance for land-cover classes
- McDonough County official website – county government and comprehensive-plan information
- City of Macomb official website – local information identifying Macomb as the centrally located county seat
- USGS La Moine River at Colmar monitoring location – a USGS stream site in McDonough County
Map File Information
Download the map files associated with this page for reference, printing, and compatible visual projects.
- Included Files: Use only the versions confirmed in the article and supplied images
- File Type: Use the confirmed download contents
- Intended Use: Printing, education, presentations, and map-based projects
Related Maps
Green Map creates custom-edited map images using open geographic data sources such as geoBoundaries, Natural Earth, OpenStreetMap, and government open data.
These maps are edited visual materials, not raw data files, and are provided for education, documents, presentations, and graphic reference.